


Abstract
Aims
To compare the in vivo long-term fixation achieved by two acetabular components with different porous ingrowth surfaces using radiostereometric analysis (RSA).
Methods
This was a minimum ten-year follow-up of a prospective randomized trial of 62 hips with two different porous ingrowth acetabular components. RSA exams had previously been acquired through two years of follow-up. Patients returned for RSA examination at a minimum of ten years. In addition, radiological appearance of these acetabular components was analyzed, and patient-reported outcome measures (PROMs) obtained.
Results
In all, 15 hips were available at ten years. There was no statistically significant difference in PROMS between the two groups; PROMs were improved at ten years compared to preoperative scores. Conventional radiological assessment revealed well-fixed components. There was minimal movement for both porous surfaces in translation (X, Y, Z, 3D translation in mm (median and interquartile range (IQR)), StikTite (Smith and Nephew, Memphis, Tennessee, USA): 0.03 (1.08), 0.12 (0.7), 0.003 (2.3), 0.37 (0.30), and Roughcoat (Smith and Nephew): -0.6 (0.59),–0.1 (0.49), 0.1 (1.12), 0.48 (0.38)), and rotation (X, Y, Z rotation in degrees (median and IQR), (Stiktite: -0.4 (3), 0.28 (2), -0.2 (1), and Roughcoat: - 0.4 (1),–0.1 (1), 0.2 (2)). There was no statistically significant difference between the two cohorts (p-value for X, Y, Z, 3D translation - 0.54, 0.46, 0.87, 0.55 and for X, Y, Z rotation - 0.41, 0.23, 0.23 respectively) at ten years. There was significant correlation between two years and ten years 3D translation for all components (r = 0.81(p =< 0.001)).
Conclusion
Both porous ingrowth surfaces demonstrated excellent fixation on plain radiographs and with RSA at ten years. Short-term RSA data are good predictors for long-term migration data.
Take home message
This study reinforces the predictive power of early RSA data for long-term migration.
Both porous ingrowth surfaces demonstrated excellent fixation on plain radiographs and with RSA at ten years follow-up.
Introduction
The demand for total hip arthroplasty around the world continues to drive innovation in the development of new technology. As has been demonstrated in a number of national joint registries, the most common reason for revision arthroplasty continues to be loosening of the implant which can be due to poor initial fixation or osteolysis.1-3
As innovation continues, it is imperative that new technologies continue to be monitored because continuously increasing migration of implants may imply loosening of the component. The assessment of the long-term stability and outcomes of implants is therefore essential.4
Cementless acetabular components were first introduced in the 1970s and today there are several different surface finishes in use. In North America, approximately 95% of implanted acetabular components are cementless and rely on a porous ingrowth surface to achieve long-term biological fixation and good initial mechanical stability through a press fit to allow bone in-growth.5 These porous ingrowth surfaces consist predominantly of either crimped wire or sintered beads and have shown excellent clinical and radiological outcomes.6-8 Interest in surfaces with a higher porosity and coefficient of friction has increased as this would allow higher rate of bone ingrowth and increased shear strength at the bone-implant interface in addition to better initial implant fixation.9-12
The aim of this study was to assess the long-term clinical outcomes, survivorship and fixation of two different porous ingrowth surfaces using radiostereometric analysis (RSA). We examined a 61% high porosity asymmetric titanium porous surface (StikTite; Smith and Nephew, Memphis, Tennessee, USA) and compared this surface to a 45% low porosity sintered bead porous surface (Roughcoat; Smith and Nephew). We hypothesized that there is no significant migration in both rotation and translation for both components at ten years follow-up compared to the two years RSA data, and that there is a positive correlation between the two- and ten-year RSA data.
Methods
This was a minimum ten-year follow-up study of a previously published prospective randomized controlled study. For the purposes of the original study a power calculation was performed considering an α of 0.05 and a ß of 0.20 (power = 80%) to detect a difference of 0.19 mm between groups. The population of our original study composed of 62 patients (62 hips) who were enrolled, of which six were lost due to lack of initial follow-up examination, refusal to participate further, a non-displaced acetabular fracture, or missing tantalum beads. Thus, the original study consisted of 56 patients.13 These patients were recalled for the current study at a minimum of ten years for clinical, radiological, and RSA examination. There were no relevant differences in patient demographics in the two groups in the original cohort.13 The study was approved by the Institutional Ethics Committee and all patients provided informed consent.
The patients in the original cohort were randomized to receive either a sintered bead porous surface (Roughcoat) or a titanium anatomical porous surface (StikTite) acetabular component (Reflection; Smith and Nephew), and a Synergy stem (Smith and Nephew). There were 33 patients in the Stiktite group and 29 in the Roughcoat group.13
RSA analysis was performed using established methods14,15 and as described in the initial study.13 At index surgery, 0.8 mm tantalum beads were implanted into the polyethylene liner with four beads at the upper peripheral area and four beads at the bottom peripheral area in order to be visible from both views. Five to nine beads were inserted into the surrounding acetabular bone. Component migration was measured by determining the relative movement between the liner bead segment and the bone bead segment. In the initial study, the reference RSA examination was carried out postoperatively within one week after surgery, and then at six weeks, three and six months, and one and two years. For the purposes of the current study, a further RSA examination was performed at a minimum of ten years.
Radiostereometric examinations were performed in a dedicated RSA lab with two ceiling-mounted radiograph units (Proteus XR/a; GE Medical Systems, Milwaukee, Wisconsin, USA), positioned 40° with each other and simultaneously exposed. Digital images were acquired by a calculated radiography digital radiograph system (Capsula X CR, Fujifilm, Tokyo, Japan), which provides a 3520 × 4280 image matrix for a 35 × 43 cm cassette. Component migration was calculated using RSA software (UmRSA, RSA Biomedical, Umeå, Sweden). Migration results were expressed as rotation and translation about and along the three axes using an orthogonal coordinate system (6° freedom of motion).
Secondary outcome measures
Conventional radiographs were also taken including anteroposterior and true lateral views of the hip at the most recent follow-up and evaluated by two fellowships trained arthroplasty surgeons (LR, MI). Radiological signs of osseointegration between host bone and the acetabular shell were assessed according to the criteria of Moore et al.16 These included the absence of radiolucent lines, presence of radial trabeculae, presence of medial stress shielding, presence of an infero-medial buttress and superolateral buttress. When three or more signs are present, the positive predictive value for bone ingrowth is 96.9%, the sensitivity is 89.9%, and the specificity 76.9%. The presence of new radiolucent lines at the bone-prosthesis interface was also evaluated on all follow-up films using the zones delineated by DeLee and Charnley.17 The Harris Hip Score (HHS),18 Western Ontario and McMaster Universities Arthritis Index (WOMAC),19 and the 12-Item Short Form Survey (SF-12)20 were administered preoperatively and at the same intervals as RSA examinations postoperatively to determine clinical outcomes.
Statistical analysis
The RSA data used in the analysis included the six-week, three- and six-months, and one-, two-, and ten-year data. Statistical analysis was performed using the IBM SPSS software. The Mann-Whitney U test was used to compare non-parametric data and the t-test was used for parametric data analysis. Wilcoxon signed ranks test was used to compare preoperative PROMs to postoperative scores as well as comparing two- to ten-year RSA data. Pearson correlation test was used to correlate the two-year to ten-year follow-up RSA data. A p-value of 0.05 was used for statistical significance.
Results
There were 62 patients enrolled in the original RCT with 49 patients completing two-year RSA examinations.13 For the current study, 14 patients (15 hips) were available for clinical, radiological and RSA assessment at a minimum of ten years follow-up. Of the original 49 hips analyzed at two years, 23 patients (25 hips) had died due to reasons unrelated to surgery; three patients had severe dementia and were unable to communicate, which was discussed with their families and power of attorney and they declined further participation in the study. Five other patients declined further participation at ten-year follow-up namely because of their advanced age, multiple comorbidities, and difficulties for them to attend for clinical follow-up and RSA analysis. Lastly, in one hip, the tantalum beads had moved precluding further measurements. A summary of the hips available for analysis is found in Figure 1.
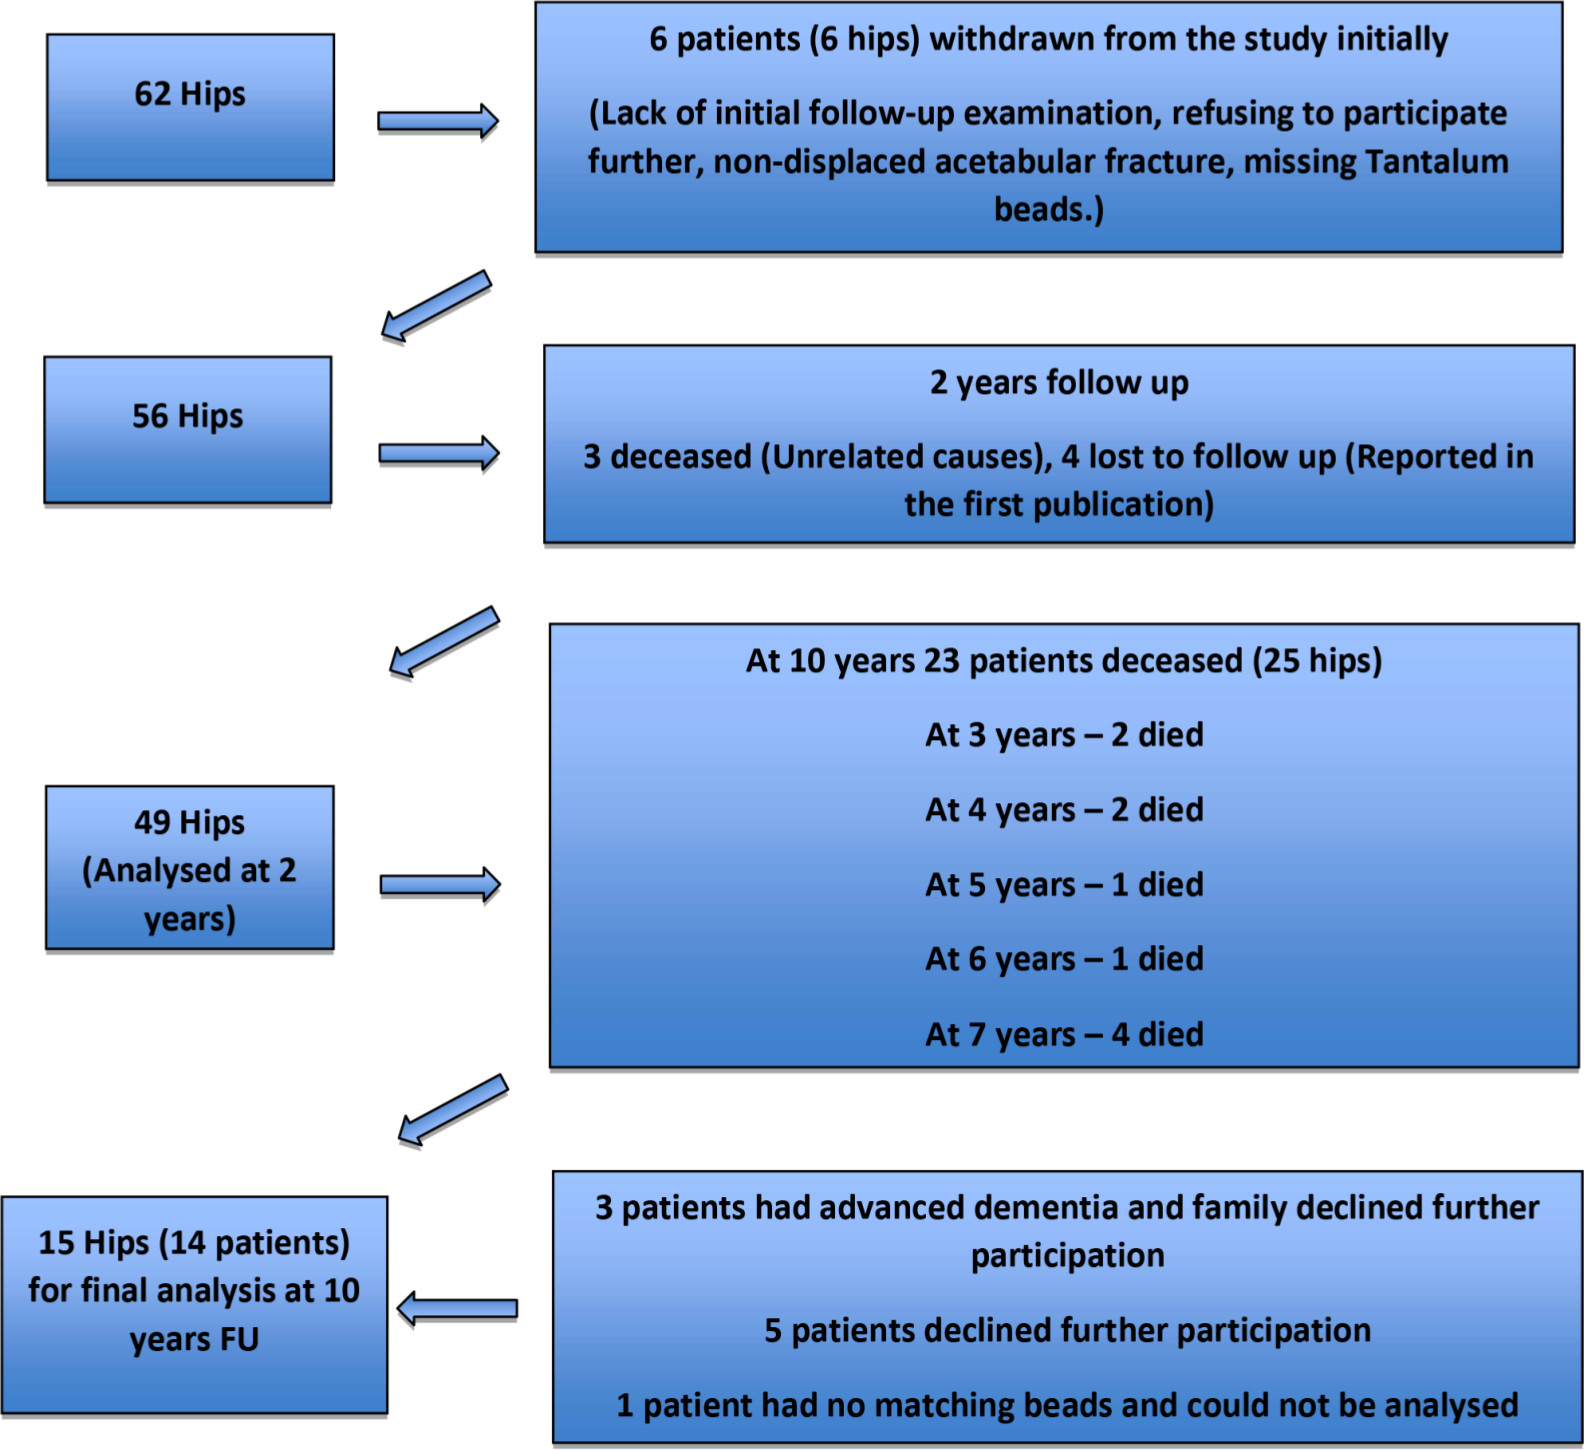
Fig. 1
Patient flowchart showing the loss to follow-up for the two groups (StikTite and Roughcoat) at ten years.
In total, there were eight hips in the StikTite group and seven in the Roughcoat group at a minimum ten-year follow-up. Patient basic demographics were similar in both groups (Table I). All components had supplemental screw fixation with the exception of three components in the StikTite group and one in the Roughcoat group. All components in both groups had a highly cross-linked polyethylene (XLPE) acetabular liner (Reflection) with an internal diameter of 32 mm. Three femoral heads in the StikTite group were Oxinium heads (Oxinium; Smith and Nephew) and the rest were Cobalt Chromium heads (CoCr; Smith and Nephew). In the Roughcoat group, only one Oxinium head was used and all other heads were CoCr. All femoral heads were 32 mm in diameter.
Table I.
Patient demographics and preoperative scores for the ten-year follow-up cohort.
| Variable | StikTite | RoughCoat | p-value |
|---|---|---|---|
| Sex, n | |||
| Female | 4 | 5 | |
| Male | 4 | 2 | |
| Age yrs, mean ± SD | 82.00 ± 5.42 | 80.00 ± 2.58 | 0.40† |
| BMI, mean ± SD | 28.58 ± 2.63 | 27.57 ± 1.82 | 0.42† |
| Weight kg, mean ± SD | 81.2 ± 14 | 74.8 ± 5 | 0.28† |
| Height cm, mean ± SD | 168 ± 10.8 | 164.9 ± 7.8 | 0.54† |
| Time from surgery yrs, median (IQR) | 12 (0.75) | 11 (1) | 0.14§ |
| Presence of acetabular screws, n | 5 | 6 | |
| Preoperative SF-12 mental scores, median (IQR) | 47.4 (18.43) | 61.7 (24.16) | 0.23§ |
| Preoprative SF-12 physical scores, median (IQR) | 27.4 (9.20) | 32 (3.71) | 0.23§ |
| Preoperative WOMAC pain scores, median (IQR) | 55 (25) | 80 (15) | 0.01§ |
| Preoperative WOMAC stiffness scores, median (IQR) | 50 (37.5) | 62.5 (12.5) | 0.23§ |
| Preoperative WOMAC function scores, median (IQR) | 42.6 (20.5) | 64.7 (19.1) | 0.15§ |
| Preoperative WOMAC total scores, median (IQR) | 49.4 (23.9) | 69 (9.7) | 0.07§ |
| Preoperative HHS pain scores, median (IQR) | 20 (0) | 30 (10) | 0.12§ |
| Preoperative HHS function scores, median (IQR) | 20 (0) | 28(11) | 0.87§ |
| Preoperative HHS total scores, median (IQR) | 45 (3) | 56 (14) | 0.34§ |
-
*
Student t-test.
-
†
Mann-Whitney U Test.
-
BMI, body mass index; HHS, Harris Hip Score; IQR, interquartile range; SF-12, 12-Item Short Form Survey; SD, standard deviation; WOMAC, Western Ontario and McMaster Universities Arthritis Index.
RSA analysis showed minimal movements of both components at ten-year follow-up, in both rotation and translation (Tables II and III, Figures 2 and 3).
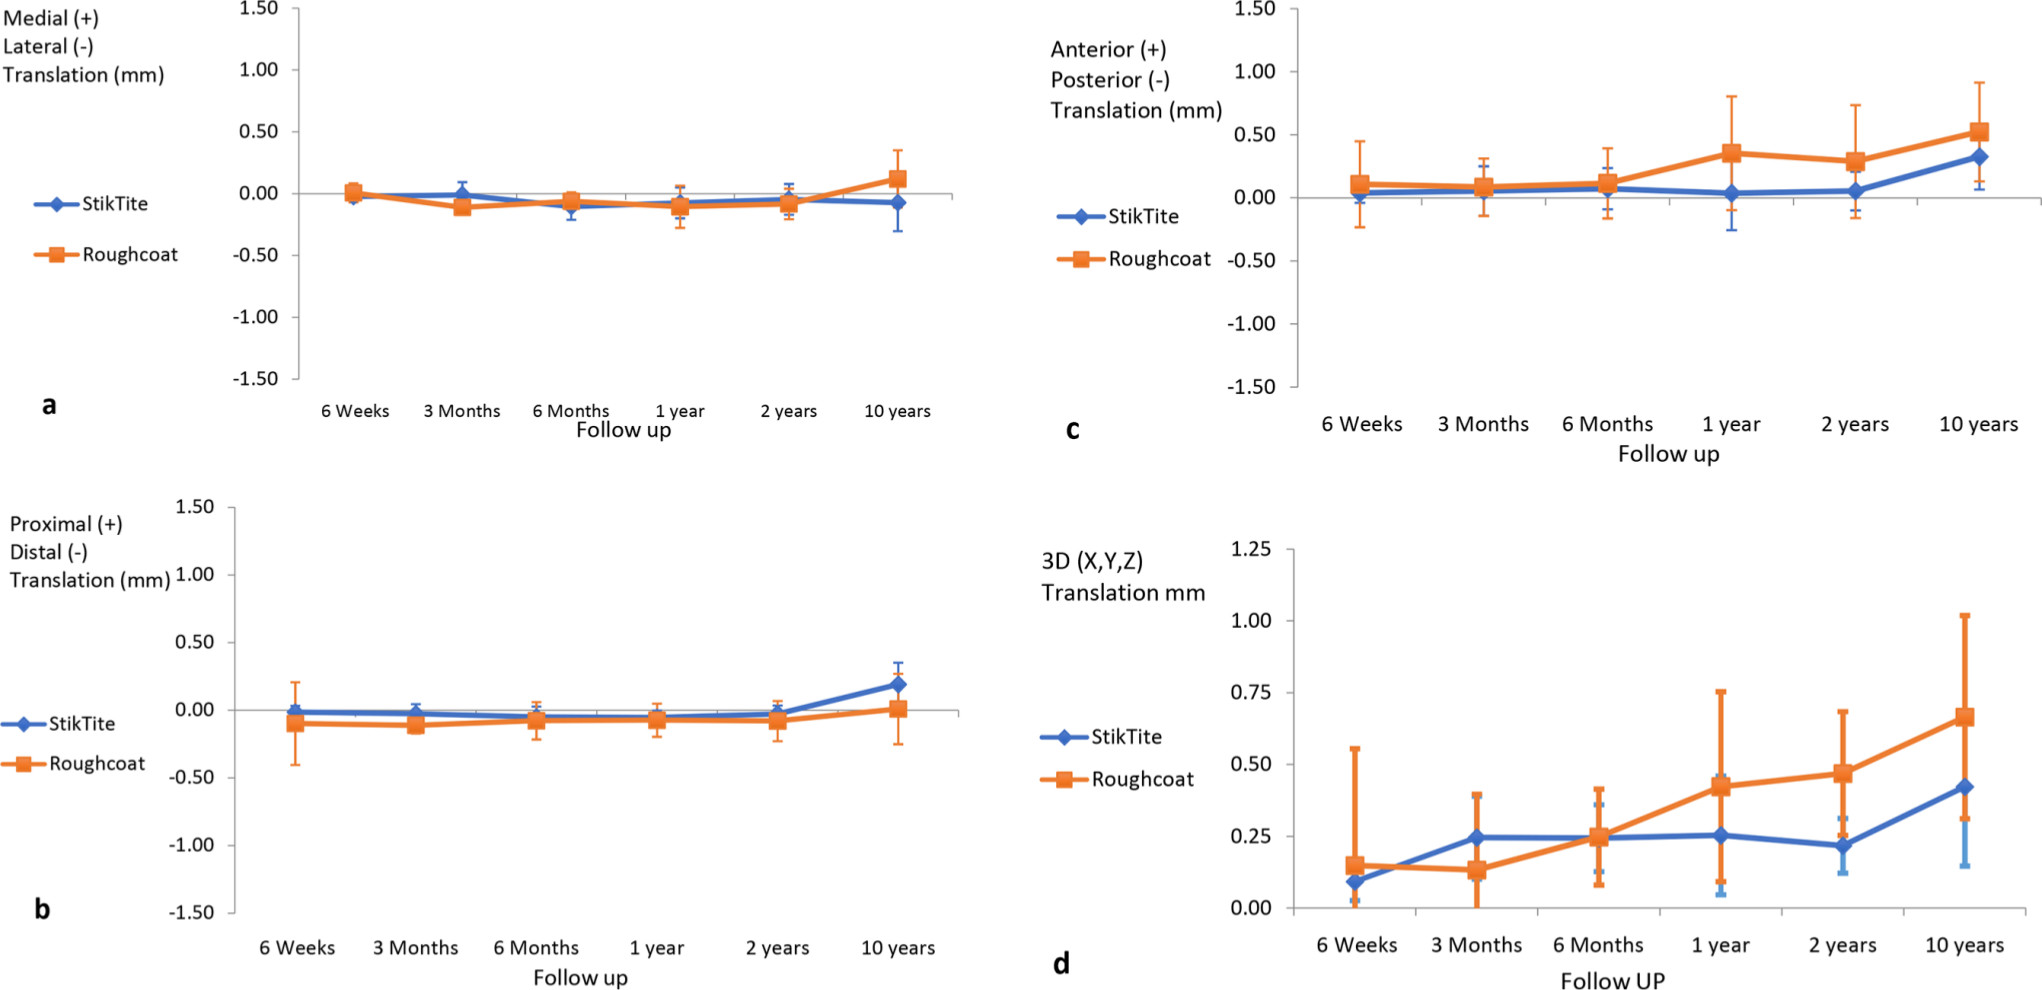
Fig. 2
(a) medial-lateral, (b) proximal-distal, (c) anterior-posterior, and (d) 3D translation in mm for the two porous in-growth surfaces.
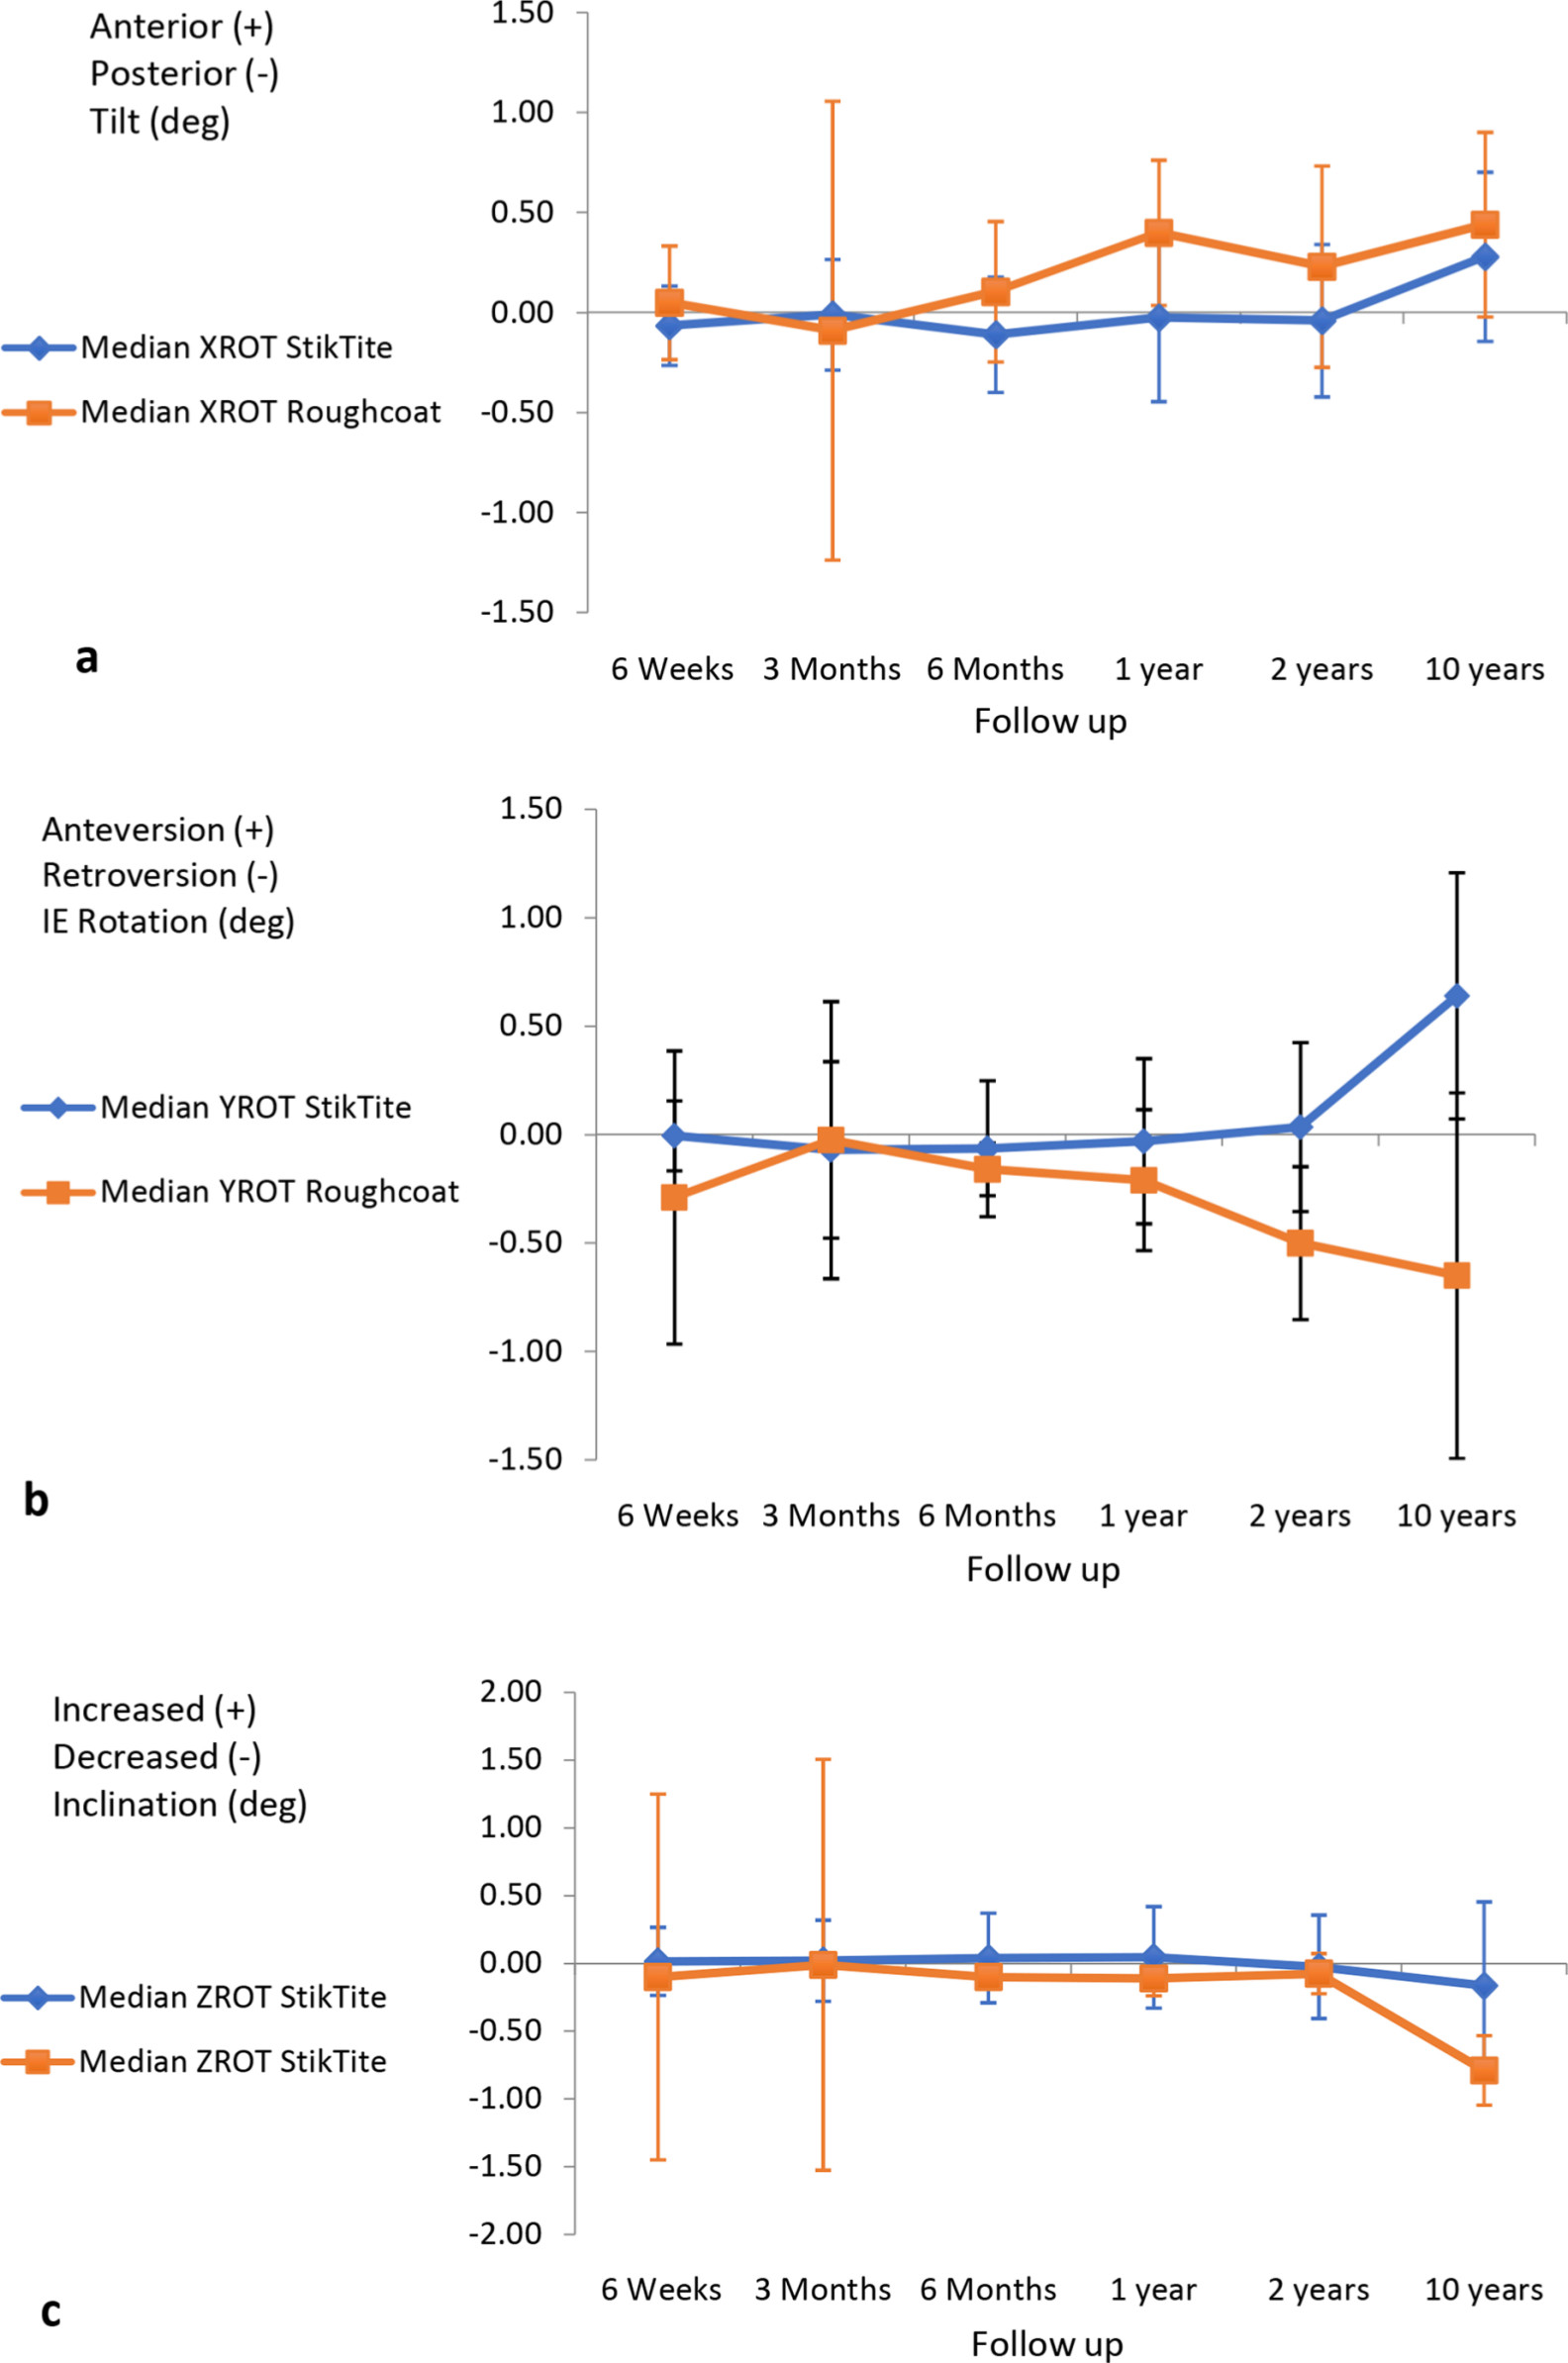
Fig. 3
(a) anterior-posterior tilt, (b) anteversion-retroversion, and (c) increased-decreased inclination for the two porous in-growth surfaces.
Table II.
StikTite and Roughcoat median implant-bone translations (mm) including p-values for differences between the groups at each time point.
| Follow-up | X translation | Y translation | Z translation | 3D translation | ||||||||
|---|---|---|---|---|---|---|---|---|---|---|---|---|
| Median | IQR | p-value | Median | IQR | p-value | Median | IQR | p-value | Median | IQR | p-value | |
| Six weeks vs postoperative | ||||||||||||
| StikTite‡ | -0.02 | 0.09 | 0.917* | -0.02 | 0.09 | 0.393* | 0.03 | 0.16 | 0.468* | 0.09 | 0.14 | 0.266* |
| Roughcoat‡ | 0.006 | 0.15 | 0.006 | 0.15 | 0.1 | 0.68 | 0.15 | 0.76 | ||||
| Three months vs postoperative | ||||||||||||
| StikTite | -0.009 | 0.1 | 0.101* | -0.03 | 0.14 | 0.634* | 0.07 | 0.24 | 0.430* | 0.25 | 0.2 | 0.974*** |
| Roughcoat | -0.11 | 0.09 | -0.02 | 0.33 | 0.09 | 0.44 | 0.14 | 0.51 | ||||
| Six months vs postoperative | ||||||||||||
| StikTite | -0.1 | 0.17 | 0.551* | -0.05 | 0.14 | 0.923* | 0.04 | 0.43 | 0.800* | 0.25 | 0.22 | 0.551* |
| Roughcoat | -0.06 | 0.11 | -0.08 | 0.18 | 0.11 | 0.57 | 0.25 | 0.29 | ||||
| One year vs postoperative | ||||||||||||
| StikTite | -0.07 | 0.24 | 1.000* | -0.05 | 0.09 | 0.821* | 0.04 | 0.29 | 0.135* | 0.26 | 0.18 | 0.057* |
| Roughcoat | -0.1 | 0.21 | -0.07 | 0.15 | 0.36 | 0.81 | 0.43 | 0.66 | ||||
| Two years vs postoperative | ||||||||||||
| StikTite | -0.05 | 0.28 | 0.930* | -0.03 | 0.1 | 0.842* | 0.13 | 0.25 | 0.634* | 0.22 | 0.15 | 0.032* |
| Roughcoat | -0.08 | 0.19 | -0.08 | 0.25 | 0.29 | 0.83 | 0.47 | 0.38 | ||||
|
Ten years vs
postoperative |
||||||||||||
| StikTite | -0.07 | 0.31 | 0.608† | 0.19 | 0.4 | 0.672* | 0.33 | 0.75 | 0.430† | 0.42 | 0.44 | 0.460* |
| Roughcoat | 0.11 | 0.24 | 0.009 | 0.24 | 0.63 | 0.9 | 0.67 | 0.82 | ||||
| Ten years vs two years | ||||||||||||
| StikTite | 0.03 | 1.08 | 0.541† | 0.12 | 0.7 | 0.462† | 0.003 | 2.3 | 0.869† | 0.37 | 0.3 | 0.550* |
| Roughcoat | -0.6 | 0.59 | -0.1 | 0.49 | 0.1 | 1.12 | 0.48 | 0.38 | ||||
-
*
Mann-Whitney U test.
-
†
Student t-test.
-
‡
Smith and Nephew, Memphis, Tennessee, USA.
-
IQR, interquartile range.
Table III.
StikTite and Roughcoat median implant-bone rotations (degrees) including p-values for differences between the groups at each time point.
| Follow-up | X rotation, ° | Y rotation, ° | Z rotation, ° | ||||||
|---|---|---|---|---|---|---|---|---|---|
| Median | IQR | p-value | Median | IQR | p-value | Median | IQR | p-value | |
| Six weeks vs postoperative | |||||||||
| StikTite‡ | -0.07 | 0.34 | 0.920* | -0.005 | 0.27 | 0.391* | 0.02 | 0.13 | 0.470* |
| Roughcoat‡ | 0.05 | 0.33 | -0.29 | 1.14 | -0.1 | 3.06 | |||
| Three months vs postoperative | |||||||||
| StikTite | -0.01 | 0.59 | 0.100* | -0.07 | 0.66 | 0.632* | 0.02 | 0.37 | 0.431* |
| Roughcoat | -0.09 | 2.18 | -0.03 | 1.2 | -0.01 | 2.81 | |||
| Six months vs postoperative | |||||||||
| StikTite | -0.11 | 0.51 | 0.554* | -0.06 | 0.35 | 0.922* | 0.04 | 0.32 | 0.800* |
| Roughcoat | 0.1 | 0.62 | -0.16 | 0.21 | -0.1 | 0.08 | |||
| One year vs postoperative | |||||||||
| StikTite | -0.03 | 0.59 | 1.000* | -0.03 | 0.55 | 0.821* | 0.05 | 0.36 | 0.142* |
| Roughcoat | 0.4 | 0.57 | -0.21 | 0.63 | -0.11 | 0.24 | |||
| Two years vs postoperative | |||||||||
| StikTite | -0.04 | 0.73 | 0.931* | 0.04 | 0.65 | 0.844* | -0.03 | 0.69 | 0.633* |
| Roughcoat | 0.23 | 0.94 | -0.5 | 0.56 | -0.08 | 0.25 | |||
| Ten years vs postoperative | |||||||||
| StikTite | 0.28 | 0.76 | 0.610† | 0.64 | 0.75 | 0.672* | -0.17 | 0.66 | 0.430† |
| Roughcoat | 0.5 | 0.57 | -0.73 | 0.92 | -0.63 | 0.55 | |||
| Ten years vs two years | |||||||||
| StikTite | -0.4 | 3 | 0.410† | 0.28 | 2 | 0.230† | -0.2 | 1 | 0.230*† |
| Roughcoat | -0.4 | 1 | -0.1 | 1 | 0.2 | 2 | |||
-
*
Mann-Whitney U test.
-
†
Student t-test.
-
‡
Smith and Nephew, Memphis, Tennessee, USA.
The X, Y, Z, and 3D translations for StikTite at ten years compared to the two-year data were median 0.03 mm (IQR 1.08), median 0.12 mm (IQR 0.7), median 0.003 mm (IQR 2.3), median 0.37 mm (IQR 0.30), respectively, and for Roughcoat median -0.6 mm (IQR 0.59), median -0.1 mm (IQR 0.49), median 0.1 mm (IQR 1.12), and 0.48 mm (0.38), respectively.
The X, Y, and Z axis rotations for StikTite were median -0.4° (IQR 3), median 0.28° (IQR 2), median -0.2° (IQR 1) respectively, and for Roughcoat were median -0.4° (IQR 1), median -0.1° (IQR 1), and median 0.2° (IQR 2), respectively. There were no statistically significant differences between groups (Tables II and III). The ten-year RSA 3D translation data (compared to the two years data) was not statistically different between the two groups. The two-year RSA 3D translation for all components was significantly correlated to the long-term results at ten-year follow-up (Figure 4). Comparing the ten years data with reference to the two years data using the Wilcoxon signed ranks test showed no statistically significant difference in migration apart from 3D translation of the StikTite component (p = 0.016) and Y rotation for the Roughcoat component (p = 0.031) (Table IV).
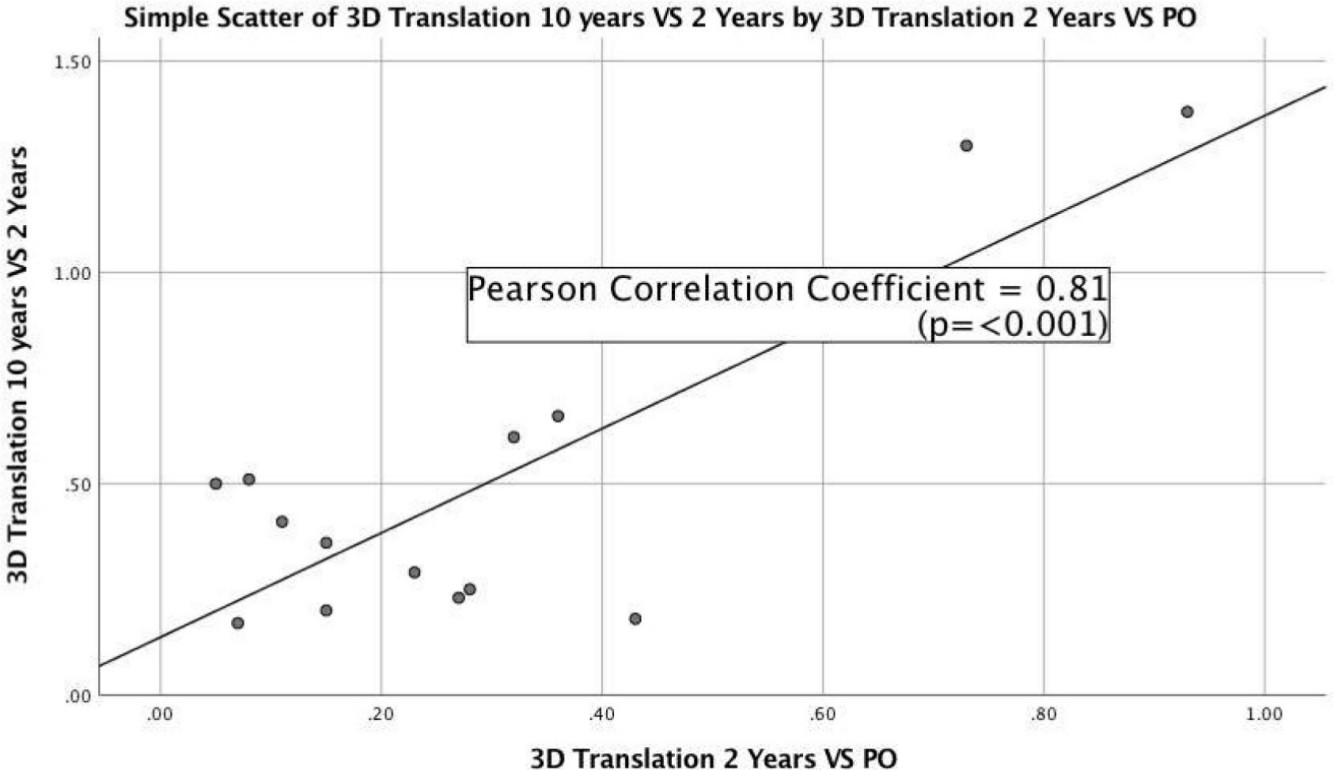
Fig. 4
Two-year versus long-term migration. Pearson r: rho = 0.81 (p < 0.001).
Table IV.
Ten-year versus two-year radiostereometric analysis (RSA) data.
| Variable | Ten years RSA vs two years | Two years vs postoperative | p-value† |
|---|---|---|---|
| Translation, median (IQR) | |||
| X translation | |||
| StikTite‡ | 0.03 (1.08) | -0.05 (0.28) | 0.547 |
| Roughcoat‡ | -0.6 (0.59) | -0.08 (0.19) | 0.094 |
| Y translation | |||
| StikTite | 0.12 (0.70) | -0.03 (0.1) | 0.092 |
| Roughcoat | -0.1 (0.49) | -0.08 (0.25) | 0.406 |
| Z translation | |||
| StikTite | 0.003 (2.3) | 0.13 (0.25) | 0.078 |
| Roughcoat | 0.1 (1.12) | 0.29 (0.83) | 0.938 |
| 3D translation | |||
| Stiktite | 0.37 (0.30) | 0.22 (0.15) | 0.016 |
| Roughcoat | 0.48 (0.38) | 0.47 (0.38) | 0.841 |
| Rotation, median (IQR) | |||
| X rotation | |||
| StikTite | -0.4 (3) | -0.04 (0.73) | 0.641 |
| Roughcoat | -0.4 () | 0.23 (0.94) | 0.813 |
| Y rotation | |||
| StikTite | 0.28 (2) | 0.04 (0.65) | 0.641 |
| Roughcoat | -0.1 (1) | -0.50 (0.56) | 0.030 |
| Z rotation | |||
| StikTite | -0.2 (1) | -0.03 (0.69) | 0.438 |
| Roughcoat | 0.2 (2) | -0.08 (0.25) | 0.219 |
-
*
Wilcoxon signed ranks test.
-
†
Smith and Nephew, Memphis, Tennessee, USA.
-
IQR, interquartile range.
Review of plain radiographs did not show any evidence of loosening of the acetabular components in both StikTite and Roughcoat groups and they fulfilled the criteria for osseointegration, according to Moore et al.16 This included the whole original cohort including the deceased patients at their last follow-up radiograph.
With regards to patient reported outcome measures, there were no statistically significant differences between the two groups in relation to SF-12, WOMAC, and HHS at ten years follow-up as demonstrated in Table V. The HHS and WOMAC scores for both groups were improved significantly at ten years follow-up compared to preoperatively (Table VI).
Table V.
PROMs at ten-year follow-up comparing the StikTite to Roughcoat groups.
| Variable | Group | p-value | |
|---|---|---|---|
| Postoperative SF-12 MCS (IQR) | StikTite‡ | 58.6 (18.82) | 0.46* |
| Median (IQR) | Roughcoat‡ | 57.8 (8.1) | |
| Postoperative SF-12 PCS | StikTite | 32.5 (16.28) | 0.19* |
| Median (IQR) | Roughcoat | 40.6 (20.5) | |
| Postoperative WOMAC pain | StikTite | 92.5 (27.50) | 0.23* |
| Median (IQR) | Roughcoat | 100 (0) | |
| Postoperative WOMAC stiffness | StikTite | 81 (43.75) | 0.19* |
| Median (IQR) | Roughcoat | 100 (12.5) | |
| Postoperative WOMAC function | StikTite | 83 (37.86) | 0.09* |
| Median (IQR) | Roughcoat | 98.5 (10.29) | |
| Postoperative WOMAC total | StikTite | 83 (37.86) | 0.12* |
| Median (IQR) | Roughcoat | 98.5 (10.29) | |
| Postoperative HHS pain | StikTite | 44 (3) | 0.25† |
| Median (IQR) | Roughcoat | 44 (0) | |
| Postoperative HHS function | StikTite | 40.5 (12.25) | 0.15* |
| Median (IQR) | Roughcoat | 47 (6) | |
| Postoperative HHS total | StikTite | 93.5 (72 to 100) | 0.15* |
| Median (IQR) | Roughcoat | 100 (92 to 100) | |
-
*
Mann Whitney U Test.
-
†
Student t-test.
-
‡
Smith and Nephew, Memphis, Tennessee, USA.
-
HHS, Harris Hip Score; IQR, interquartile range; MCS, Mental Component Score; PCS, Physical Component Score.; PROMs, patient-reported outcome measures; PROMs, patient-reported outcome measures; SF-12, 12-Item Short Form Survey; WOMAC, Western Ontario and McMaster Universities Arthritis Index.
Table VI.
Comparison of preoperative to postoperative PROMs for both groups.
| Variable | Preoperative score (IQR) |
Postoperative score (IQR) | p-value* |
|---|---|---|---|
| MCS SF-12 StikTite | 47.4 (18.43) | 58.6 (18.82) | 0.100 |
| MCS SF-12 Roughcoat | 61.7 (24.16) | 57.8 (8.1) | 0.700 |
| PCS SF-12 StikTite | 27.4 (9.20) | 32.5 (16.28) | 0.250 |
| PCS SF-12 Roughcoat | 32.5 (3.71) | 40.6 (20.5) | 0.020 |
| WOMAC pain StikTite | 55 (25) | 92.5 (27.50) | 0.008 |
| WOMAC pain Roughcoat | 80 (15) | 100 (0) | 0.030 |
| WOMAC stiffness StikTite | 50 (37.5) | 81 (43.75) | 0.030 |
| WOMAC stiffness Roughcoat | 62 (12.5) | 100 (12.5) | 0.020 |
| WOMAC function StikTite | 42.6 (20.5) | 83 (37.86) | 0.008 |
| WOMAC function Roughcoat | 64.7 (19.1) | 98.5 (10.29) | 0.020 |
| WOMAC total StikTite | 49.4 (23.9) | 83 (37.86) | 0.008 |
| WOMAC total Roughcoat | 69 (9.7) | 98.5 (10.29) | 0.020 |
| HHS pain StikTite | 20 (0) | 44 (3) | 0.008 |
| HHS pain Roughcoat | 30 (10) | 44 (0) | 0.020 |
| HHS function StikTite | 20 (0) | 40.5 (12.25) | 0.008 |
| HHS function Roughcoat | 28 (11) | 47 (6) | 0.020 |
| HHS total StikTite | 45 (3) | 93.5 (20) | 0.008 |
| HHS total Roughcoat | 56 (14) | 100 (6) | 0.020 |
-
*
Wilcoxon signed ranks test.
-
†
Smith and Nephew, Memphis, Tennessee, USA.
-
HHS, Harris Hip Score; MCS, Mental Component Score; PCS, Physical Component Score; PROMs, patient-reported outcome measures; SF-12, 12-Item Short Form Survey; WOMAC, Western Ontario and McMaster Universities Arthritis Index.
There were no component revisions for the entire cohort from the original study, including the patients who died at their last follow-up. There was only one case with femoral stem subsidence, which was revised after two years without acetabular component revision. This patient was part of the final cohort analyzed at ten years.
Discussion
While there are many options for acetabular component coatings, there has been a trend towards greater porosity of the coating on acetabular components in order to provide better primary stability through a greater coefficient of friction and the potential for increased bony ingrowth.11 In addition to the differing porosities, these new surfaces provide different pore sizes and surface areas which may also have an impact on primary stability and osseointegration. Therefore, it is important to evaluate the long-term outcomes of these newer coatings while reporting on the long-term surveillance of these new implants.21
In a recent systematic review of highly porous acetabular components in primary and revision arthroplasty, Malahias et al22 demonstrated satisfactory clinical, radiological and RSA outcome data. However, long-term RSA data was lacking and the authors concluded that further study was required. Pijls et al23 demonstrated a clinically relevant association between early migration of acetabular components and late revision in a meta-analysis of RSA studies. Nevertheless, there is a paucity of long-term RSA data24-29 validating the ability of early RSA migration data to predict long-term clinical success. Our study is one of very few studies which have reported long-term RSA migration data of cementless acetabular components beyond ten years.
This study has shown that there was no statistically significant difference in migration of these two different components at two years and ten years, and that there was significant correlation between the two years data and the ten years data regarding the 3D translation. PROMs were improved significantly at ten years compared to the preoperative data and there was no difference in these PROMs between the two groups. The radiological analysis revealed no lucencies or migration at ten years for both components.
RSA and plain radiological analysis at a minimum of ten years showed excellent fixation of both StikTite and Roughcoat acetabular components with minimal migration on RSA analysis. In contrast, some work examining porous titanium coated shells have shown a relatively high incidence of radiolucencies and reduced implant-bone contact at mid-term follow-up.29,30 However, in our series, these radiological changes were not observed in either the Roughcoat surface, which is a titanium bead coating, or the StikTite surface, which has an asymmetric titanium particle higher porosity coating. Our findings are reassuring for the continued use of this newer StikTite coating, which appears to be an excellent porous coating for use on orthopaedic implants.
The two-year RSA data correlated strongly with the ten-year data reported here, reinforcing the predictive value of early RSA migration data (Table IV).31 This strongly suggests that osseointegration of the acetabular components at two years (indicated by low component migration at two years) is a good indicator for stable long-term fixation and therefore has enormous value as a screening tool for the introduction of new implants and surface coatings. In similar work to ours, Nilsson et al27 demonstrated using RSA that there was no difference between the six-months to five-years migration data with cementless components.27
In addition, Laende et al31 in a study looking at total knee arthroplasty demonstrated the utility of short-term migration using RSA in predicting long-term stable fixation.
The limitation of this study is related to the small sample size at ten-year follow-up compared to the original cohort, owing to a large number of patients passing away due to unrelated causes. This is not surprising at ten years follow-up, as the average age of the study patients at index surgery was approximately 75 years of age. Fortunately, as RSA is such a precise and accurate tool, smaller cohort numbers still provide a meaningful examination of these two cohorts. In addition, as per the original study, the use of supplemental screw fixation may have had a confounding effect on the migration results although work by Rohr et al32 reported that the use of screw fixation was not an important factor. Lastly, the results of this study may be only applicable to this particular design and porous coating surface.
The strength of this study is that it provides useful long-term RSA data of a randomized control trial, which is relatively infrequent in the current published literature. It demonstrates the reliability of short term RSA data in predicting long-term RSA results while providing further evidence for the clinical effectiveness of both a highly porous acetabular component (StikTite) and a lower porosity component (Roughcoat) in providing long-term biological fixation. We believe that further follow-up for this cohort will be difficult but unnecessary as this study provides good evidence for the long-term survival of these acetabular components.
References
1. Australian Orthopaedic Association . National joint replacement registry annual report . 2018 . https://aoanjrr.sahmri.com/documents/10180/576950/Hip%2C Knee %26 Shoulder Arthroplasty (date last accessed 15 October 2020 ). Google Scholar
2. Swedish Hip Arthroplasty Register . Annual report . 2017 . https://registercentrum.blob.core.windows.net/shpr/r/Eng_Arsrapport_2017_Hoftprotes_final-Syx2fJPhMN.pdf (date last accessed 15 October 2020 ). Crossref PubMed Google Scholar
3. NJR . Welcome to the National joint registry . 2019 . https://reports.njrcentre.org.uk/Portals/0/PDFdownloads/NJR 16th Annual Report 2019.pdf (date last accessed 15 October 2020 ). Google Scholar
4. Malchau H , Graves SE , Porter M , Harris WH , Troelsen A . The next critical role of orthopedic registries . Acta Orthop . 2015 ; 86 ( 1 ): 3 – 4 . Crossref PubMed Google Scholar
5. Søballe K , Hansen ES , B-Rasmussen H , Jørgensen PH , Bünger C . Tissue ingrowth into titanium and hydroxyapatite-coated implants during stable and unstable mechanical conditions . J Orthop Res . 1992 ; 10 ( 2 ): 285 – 299 . Crossref PubMed Google Scholar
6. Teo YS , Corten K , McCalden RW , Macdonald SJ , Bourne RB . The minimum 10-year results of a second-generation cementless acetabular shell with a polished inner surface . J Arthroplasty . 2012 ; 27 ( 7 ): 1370 – 1375 . Crossref PubMed Google Scholar
7. Corten K , McCalden RW , Teo Y , Charron KD , MacDonald SJ , Bourne RB . Midterm results of 506 solid trispiked reflection cementless acetabular components for primary total hip arthroplasty . J Arthroplasty . 2011 ; 26 ( 8 ): 1350 – 1356 . Crossref PubMed Google Scholar
8. Engh CA , Hopper RH , Engh CA . Long-Term porous-coated cup survivorship using spikes, screws, and press-fitting for initial fixation . J Arthroplasty . 2004 ; 19 ( 7 Suppl 2 ): 54 – 60 . Crossref PubMed Google Scholar
9. Bobyn JD , Stackpool GJ , Hacking SA , Tanzer M , Krygier JJ . Characteristics of bone ingrowth and interface mechanics of a new porous tantalum biomaterial . J Bone Joint Surg Br . 1999 ; 81 ( 5 ): 907 – 914 . Crossref PubMed Google Scholar
10. Cohen R . A porous tantalum trabecular metal: basic science . Am J Orthop . 2002 ; 31 ( 4 ): 216 – 217 . PubMed Google Scholar
11. Bourne RB , McCalden RW , Naudie D , Charron KDJ , Yuan X , Holdsworth DW . The next generation of acetabular shell design and bearing surfaces . Orthopedics . 2008 ; 31 ( 12 Suppl 2 ). PubMed Google Scholar
12. Baad-Hansen T , Kold S , Nielsen PT , Laursen MB , Christensen PH , Soballe K . Comparison of trabecular metal cups and titanium fiber-mesh cups in primary hip arthroplasty: a randomized RSA and bone mineral densitometry study of 50 hips . Acta Orthop . 2011 ; 82 ( 2 ): 155 – 160 . Crossref PubMed Google Scholar
13. Naudie DDR , Somerville L , Korczak A , et al. A randomized trial comparing acetabular component fixation of two porous ingrowth surfaces using RSA . J Arthroplasty . 2013 ; 28 ( 8 Suppl ): 48 – 52 . Crossref PubMed Google Scholar
14. Selvik G . Roentgen Stereophotogrammetric analysis . Acta radiol . 1990 ; 31 ( 2 ): 113 – 126 . Crossref PubMed Google Scholar
15. Kärrholm J , stereophotogrammetry R . Review of orthopedic applications . Acta Orthop Scand . 1989 ; 60 ( 4 ): 491 – 503 . Google Scholar
16. Moore MS , McAuley JP , Young AM , Engh CA . Radiographic signs of osseointegration in porous-coated acetabular components . Clin Orthop Relat Res . 2006 ; 444 : 176 – 183 . Crossref PubMed Google Scholar
17. DeLee JG , Charnley J . Radiological demarcation of cemented sockets in total hip replacement . Clin Orthop Relat Res ; 121 : 20 – 32 . PubMed Google Scholar
18. Harris WH . Traumatic arthritis of the hip after dislocation and acetabular fractures: treatment by mold arthroplasty. An end-result study using a new method of result evaluation . J Bone Joint Surg Am . 1969 ; 51 ( 4 ): 737 – 755 . PubMed Google Scholar
19. Bellamy N , Buchanan WW , Goldsmith CH , Campbell J , Stitt LW . Validation study of WOMAC: a health status instrument for measuring clinically important patient relevant outcomes to antirheumatic drug therapy in patients with osteoarthritis of the hip or knee . J Rheumatol [Internet] . 1988 ; 15 ( 12 ): 1833 – 1840 . Google Scholar
20. Ware J , Kosinski M , Keller SD . A 12-Item short-form health survey: construction of scales and preliminary tests of reliability and validity . Med Care . 1996 ; 34 ( 3 ): 220 – 233 . Crossref PubMed Google Scholar
21. Malchau H . On the importance of stepwise introduction of new hip implant technology . Dep Orthop . 1995 : 1 – 506 . Google Scholar
22. Malahias M-A , Kostretzis L , Greenberg A , Nikolaou VS , Atrey A , Sculco PK . Highly porous titanium acetabular components in primary and revision total hip arthroplasty: a systematic review . J Arthroplasty . 2020 . Crossref PubMed Google Scholar
23. Pijls BG , Nieuwenhuijse MJ , Fiocco M , et al. Early proximal migration of CUPS is associated with late revision in THA: a systematic review and meta-analysis of 26 RSA studies and 49 survivalstudies . Acta Orthop . 2012 ; 83 ( 6 ): 583 – 591 . Crossref PubMed Google Scholar
24. Jacobsen A , Seehaus F , Hong Y , et al. Model-based roentgen stereophotogrammetric analysis using elementary geometrical shape models: 10 years results of an uncemented acetabular cup component . BMC Musculoskelet Disord . 2018 ; 19 ( 1 ): 335 . Google Scholar
25. Flivik G , Kristiansson I , Ryd L . Positive effect of removal of subchondral bone plate for cemented acetabular component fixation in total hip arthroplasty: a randomised RSA study with ten-year follow-up . Bone Joint J . 2015 ; 97-B ( 1 ): 35 – 44 . Crossref PubMed Google Scholar
26. Mohaddes M , Herberts P , Malchau H , Johanson P-E , Kärrholm J . High proximal migration in cemented acetabular revisions operated with bone impaction grafting; 47 revision CUPS followed with RSA for 17 years . Hip Int . 2017 ; 27 ( 3 ): 251 – 258 . Crossref PubMed Google Scholar
27. Nilsson KG , Theodoulou A , Mercer G , Quinn SJ , Krishnan J . Mid-term migration of a cementless, porous acetabular cup: A 5 year Radiostereometric analysis . J Orthop . 2017 ; 14 ( 4 ): 454 – 460 . Google Scholar
28. Röhrl SM , Nivbrant B , Snorrason F , Kärrholm J , Nilsson KG . Porous-coated CUPS fixed with screws: a 12-year clinical and radiostereometric follow-up study of 50 hips . Acta Orthop . 2006 ; 77 ( 3 ): 393 – 401 . Crossref PubMed Google Scholar
29. Galea VP , Rojanasopondist P , Laursen M , Muratoglu OK , Malchau H , Bragdon C . Evaluation of vitamin E-diffused highly crosslinked polyethylene wear and porous titanium-coated shell stability: a seven-year randomized control trial using radiostereometric analysis . Bone Joint J . 2019 ; 101-B ( 7 ): 760 – 767 . Crossref PubMed Google Scholar
30. Lindgren V , Galea VP , Nebergall A , et al. Radiographic and clinical outcomes of porous titanium-coated and Plasma-Sprayed acetabular shells: a five-year prospective multicenter study . J Bone Joint Surg Am . 2018 ; 100 ( 19 ): 1673 – 1681 . Crossref PubMed Google Scholar
31. Laende EK , Richardson CG , Dunbar MJ . Predictive value of short-term migration in determining long-term stable fixation in cemented and cementless total knee arthroplasties . Bone Joint J . 2019 ; 101-B ( 7_Supple_C ): 55 – 60 . Crossref PubMed Google Scholar
32. Röhrl SM , Nivbrant B , Ström H , Nilsson KG . Effect of augmented cup fixation on stability, wear, and osteolysis: a 5-year follow-up of total hip arthroplasty with RSA . J Arthroplasty . 2004 ; 19 ( 8 ): 962 – 971 . Crossref PubMed Google Scholar
Author contributions
L. Rahman: Obtained the initial ethical approval, collected data and wrote the manuscript
M. S. Ibrahim:Collected data, analysed data and wrote the manuscript
L. Somerville: Data analysis
M. Teeter: Advised on the RSA measurements and edited the manuscript
D. D. Naudie: Wrote and edited the manuscript
R. McCalden: Wrote and edited the manuscript
Funding statement
Although none of the authors has received or will receive benefits for personal or professional use from a commercial party related directly or indirectly to the subject of this article, benefits have been or will be received but will be directed solely to a research fund, foundation, educational institution, or other non- profit organization with which one or more of the authors are associated.
© 2020 Author(s) et al. This is an open-access article distributed under the terms of the Creative Commons Attributions licence (CC-BY-NC-ND), which permits unrestricted use, distribution, and reproduction in any medium, but not for commercial gain, provided the original author and source are credited. See https://creativecommons.org/licenses/by-nc-nd/4.0/.
