


Abstract
Aims
Kashin-Beck disease (KBD) is a kind of chronic osteochondropathy, thought to be caused by environmental risk factors such as T-2 toxin. However, the exact aetiology of KBD remains unclear. In this study, we explored the functional relevance and biological mechanism of cartilage oligosaccharide matrix protein (COMP) in the articular cartilage damage of KBD.
Methods
The articular cartilage specimens were collected from five KBD patients and five control subjects for cell culture. The messenger RNA (mRNA) and protein expression levels were detected by quantitative reverse transcription PCR (qRT-PCR) and western blot. The survival rate of C28/I2 chondrocyte cell line was detected by MTT assay after T-2 toxin intervention. The cell viability and mRNA expression levels of apoptosis related genes between COMP-overexpression groups and control groups were examined after cell transfection.
Results
The mRNA and protein expression levels of COMP were significantly lower in KBD chondrocytes than control chondrocytes. After the T-2 toxin intervention, the COMP mRNA expression of C28/I2 chondrocyte reduced and the protein level of COMP in three intervention groups was significantly lower than in the control group. MTT assay showed that the survival rate of COMP overexpression KBD chondrocytes were notably higher than in the blank control group. The mRNA expression levels of Survivin, SOX9, Caspase-3, and type II collagen were also significantly different among COMP overexpression, negative control, and blank control groups.
Conclusion
Our study results confirmed the functional relevance of COMP with KBD. COMP may play an important role in the excessive chondrocytes apoptosis of KBD patients.
Cite this article: Bone Joint Res 2020;9(9):578–586.
Article focus
-
Exploring the difference of cartilage oligosaccharide matrix protein (COMP) mRNA and protein expression levels between Kashin-Beck disease (KBD) patients and control subjects.
-
Detecting the effect of T-2 toxin on C28/ I2 normal chondrocyte cell line.
-
Exploring the effect of COMP overexpression on the expression of apoptosis-related genes.
Key messages
-
Combined with the verification of this experiment, we confirmed that the COMP gene is a susceptibility gene for KBD.
Strengths and limitations
-
Our study confirmed the implication of COMP in KBD development and provided novel evidence for understanding the molecular mechanism of KBD cartilage damage.
-
T-2 toxin treatment experiment was only conducted on normal chondrocyte cell line, not on the KBD chondrocytes.
Introduction
Kashin-Beck disease (KBD) is an endemic and chronic osteochondropathy, which mainly occurs in across Northeast China and Southwest China, Siberia, and North Korea.1 Guo et al1 report that there are currently 640,000 KBD patients in China and 1.16 million people live in the endemic areas with the threat of this disease. Multiple environmental risk factors are thought to be the cause of KBD, T-2 toxin being the most fully explored among them. Primarily, KBD affects children or adolescents during the bone-joint development process. It mainly damages the chondrocytes of articular cartilage and growth plate cartilage, resulting in an impaired endochondral ossification.2 Typical symptoms of KBD include multiple enlarged and deformed joints, shortened fingers. long bones, joint pain, and limited joint motion. Some manifestations of secondary osteoarthritis will also appear with age.3 However, the pathogenesis of KBD remains unclear, and there is no effective cure.
There is increasing evidence to show that chondrocyte apoptosis plays an important role in cartilage development, ageing, and disease.4 For example, increased chondrocyte apoptosis was reported in the cartilages of children with KBD by Yang et al.5 Additionally, they also demonstrated that T-2 toxin and selenium deficiency could induce chondrocyte apoptosis in cartilage damage and progression of KBD in a rat model.5 Other than apoptosis, necroptosis has also been established as a cell death mechanism in the middle zone of cartilage from KBD children.6 The relationship between chondrocytes apoptosis and osteoarthritis (OA) has also been shown in other studies.7,8
Cartilage oligomeric matrix protein (COMP), also known as thrombospondin-5, is an extracellular matrix (ECM) protein primarily present in cartilage. It has been reported that extracellular matrix protein 1 (ECM1) and COMP can mediate endochondral bone formation together.9 An experimental study on mice suggested that COMP played an important role in intracellular function in assisting efficient secretion of collagens,10 which was a novel intracellular function required for fibrosis. In addition, Bai et al11 found that serum levels of type II collagen C-terminal peptide (CTX-II) and COMP were effective indicators for early OA diagnosis. The level of serum COMP has been considered to effectively predict OA progression.12 However, very few studies focus on the potential role of COMP in the pathogenesis of KBD.
Some substances can lead to chondrocyte damage.13,14 T-2 toxin, believed to be one of the major risk factors for KBD, can induce articular cartilage degradation by inhibiting aggrecan synthesis, promoting aggrecanases, and pro-inflammatory cytokine production.15 Recent studies found that T-2 toxin is capable of inducing chondrocyte and cartilage damage through apoptosis.5,16 Furthermore, Liu et al17 demonstrated that the effect of T-2 toxin on human chondrocyte apoptosis may be mediated by a mitochondrial pathway. However, the molecular mechanism of T-2 toxin involved in the development of KBD is largely unknown.
Based on the previous study results about KBD and COMP, we hypothesize that T-2 toxin reduces the expression of COMP on chondrocytes and this reduction induces the susceptibility to degenerative cartilage change. This molecule mechanism may be involved in the development of KBD. To prove this hypothesis, the COMP expression levels between KBD and control articular cartilage were compared, and then the effects of T-2 toxin on C28/I2 chondrocyte line were explored. Finally, by making a COMP overexpression cell model on KBD chondrocytes, the effects of COMP overexpression on the cell survival rate and apoptosis-related gene expression were investigated. This study aims to explore the role of COMP in KBD development and provide novel evidence for understanding the molecular mechanism of KBD cartilage damage.
Methods
Study samples
This study was approved by the Human Ethics Committee of Xi’an Jiaotong University. All subjects signed written consent prior to the study. Hip articular cartilage specimens were collected from five KBD subjects (two males and three females) and five subjects with femoral neck fracture (FNF) (two males and three females), who were all part of the Han Chinese population. The mean age of the KBD group was 67.2 years (SD 7.22), and the mean age of the control group was 61 years (SD 19.68). KBD patients were diagnosed strictly based on their clinical manifestations, radiological signs of the hands, hip, and knees, as well as the inhabitation history in KBD-endemic areas according to the KBD diagnostic criteria of China (No. WS/T207-2010).18 KBD is classified into three grades based on its severity (Grade I, II, and III, Grade III being the most severe). Dwarfism (male height < 1.4 m, female height < 1.3 m) is the disease marker of Grade III KBD with a sensitivity of 0.951 and a specificity of 0.992.19 All patients used in this study have Grade III KBD and come from the same KBD-endemic area of Yongshou, Linyou, and Bin counties in Shaanxi Province, China. They underwent the joint arthroplasty surgery because of severe joint pain and movement disorder. The symptoms on their hip radiograph images include joint space narrowing, short femoral necks, and flattening of the femoral head. Chondrocytes were harvested from the removed femoral head cartilage tissue in hip arthroplasty surgery within 12 hours. Subjects with primary OA, rheumatic arthritis, and hereditary bone disorder were excluded. In addition, the protein of chondrocytes was only extracted from four of the five groups because of the limited amount of cells; the COMP protein level of human primary chondrocytes was measured from the four groups.
Culture of chondrocytes
Articular cartilage tissues from KBD or control subjects were immediately placed in saline and processed within 12 hours. Primary chondrocytes from KBD and control groups, which we used in all experiments, were harvested as previously reported.11,20,21 The cartilage tissues were cut into 1 mm3 slices and digested with trypsin (Sigma-Aldrich, St. Louis, Missouri, USA) for 30 minutes at room temperature. After washing with phosphate buffered saline (PBS) to remove the trypsin solution, the tissue sections were treated with type II collagenase (Sigma-Aldrich) at 37°C for nine to 11 hours. Subsequently, the cells were harvested and cultured in DMEM/F-12 (1:1) supplemented with 10% (v/v) fetal calf serum (HyClone, Logan, Utah, USA), 100 units/ml penicillin and 100 μg/ml streptomycin at 37°C in 5% CO2. Non-adherent tissue pieces were carefully removed by replacing the medium every three to five days, subsequent experiments were conducted when the primary chondrocytes reached 80% to 90% confluence. Immunocytochemistry of type II collagen (Abcam, ab34712) and Safranin O staining (Solarbio, G2540) were conducted to identify the phenotype of seeded chondrocytes (seen in Supplementary figure a). Primary chondrocytes used in this study are first-generation cells. The C28/I2 normal chondrocyte cell line (donated by Mary B. Goldring) were used for the T-2 toxin intervention experiment. Briefly, the chondrocytes were cultured in a six-well plate at a seeding density of 1 × 10⁵ cells/ml in DMEM/F12 supplemented with 10% fetal bovine serum (Gibco; Thermo Fisher Scientific, Waltham, Massachusetts, USA) and 1% antibiotic in an atmosphere of 5% CO2 at 37°C.
Thiazolyl blue (MTT) assay
The viability of C28/I2 normal chondrocyte cell line was determined by MTT (0793; Amresco, Radnor, Pennsylvania, USA) assay with different concentrations of T-2 toxin (T002980; J&K Scientific Company, Beijing, China) and different time interventions. The T-2 toxin intervention concentrations used in the MTT experiment include 0 ng/ml, 1 ng/ml, 2 ng/ml, and 5 ng/ml respectively under intervention time of 12 hours, 24 hours, 48 hours, and 72 hours. Results of MTT assay can be seen in Table I and Supplementary figure b. Finally, 72 hours was decided as the intervention time in the following experiment. The RNA and protein of C28/I2 normal chondrocyte cell line were extracted under different T-2 toxin intervention concentrations. Quantitative reverse transcription PCR and western blotting experiments were performed to determine COMP mRNA and protein expression levels.
RNA isolation and qRT-PCR experiment
Total RNA of chondrocytes was extracted using TRIzol (Invitrogen, Carlsbad, California, USA), 500 ng of total RNA was reverse-transcribed to synthesized complementary DNA (cDNA). A total 25 μl of reaction volume was used for the qRT-PCR, including 12.5 μl of SYBR premix EX TaqII Mix, 1 μl of each primer, and 2 μl of diluted cDNA. The parameters of qRT-PCR were as follows: 30 seconds at 95°C, followed by 40 cycles of five seconds t 95°C and 30 seconds at 60°C. CFX96 Real-Time PCR System (Bio-Rad Laboratories, Hercules, California, USA) was used for reaction. The cycle threshold (Ct) values were collected and normalized to the level of glyceraldehyde-3-phosphate dehydrogenase (GAPDH). The level of relative mRNA of each target gene was calculated by using the 2−ΔΔCt method. Primer sequences can be seen in Supplementary table i.
Western blot experiment
Cells were lysed in lysis buffer (RIPA WB053; Xi’an Hat Biotechnology, Xi’an, Shaanxi, China) and centrifuged with 12,000 rpm under 4°C for ten minutes. The protein samples in the supernatant were immediately collected, and the concentration was measured using the BCA Protein Assay Kit (PA115; Tiangen Biotech, Beijing, China). Equivalent amounts of protein were separated by 10% SDS-PAGE and then transferred onto polyvinylidene difluoride (PVDF) membranes (Amersham Pharmacia Biotech, Uppsala, Sweden). After blocking with 5% non-fat dry milk in PBS containing 0.1% Tween-20 for three hours at room temperature, the membranes were incubated at 4°C overnight with primary antibodies (1:1,000) against COMP (33060; Signalway Antibody, College Park, Maryland, USA) and then incubated with a secondary antibody (1:500) (Control Rabbit immunoglobulin; PeproTech, Cranbury, New Jersey, USA) at low speed for 1.5 hours. Enhanced chemiluminescence (ECL), using an EasyBlot ECL kit (cat. no. 36,222ES60; Shanghai Yeasen Biotechnology, Shanghai, China) was utilized for developing, and the reaction was terminated when the target band had clear staining. The band of western blot was scanned by the gel documentation systems (SynGene, Bangalore, India). Labworks software (PerkinElmer, Waltham, Massachusetts, USA) was used to detect and calculate the integral optical density (IOD) value of each band. After comparison with the IOD value of internal reference band of GAPDH, the rations of the protein expression level were measured.
Overexpression of COMP
A COMP overexpression cell model was built up on KBD chondrocytes by lentiviral transfection. The KBD chondrocyte sample collection was described as above. Articular chondrocytes from KBD patients were seeded in three six-well culture plates. Each plate was for control group, negative virus control group, and COMP-overexpression group (conventional medium with HiTransG P). After the supernatant in each well was removed, 1 ml of conventional medium and 40 μl of HiTransG P infection-enhancing solution were added to each well. The optimal multiplicity of infection (MOI) selected in this experiment was determined to be 100 by the lentivirus infection pre-experiment. The cells were infected at MOI 100 for a total of 72 hours. Cells were collected for evaluating the change of apoptosis level by MTT assay, and qRT-PCR was performed to compare the expression of downstream apoptosis-promoting genes and apoptosis-suppressing genes between COMP overexpression group and control group.
Statistical analysis
Statistical analysis was conducted using SPSS software version 20.0 (IBM SPSS, Armonk, New York, USA). Data are presented as the mean and SD. Comparisons were made using independent-samples and paired t-tests and one-way analysis of variance (ANOVA) test. Comparison of data among experimental groups and the control group was performed using Dunnett-t test. A p-value < 0.05 was considered significant in this study.
Results
Expression of COMP in the chondrocytes from KBD patients and control subjects
The mRNA relative expression ratio of COMP in KBD chondrocytes was significantly lower than that in control chondrocytes (fold change = 0.14 (SD 0.14, p = 0.009, independent-samples t-test, Figure 1a)). Besides, the protein relative expression ratio of COMP in KBD patients was also significantly lower than that in control chondrocytes (fold change = 0.44 (SD 0.14, p = 0.004, independent-samples t-test, Figure 1b, Figure 1c)).
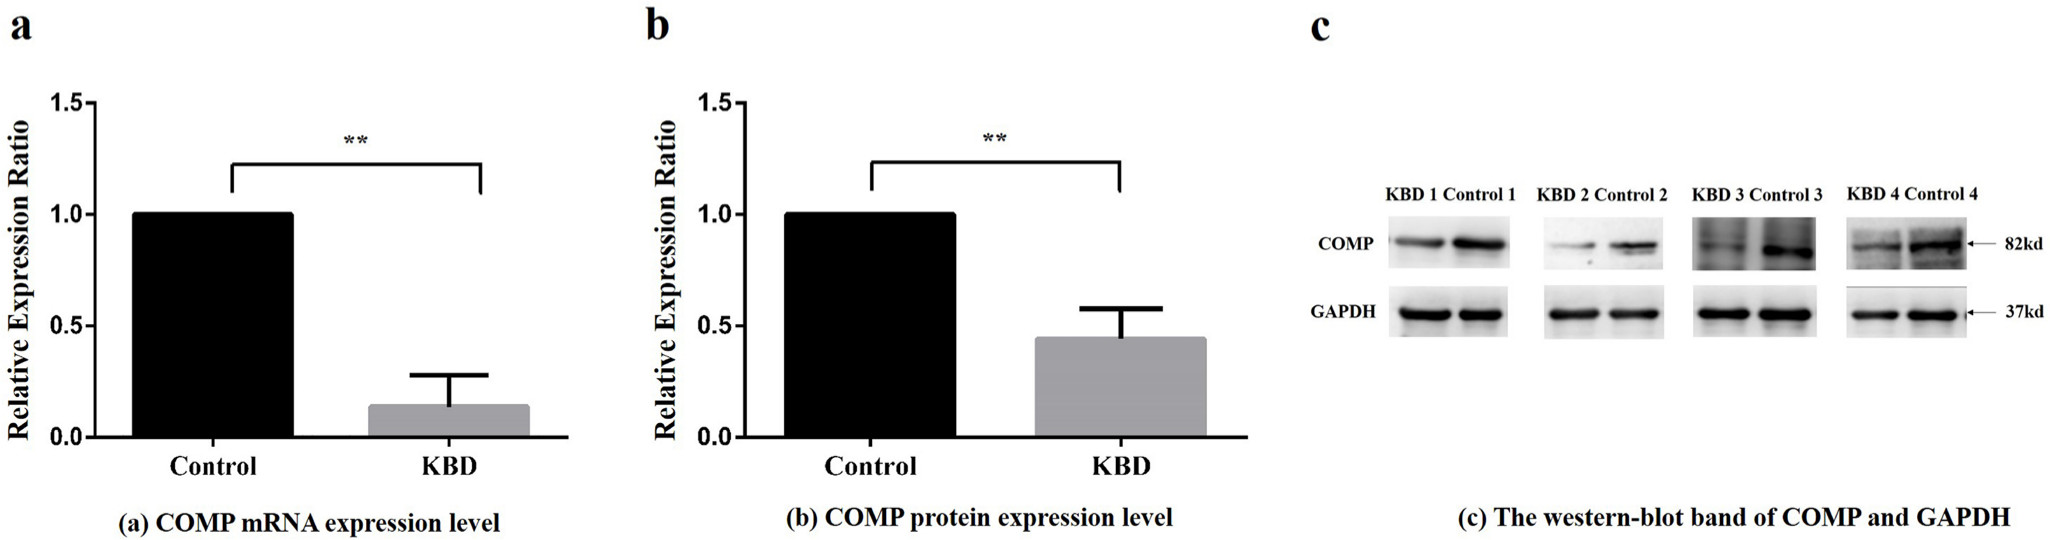
Fig. 1
Relative expression ratio of cartilage oligosaccharide matrix protein (COMP) in messenger RNA (mRNA) and protein scales between Kashin-Beck disease (KBD) patients and controls. a) Relative expression ratio of COMP mRNA between KBD patients and normal controls. Compared with the control group, **p < 0.01. b) Relative protein expression ratio of average integrated optical density (IOD) value extracted from western blot band of COMP between KBD patients and controls. IOD compared with the control group, **p < 0.01. c) The western blot band of COMP and reference protein glyceraldehyde-3-phosphate dehydrogenase (GAPDH) in four KBD patients and four control subjects.
Effects of T-2 toxin intervention on COMP expression
The results of MTT assay showed that the viability of C28/I2 normal chondrocytes decreased gradually with the increase of T-2 toxin concentration under the same intervention time (Table I, Supplementary figure b). Besides, the viability of the cells was also reduced with intervention time increasing under the same intervention concentration (Table I, Supplementary figure b).
Table I.
The effect of T-2 toxin on the viability of C28/I2 cells was tested at different concentrations and different times.
| Intervention time (hrs) | T-2 toxin concentration, ng/ml | |||
|---|---|---|---|---|
| 0 | 1 | 2 | 5 | |
| 12 | 1 | 0.93 | 0.94 | 0.87 |
| 24 | 1 | 0.95 | 0.92 | 0.80 |
| 48 | 1 | 0.97 | 0.89 | 0.49 |
| 72 | 1 | 0.90 | 0.70 | 0.51 |
After the T-2 toxin intervention, significant changes of COMP expression was observed in C28/I2 chondrocyte cell line. The mRNA relative expression ratio of COMP was found significantly different among intervention groups with different T-2 toxin concentrations (p = 0.046, ANOVA) (Figure 2a). The protein relative expression ratio of COMP was significantly different among intervention groups with different T-2 toxin concentrations (p = 0.005, ANOVA) (Figure 2b, Figure 2c).
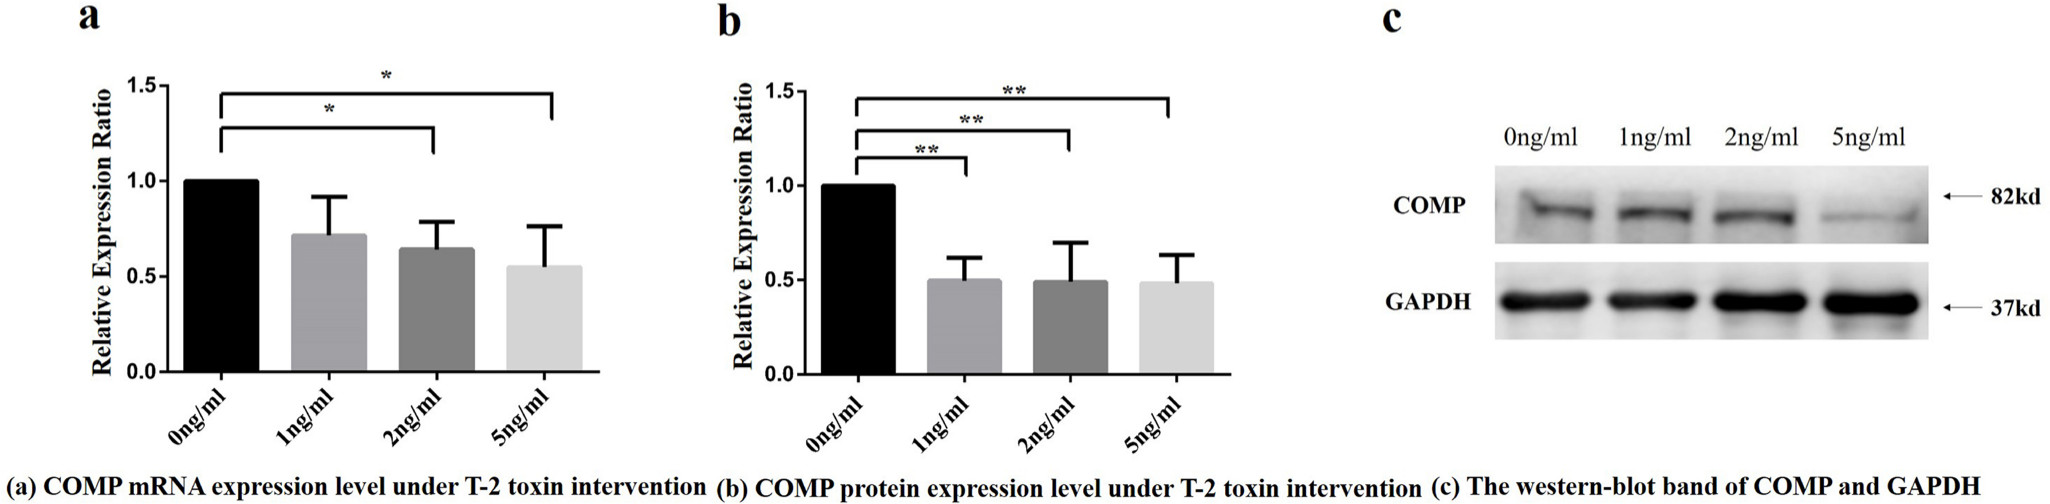
Fig. 2
Cartilage oligosaccharide matrix protein (COMP) messenger RNA (mRNA) and protein relative expression ratio under different concentrations of T-2 toxin intervention. a) COMP mRNA relative expression ratio under different concentrations of T-2 toxin intervention. Note: Compared with the control group, *p < 0.05. Using Dunnett-t test, 2 ng/ml and 5 ng/ml T-2 toxin concentration intervention group were statistically significant compared to 0 ng/ml toxin intervention group. b) COMP protein relative expression of integrated optical density (IOD) values under different T-2 toxin concentrations. Note: Using Dunnett-t test, the values in 1 ng/ml, 2 ng/ml, and 5 ng/ml T-2 toxin concentration intervention groups were found to be statistically significant compared with the 0 ng/ml toxin intervention group, respectively, **p < 0.01. c) The western blot band of COMP and reference protein in four groups with different T-2 toxin treatment concentrations. GADPH, glyceraldehyde-3-phosphate dehydrogenase.
Effect of COMP overexpression on the activity of KBD articular chondrocytes
The KBD chondrocytes with COMP overexpression was established. Results showed a high fluorescence abundance of GFP (green fluorescent protein) after 72 hours of infection (Supplementary figure c). According to Supplementary figure c, COMP lentivirus was successfully transfected in chondrocytes (Supplementary figure c). The mRNA relative expression ratio of COMP in the overexpression cell model became significant higher than that in the blank control group and negative control group (PCOMP-Blank < 0.001, Dunnett-t test, PCOMP-Negative < 0.001, Dunnett-t test ) (Figure 3a). Compared with the blank control group, the chondrocyte survival rate of COMP overexpression group were significantly increased (p = 0.020, Dunnett-t test) (Figure 3b), there was no significant difference between COMP overexpression group and negative control group (p = 0.730, Dunnett-t test) (Figure 3b).
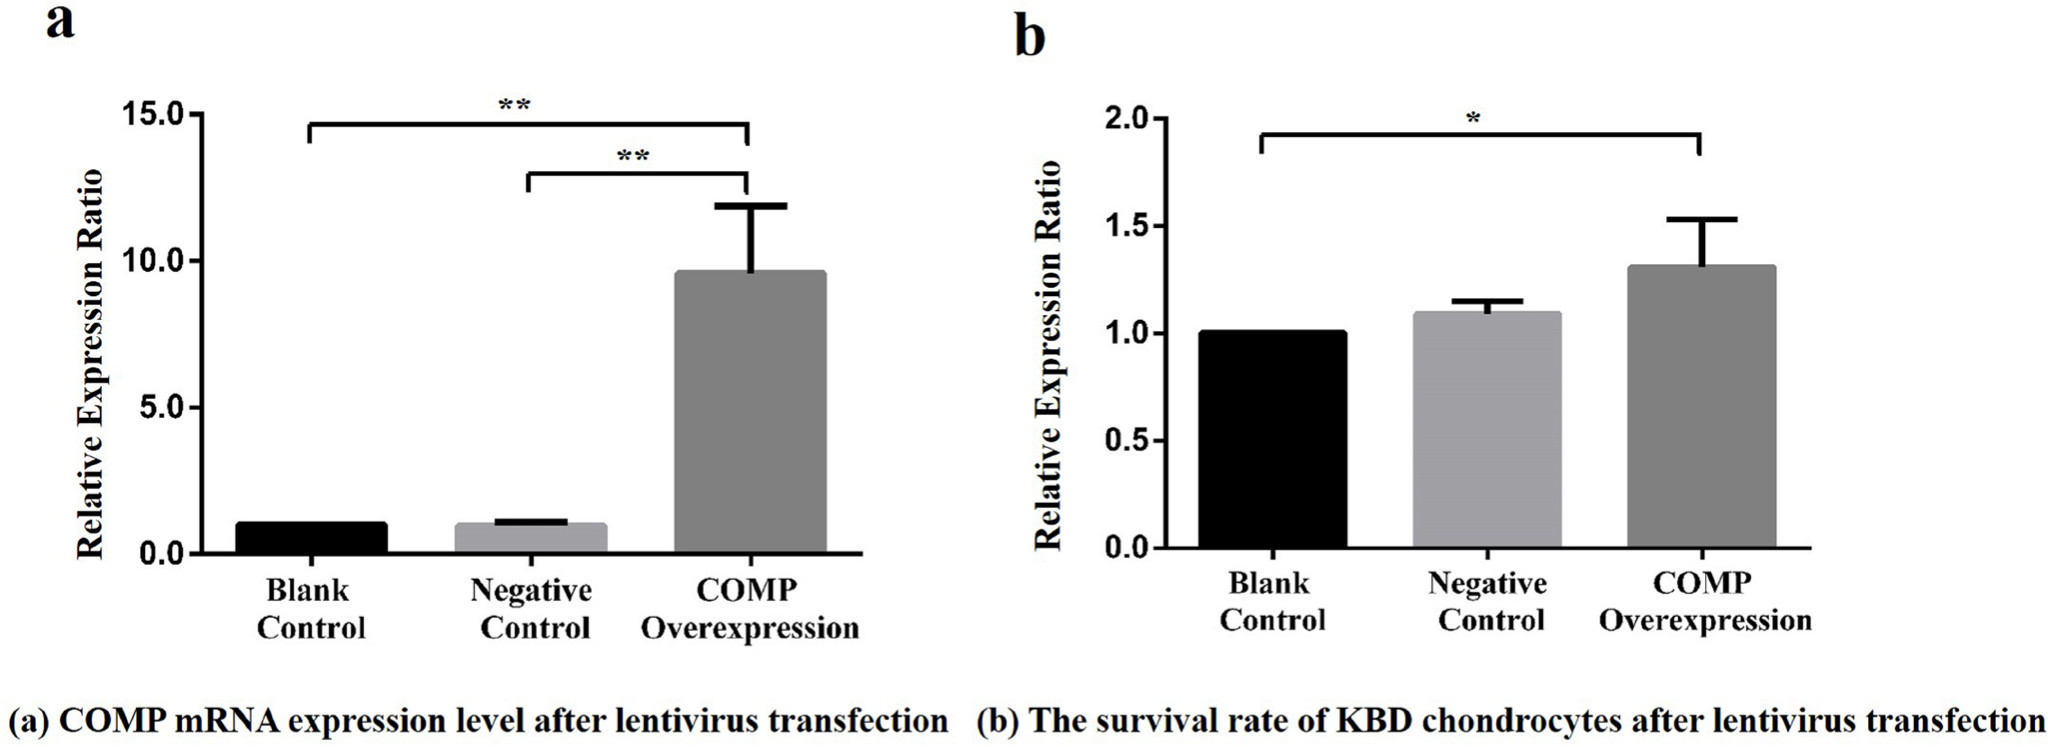
Fig. 3
a) Relative expression ratio of cartilage oligosaccharide matrix protein (COMP) overexpressing lentivirus in articular chondrocytes among the blank control, negative control, and COMP overexpression groups. Compared with the COMP overexpression group, the mean COMP expression levels in the blank control group and negative control group were reduced significantly (7.25, SD 4.69 and 10.12, SD 2.86, respectively; all **p < 0.001, Dunnett-t test). b) Effect of COMP overexpression of lentivirus on the activity of articular chondrocytes in Kashin-Beck disease (KBD) among the blank control, negative control, and COMP overexpression groups. Compared with the COMP overexpression group, the mean survival rate of KBD chondrocytes in the blank control group was reduced (1.31, SD 0.22; *p < 0.05, Dunnett-t test).
Effect of COMP overexpression on the mRNA expression of Survivin (BIRC5), XIAP, and SOX9
After transfection for 72 hours, the relative expressionratio of downstream apoptosis inhibitory genes, Survivin (BIRC5), XIAP, and SOX9 were detected by qRT-PCR. The Survivin (PCOMP-Blank < 0.001 , PCOMP-Negative < 0.001 ) and SOX9 (PCOMP-Blank < 0.001 , PCOMP-Negative < 0.001; Dunnett-t test) mRNA relative expression ratio of COMP overexpression group was significantly higher than that in blank control group and negative control group (Figure 4a and 4b). No statistical differences were observed in XIAP mRNA expression level among the COMP overexpressing group, the blank control group, and the negative control group (p = 0.230, ANOVA) (Figure 4e).
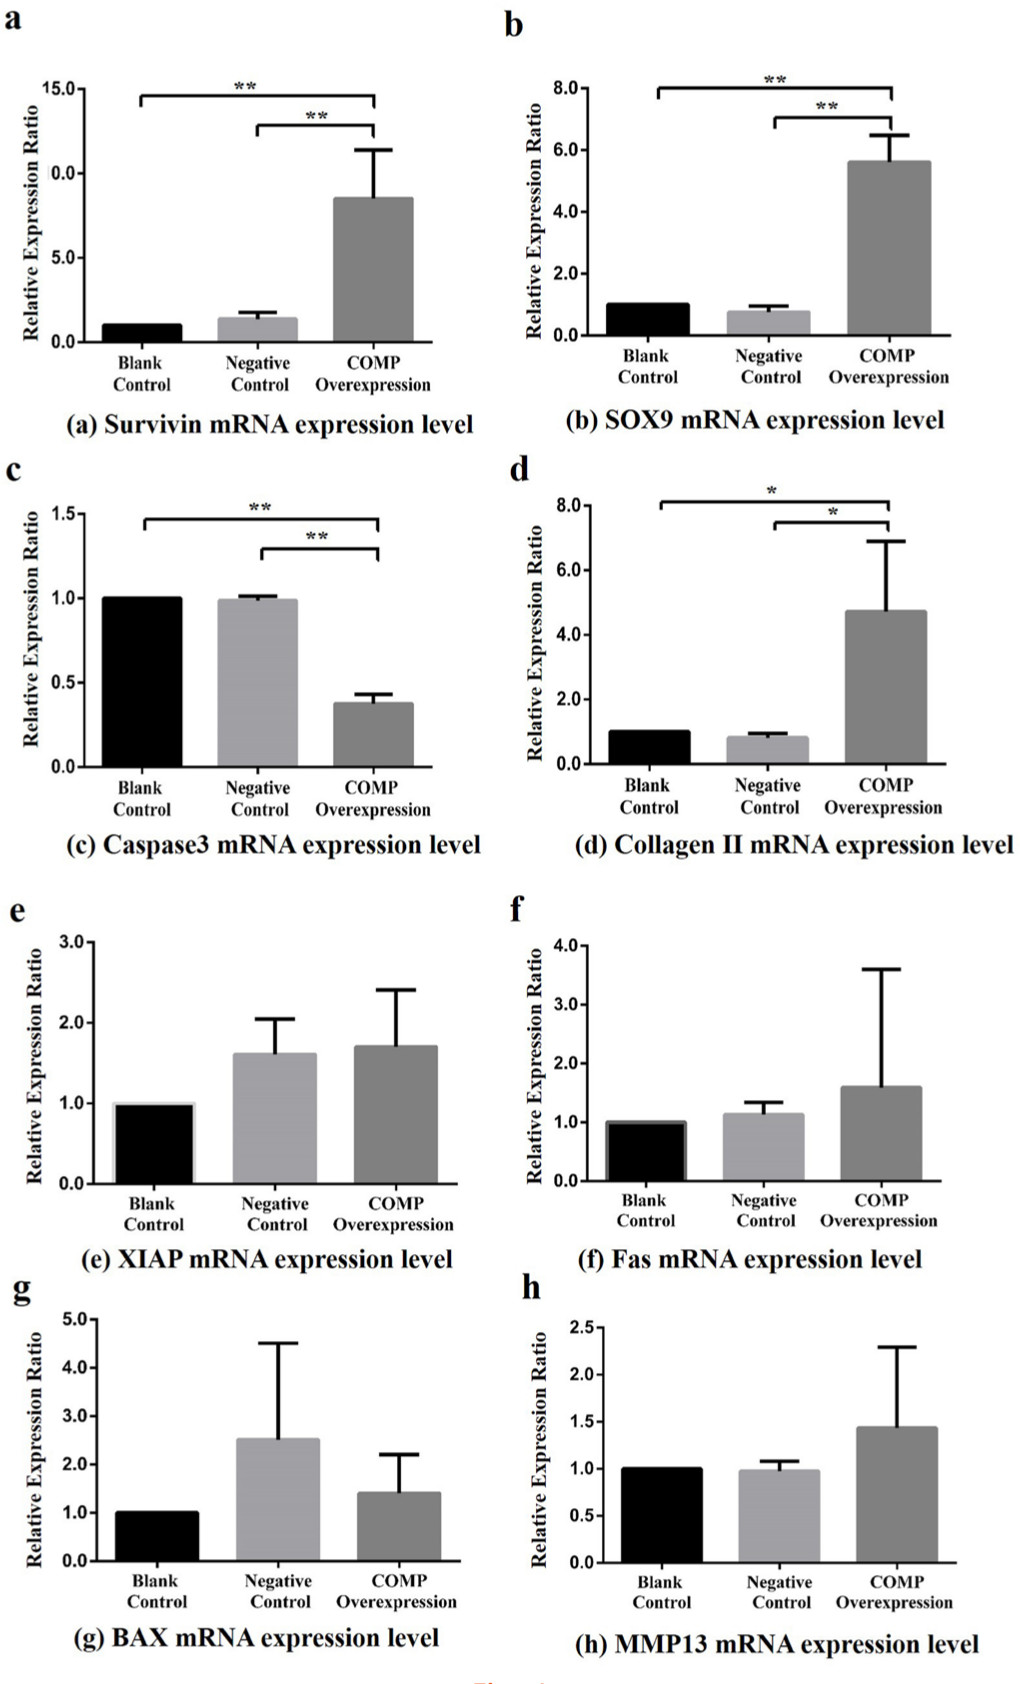
Fig. 4
Effects of cartilage oligosaccharide matrix protein (COMP) overexpression on downstream genes in Kashin-Beck disease (KBD) chondrocyte model (the COMP overexpression was only performed for the KBD cells) among the blank control, negative control, and COMP overexpression groups. a) Compared with the COMP overexpression group, the Survivin mean messenger RNA (mRNA) relative expression ratios in the blank control group and negative control group were reduced (8.51, SD 2.88 and 6.77, SD 3.60, respectively; all **p < 0.001, Dunnett-t test). b) Compared with the COMP overexpression group, the sex-determining region Y-box 9 (SOX9) mean mRNA relative expression ratios in the blank control group and negative control group were reduced (5.61, SD 0.87 and 7.71, SD 2.17, respectively; **p < 0.001 , Dunnett-t test). c) Compared with the COMP overexpression group, the Caspase 3 mean mRNA relative expression ratios in the blank control group and negative control group were increased (0.38, SD 0.05 and 0.38, SD 0.04, respectively; all **p < 0.001, Dunnett-t test). d) Compared with the COMP overexpression group, the type II collagen mean mRNA relative expression ratios in the blank control group and negative control group were reduced (4.72, SD 2.17 and 5.66, SD 1.72, respectively; all *p < 0.050, Dunnett-t test). e) Effect on x-linked inhibitor of apoptosis protein (XIAP) (p = 0.948, one-way analysis of variance (ANOVA)). f) Effect on Fas (p = 0.095, ANOVA). g) Effect on Bcl-2-associated x protein (BAX) (p = 0.347, ANOVA). h) Effect on MMP13 (p = 0.263, ANOVA).
Effect of COMP overexpression on the mRNA expression of Caspase 3, Bax, and Fas
The Caspase 3 mRNA relative expression ratio of COMP overexpression group was significantly lower than that in blank control group and negative control group (PCOMP-Blank < 0.001, PCOMP-Negative < 0.001, Dunnett-t test Figure 4c). The mRNA relative expression ratio of Bax (p = 0.370, ANOVA) and Fas (p = 0.810, ANOVA) did not show statistical difference among the COMP overexpression group, the blank control group, and the negative control group (Figure 4g, Figure 4f)
Effect of COMP overexpression on the mRNA expression of type II collagen and matrix metalloproteinase 13
Comparing with COMP overexpression group, the type II collagen mRNA relative expression ratio in the blank control group and negative control group were significantly lower (PCOMP-Blank = 0.033, PCOMP-Negative = 0.027, Dunnett-t test Figure 4d). No significant differences were observed in the MMP13 mRNA relative expressionratio among the COMP overexpression group, the blank control group, and the negative control group (p = 0.490, ANOVA) (Figure 4h).
Discussion
In this study, we found that the expression of COMP in KBD cartilage was significantly lower than that in control cartilage, implying the involvement of COMP in the KBD development. It has been found that COMP not only exists in the hyaline cartilage but also in serum (sCOMP) and synovial fluid.22 Kong et al9 have reported that extracellular matrix protein 1 (ECM1), as a novel COMP-associated partner, can interact with COMP to regulate endochondral bone growth. In addition, COMP also has an important intracellular function in assisting efficient secretion of collagens, which was proved in COMP-null mice with severely attenuated fibrotic responses in skin.23 Additionally, it has been discovered that COMP can protect primary human chondrocytes from death and is able to block activation of caspase 3, a critical effector caspase.24 Previous evidence has showed that COMP mutations are associated with pseudoachondroplasia (PSACH), an autosomal dominant osteochondrodysplasia characterized by short-limb short stature, brachydactyly, and early-onset osteoarthropathy.25 Moreover, two novel mutations in the COMP gene have also been discovered in six PSACH families.26 OA is a common chronic joint disease characterized by chondrocyte reduction and extracellular matrix degradation. Bai et al27 found that early dynamic combined detection of serum C-telopeptides of type II collagen (CTX-II) and COMP concentrations is effective for early OA diagnosis. In addition, sCOMP has been proved to be one of the biomarkers in the diagnosis and prognosis of knee and hip OA patients.28 The sCOMP level also has the potential to be used as a biological marker for differentiating between patients with rheumatoid arthritis (RA) and healthy individuals.29,30 The relevance of COMP and bone development or disease has been identified by previous studies.31,32 Based on our study results, it is necessary to further explore the potential of COMP in the diagnosis and treatment of KBD.
Previous studies have demonstrated the key role of excessive chondrocyte apoptosis in the articular cartilage damage of KBD.5,33 Lemarié et al34 concluded that chondrocyte apoptosis was a target of modulate cartilage degeneration in OA. In this study, we also explored the effects of COMP on the expression of apoptosis-suppressing genes, including Survivin, XIAP, and SOX9. We observed that the mRNA expression levels of Survivin and SOX9 in COMP overexpression KBD chondrocytes were significantly higher than that in control group. Survivin was firstly reported by Ambrosini et al35 in 1997, which was located on chromosome 17. It is the smallest member of the inhibitor of apoptosis protein (IAP) family. Jaiswal et al36 found that Survivin had dual functions of regulating cell death as well as cell mitosis, and also can exert an anti-apoptosis effect by inhibiting caspase pathway. Transcription factor SOX-9 is a protein which is encoded by the SOX9 gene in human beings. As a transcription factor, it plays an important regulatory role in cartilage formation. It could bind to the chondrocyte-specific enhancer collagen type II α 1 (Col2α1) and regulates its expression directly.37 Guo et al38 found that SOX9 regulated the proliferation and apoptosis of human lung cancer cells through wnt/β-catenin signalling pathway. Furthermore, Wang et al39 observed that SOX9 was significantly up-regulated in KBD cartilage. The expression levels of SOX9 were also found to be significantly increased in the chondrocytes with T-2 treatment.39 Our study results suggest that COMP might play a role in the excessive chondrocyte apoptosis of KBD through decreasing the expression of Survivin and SOX9. Further biological studies are needed to clarify the molecular mechanism of COMP involved in the development of KBD.
In addition, we also explored the effect of overexpression of COMP on type II collagen. Type II collagen is the basis for articular cartilage and hyaline cartilage, formed by homotrimers of collagen type II α 1 chains. Lack of collagen II is considered as a signal of cartilage cell apoptosis.40 Previous study demonstrated that expression of collagen II decreased in human chondrocytes from KBD patients in vitro.41 In this study, the mRNA expression of type II collagen in COMP overexpression KBD chondrocytes was significantly higher than that of control group, indicating the involvement of COMP in the dysfunction of type II collagen synthesis and metabolism of KBD patients.
In this study, we also found that T-2 toxin could result in significant reduction of COMP expression, suggesting that T-2 toxin might exert an effect on KBD cartilage damage through COMP. It has been reported that T-2 toxin contamination in grains was a highly suspected factor for KBD development.42 For example, Li et al43 found that T-2 toxin accumulation was more severe in KBD endemic areas. In vitro, T-2 toxin could inhibit aggrecan synthesis, promote aggrecanases and pro-inflammatory cytokines production, and consequently induce aggrecan degradation in chondrocytes.42 Wang et al44 found that T-2 toxin treatment in rats could induce degenerative articular cartilage lesions similar to spontaneous OA. Interleukin-1 β (IL-1β), as a kind of inflammatory factor, has been reported as a trigger of inflammation in chondrocytes.45 It was also involved in T-2 toxin-induced chondrocyte injury and metabolism imbalance.46 Additionally, increased levels of IL-6, IL-1β, and TNF-α could be induced in serum and cartilages under a selenium-deficient nutritional status with T-2 toxin exposure, which may account for the pathological mechanism underlying the cartilage damage of KBD.47 As a target of T-2 toxin, more attention should be paid to COMP in the aetiological and pathological study of KBD.
However, there are some limitations of this study. Firstly, in the lentivirus experiment for COMP overexpression model of KBD chondrocytes, the factor of T-2 toxin was not involved. T-2 toxin treatment was only conducted on the chondrocyte cell line. That is partly because of the difficulty in obtaining human primary chondrocytes. Such compromised design means that the combined effect of T-2 toxin and COMP cannot be observed in one experiment. Moreover, T-2 toxin treatment experiments were only conducted on normal chondrocyte cell line, not on the KBD chondrocytes, so the difference in susceptibility between KBD chondrocytes and normal chondrocytes against T-2 toxin cannot be concluded from this study either. Thirdly, the histology work, such as the staining image of immunohistochemistry in cartilage tissue, was not conducted during this study, so the expression level and location of COMP in the cartilage had not been observed.
In summary, we explored the potential role of COMP in the articular cartilage damage of KBD. Our study confirmed the implication of COMP in KBD development and provided new evidence for understanding the molecular mechanism of KBD cartilage damage. COMP may have effects on the excessive chondrocyte apoptosis and dysfunction of type II collagen synthesis, and metabolism of KBD patients. Further studies are warranted to confirm our findings and clarify the biological mechanism of COMP involved in the development of KBD.
References
1. Guo X , Ma W-J , Zhang F , et al. Recent advances in the research of an endemic osteochondropathy in China: Kashin-Beck disease . Osteoarthritis Cartilage . 2014 ; 22 ( 11 ): 1774 – 1783 . Crossref PubMed Google Scholar
2. Mathieu F , Begaux F , Lan ZY , et al. Clinical manifestations of Kashin-Beck disease in Nyemo Valley, Tibet . Int Orthop . 1997 ; 21 ( 3 ): 151 – 156 . Crossref PubMed Google Scholar
3. Wen Y , Zhang F , Li C , et al. Gene expression analysis suggests bone development-related genes Gdf5 and DIO2 are involved in the development of Kashin-Beck disease in children rather than adults . PLoS One . 2014 ; 9 ( 7 ): e103618 . Crossref PubMed Google Scholar
4. Horton WE , Feng L , Adams C . Chondrocyte apoptosis in development, aging and disease . Matrix Biol . 1998 ; 17 ( 2 ): 107 – 115 . Crossref PubMed Google Scholar
5. Yang HJ , Zhang Y , Wang ZL , et al. Increased chondrocyte apoptosis in Kashin-Beck disease and rats induced by T-2 toxin and selenium deficiency . Biomedical and Environmental Sciences . 2017 ; 30 ( 5 ): 351 – 362 . Crossref PubMed Google Scholar
6. Zhang Y , He Y , Zhang D , et al. Death of chondrocytes in Kashin-Beck disease: apoptosis, necrosis or necroptosis? Int J Exp Pathol . 2018 ; 99 ( 6 ): 312 – 322 . Google Scholar
7. Musumeci G , Loreto C , Carnazza ML , et al. OA cartilage derived chondrocytes encapsulated in poly(ethylene glycol) diacrylate (PEGDA) for the evaluation of cartilage restoration and apoptosis in an in vitro model . Histol Histopathol . 2011 ; 26 ( 10 ): 1265 – 1278 . Crossref PubMed Google Scholar
8. Thomas CM , Murray R , Sharif M . Chondrocyte apoptosis determined by caspase-3 expression varies with fibronectin distribution in equine articular cartilage . Int J Rheum Dis . 2011 ; 14 ( 3 ): 290 – 297 . Crossref PubMed Google Scholar
9. Kong L , Tian Q , Guo F , et al. Interaction between cartilage oligomeric matrix protein and extracellular matrix protein 1 mediates endochondral bone growth . Matrix Biol . 2010 ; 29 ( 4 ): 276 – 286 . Crossref PubMed Google Scholar
10. Schulz J-N , Nüchel J , Niehoff A , et al. COMP-assisted collagen secretion–a novel intracellular function required for fibrosis . J Cell Sci . 2016 ; 129 ( 4 ): 706 – 716 . Google Scholar
11. Bai B , Li Y . Combined detection of serum CTX-II and COMP concentrations in osteoarthritis model rabbits: an effective technique for early diagnosis and estimation of disease severity . J Orthop Surg Res . 2016 ; 11 ( 1 ): 149 . Crossref PubMed Google Scholar
12. Hao HQ , Zhang JF , He QQ , Wang Z . Cartilage oligomeric matrix protein, C-terminal cross-linking telopeptide of type II collagen, and matrix metalloproteinase-3 as biomarkers for knee and hip osteoarthritis (OA) diagnosis: a systematic review and meta-analysis . Osteoarthritis Cartilage . 2019 ; 27 ( 5 ): 726 – 736 . Crossref PubMed Google Scholar
13. Parker JD , Lim KS , Kieser DC , et al. Is tranexamic acid toxic to articular cartilage when administered topically? what is the safe dose? Bone Joint J . 2018 ; 100-B ( 3 ): 404 – 412 . Crossref PubMed Google Scholar
14. Jacob B , Zippelius T , Kloss N , et al. Local anesthetics’ toxicity toward human cultured chondrocytes: a comparative study between lidocaine, bupivacaine, and ropivacaine . Cartilage . 2019 ; 10 ( 3 ): 194760351875843 : 364 – 369 . Google Scholar
15. Li SY , Cao JL , Shi ZL , et al. Promotion of the articular cartilage proteoglycan degradation by T-2 toxin and selenium protective effect . J Zhejiang Univ Sci B . 2008 ; 9 ( 1 ): 22 – 33 . Crossref PubMed Google Scholar
16. Li D , Han J , Guo X , et al. The effects of T-2 toxin on the prevalence and development of Kashin–Beck disease in China: a meta-analysis and systematic review . Toxicol Res . 2016 ; 5 ( 3 ): 731 – 751 . Google Scholar
17. Liu J , Wang L , Guo X , et al. The role of mitochondria in T-2 toxin-induced human chondrocytes apoptosis . PLoS One . 2014 ; 9 ( 9 ): e108394 – e108394 . Crossref PubMed Google Scholar
18. Liu N . Interpretation of Kashin-Beck disease diagnostic criteria . China Health Standard Management . 2010 ; 01 ( 004 ): 56 – 58 . Google Scholar
19. Yu FF , Ping ZG , Yao C , et al. Evaluation of the sensitivity and specificity of the new clinical diagnostic and classification criteria for Kashin-Beck disease, an endemic osteoarthritis, in China . Biomed Environ Sci . 2017 ; 30 ( 2 ): 150 – 155 . Crossref PubMed Google Scholar
20. Jing H , Xiong G . Down-Regulation of ATF2 in the inhibition of T-2-toxin-induced chondrocyte apoptosis by selenium chondroitin sulfate nanoparticles . Journal of Nanoparticle Research . 2013 ; 15 ( 12 ). Google Scholar
21. Wu C , Zheng J , Yao X , et al. Defective autophagy in chondrocytes with Kashin-Beck disease but higher than osteoarthritis . Osteoarthritis Cartilage . 2014 ; 22 ( 11 ): 1936 – 1946 . Crossref PubMed Google Scholar
22. Smith RK , Heinegard D . Cartilage oligomeric matrix protein (COMP) levels in digital sheath synovial fluid and serum with tendon injury . Equine Vet J . 2000 ; 32 ( 1 ): 52 – 58 . Crossref PubMed Google Scholar
23. Schulz JN , Nüchel J , Niehoff A , et al. COMP-assisted collagen secretion – a novel intracellular function required for fibrosis . J Cell Sci . 2016 ; 129 ( 4 ): 706 – 716 . Google Scholar
24. Gagarina V , Carlberg AL , Pereira-Mouries L , Hall DJ . Cartilage oligomeric matrix protein protects cells against death by elevating members of the IAP family of survival proteins . J Biol Chem . 2008 ; 283 ( 1 ): 648 – 659 . Crossref PubMed Google Scholar
24. Gu C , Yang Z , Tan H , Zhang Y , Lu Y , Ma Y . Decreased plasma COMP and increased plasma CTX-II levels in a Chinese pseudoachondroplasia family with novel COMP mutation . Biomed Res Int . 2017 ; 5809787 . Crossref PubMed Google Scholar
26. Yu WJ , Zhang Z , He JW , et al. Identification of two novel mutations in the COMP gene in six families with pseudoachondroplasia . Mol Med Rep . 2016 ; 14 ( 3 ): 2180 – 2186 . Crossref PubMed Google Scholar
27. Bai B , Li YQ . Combined detection of serum CTX-II and COMP concentrations in osteoarthritis model rabbits: an effective technique for early diagnosis and estimation of disease severity . J Orthop Surg Res . 2016 ; 11 ( 1 ): 149 . Crossref PubMed Google Scholar
28. Hao HQ , Zhang JF , He QQ , Wang Z . Cartilage oligomeric matrix protein, C-terminal cross-linking telopeptide of type II collagen, and matrix metalloproteinase-3 as biomarkers for knee and hip osteoarthritis (OA) diagnosis: a systematic review and meta-analysis . Osteoarthritis Cartilage . 2019 ; 27 ( 5 ): 726 – 736 . Crossref PubMed Google Scholar
29. Liu F , Wang X , Zhang X , et al. Role of serum cartilage oligomeric matrix protein (COMP) in the diagnosis of rheumatoid arthritis (rA): a case-control study . J Int Med Res . 2016 ; 44 ( 4 ): 940 – 949 . Crossref PubMed Google Scholar
30. Saghafi M , Khodashahi M , Saadati N , et al. Relationship between cartilage oligomeric matrix protein (COMP) and rheumatoid arthritis severity . Electron Physician . 2017 ; 9 ( 12 ): 5940 – 5947 . Crossref PubMed Google Scholar
31. Coustry F , Posey KL , Maerz T , et al. Mutant cartilage oligomeric matrix protein (COMP) compromises bone integrity, joint function and the balance between adipogenesis and osteogenesis . Matrix Biol . 2018 ; 67 : 75 – 89 . Crossref PubMed Google Scholar
32. Briggs MD , Hoffman SM , King LM , et al. Pseudoachondroplasia and multiple epiphyseal dysplasia due to mutations in the cartilage oligomeric matrix protein gene . Nat Genet . 1995 ; 10 ( 3 ): 330 – 336 . Crossref PubMed Google Scholar
33. Zhang F , Wen Y , Guo X , et al. Trans-omics pathway analysis suggests that eQTLs contribute to chondrocyte apoptosis of Kashin-Beck disease through regulating apoptosis pathway expression . Gene . 2014 ; 553 ( 2 ): 166 – 169 . Crossref PubMed Google Scholar
34. Hwang HS , Kim HA . Chondrocyte apoptosis in the pathogenesis of osteoarthritis . Int J Mol Sci . 2015 ; 16 ( 11 ): 26035 – 26054 . Crossref PubMed Google Scholar
35. Ambrosini G , Adida C , Altieri DC . A novel anti-apoptosis gene, survivin, expressed in cancer and lymphoma . Nat Med . 1997 ; 3 ( 8 ): 917 – 921 . Crossref PubMed Google Scholar
36. Jaiswal PK , Goel A , Mittal RD . Survivin: a molecular biomarker in cancer . Indian J Med Res . 2015 ; 141 ( 4 ): 389 – 397 . Crossref PubMed Google Scholar
37. Symon A , Harley V . SOX9: a genomic view of tissue specific expression and action . Int J Biochem Cell Biol . 2017 ; 87 : 18 – 22 . Crossref PubMed Google Scholar
38. Guo YZ , Xie XL , Fu J , Xing GL . SOX9 regulated proliferation and apoptosis of human lung carcinoma cells by the Wnt/beta-catenin signaling pathway . Eur Rev Med Pharmacol Sci . 2018 ; 22 ( 15 ): 4898 – 4907 . Google Scholar
39. Yang HJ , Zhang Y , Wang ZL , et al. Increased chondrocyte apoptosis in Kashin-Beck disease and rats induced by T-2 toxin and selenium deficiency . Biomed Environ Sci . 2017 ; 30 ( 5 ): 351 – 362 . Crossref PubMed Google Scholar
40. Aigner T , Stove J . Collagens-major component of the physiological cartilage matrix, major target of cartilage degeneration, major tool in cartilage repair . Adv Drug Deliv Rev . 2003 ; 55 ( 12 ): 1569 – 1593 . Google Scholar
41. Zhou X , Yang H , Guan F , et al. T-2 toxin alters the levels of collagen II and its regulatory enzymes MMPs/TIMP-1 in a low-selenium rat model of Kashin-Beck disease . Biol Trace Elem Res . 2016 ; 169 ( 2 ): 237 – 246 . Crossref PubMed Google Scholar
42. Li SY , Cao JL , Shi ZL , et al. Promotion of the articular cartilage proteoglycan degradation by T-2 toxin and selenium protective effect . J Zhejiang Univ Sci B . 2008 ; 9 ( 1 ): 22 – 33 . Crossref PubMed Google Scholar
43. Li D , Han J , Guo X , et al. The effects of T-2 toxin on the prevalence and development of Kashin-Beck disease in China: a meta-analysis and systematic review . Toxicol Res (Camb) . 2016 ; 5 ( 3 ): 731 – 751 . Crossref PubMed Google Scholar
44. Wang LH , Fu Y , Shi YX , Wang WG . T-2 toxin induces degenerative articular changes in rodents: link to Kaschin-Beck disease . Toxicol Pathol . 2011 ; 39 ( 3 ): 502 – 507 . Crossref PubMed Google Scholar
45. Yu CD , Miao WH , Zhang YY , et al. Inhibition of miR-126 protects chondrocytes from IL-1β induced inflammation via upregulation of Bcl-2 . Bone Joint Res . 2018 ; 7 ( 6 ): 414 – 421 . Crossref PubMed Google Scholar
46. Chang Y , Wang X , Sun Z , et al. Inflammatory cytokine of IL-1β is involved in T-2 toxin-triggered chondrocyte injury and metabolism imbalance by the activation of Wnt/β-catenin signaling . Mol Immunol . 2017 ; 91 : 195 – 201 . Crossref PubMed Google Scholar
47. Zhou X , Wang Z , Chen J , et al. Increased levels of IL-6, IL-1beta, and TNF-alpha in Kashin-Beck disease and rats induced by T-2 toxin and selenium deficiency . Rheumatol Int . 2014 ; 34 ( 7 ): 995 – 1004 . Google Scholar
Author contributions
M. Ma: Wrote the manuscript, Performed the experiment.
X. Liang: Performed the experiment.
X. Wang: Revised the manuscript.
L. Zhang: Collected the cartilage specimens, Investigated the study subjects.
S. Cheng: Collected the cartilage specimens, Investigated the study subjects.
X. Guo: Investigated the study subjects, Diagnosed all the study subjects.
F. Zhang: Helped to design the study, Provided the specimens.
Y. Wen: Designed and performed the study.
M. Ma and X. Liang contributed equally to this work.
Funding statement
This work was supported by the National Natural Scientific Foundation of China (81703177, 81972980, 81922059) and the General Financial Grant from the China Postdoctoral Science Foundation (2017M623198).
Acknowledgements
We thank Mary B. Goldring for donating immortalized human chondrocyte cell line C-28/I2.
Supplementary material
Table showing the primer sequences used in this study for qRT-PCR, and a figure showing the morphology of KBD chondrocytes, the cell viability changes after T-2 treatment, and fluorescence abundance of chondrocytes after transfection.
© 2020 Author(s) et al. This is an open-access article distributed under the terms of the Creative Commons Attribution Non-Commercial No Derivatives (CC BY-NC-ND 4.0) licence, which permits the copying and redistribution of the work only, and provided the original author and source are credited. See https://creativecommons.org/licenses/by-nc-nd/4.0/.
