


Abstract
Aims
The lack of disease-modifying treatments for osteoarthritis (OA) is linked to a shortage of suitable biomarkers. This study combines multi-molecule synovial fluid analysis with machine learning to produce an accurate diagnostic biomarker model for end-stage knee OA (esOA).
Methods
Synovial fluid (SF) from patients with esOA, non-OA knee injury, and inflammatory knee arthritis were analyzed for 35 potential markers using immunoassays. Partial least square discriminant analysis (PLS-DA) was used to derive a biomarker model for cohort classification. The ability of the biomarker model to diagnose esOA was validated by identical wide-spectrum SF analysis of a test cohort of ten patients with esOA.
Results
PLS-DA produced a streamlined biomarker model with excellent sensitivity (95%), specificity (98.4%), and reliability (97.4%). The eight-biomarker model produced a fingerprint for esOA comprising type IIA procollagen N-terminal propeptide (PIIANP), tissue inhibitor of metalloproteinase (TIMP)-1, a disintegrin and metalloproteinase with thrombospondin motifs 4 (ADAMTS-4), monocyte chemoattractant protein (MCP)-1, interferon-γ-inducible protein-10 (IP-10), and transforming growth factor (TGF)-β3. Receiver operating characteristic (ROC) analysis demonstrated excellent discriminatory accuracy: area under the curve (AUC) being 0.970 for esOA, 0.957 for knee injury, and 1 for inflammatory arthritis. All ten validation test patients were classified correctly as esOA (accuracy 100%; reliability 100%) by the biomarker model.
Conclusion
SF analysis coupled with machine learning produced a partially validated biomarker model with cohort-specific fingerprints that accurately and reliably discriminated esOA from knee injury and inflammatory arthritis with almost 100% efficacy. The presented findings and approach represent a new biomarker concept and potential diagnostic tool to stage disease in therapy trials and monitor the efficacy of such interventions.
Cite this article: Bone Joint Res 2020;9(9):623–632.
Article focus
-
We describe and demonstrate the accuracy of a novel diagnostic biomarker model for end-stage knee osteoarthritis (esOA) by combining multi-molecule synovial fluid (SF) analysis with a machine-learning approach.
Key messages
-
This study challenges the existing paradigm in osteoarthritis (OA) biomarker discovery.
-
An eight-biomarker model with cohort-specific fingerprints accurately and reliably discriminated between esOA, knee injury, and inflammatory arthritis with almost 100% efficacy.
-
The SF fingerprint for OA joint failure is a potential surrogate endpoint and sensitive tool to assess disease progression and disease-modifying interventions.
Strengths and limitations
-
We were unable to obtain control SF from normal patients.
-
The inclusion of patients with knee injury and inflammatory arthritis offers internal (construct) validity to measurements in the absence of normal control samples and provides a biological contrast to OA.
-
The numbers of patients are relatively small due to the comparatively invasive nature of SF sampling.
-
The correct diagnosis of ten patients with esOA can only be considered partial validation, with full validation requiring further knee injury, inflammatory arthritis, and more esOA samples.
Introduction
Osteoarthritis (OA) is a leading cause of pain, disability, and psychological distress to individuals that places a major socioeconomic burden on healthcare systems and government resources.1 It is a complex heterogeneous disorder culminating in mechanical and biological failure of the entire synovial joint as an organ.2
Current treatment methods are largely palliative, aiming to alleviate pain and improve function and quality of life. Arthroplasty surgery remains the most successful intervention available, but is performed for advanced disease refractory to nonoperative management. Despite its success, it is not without its risks, complications, and drawbacks.3 Joint-preserving interventions aimed at preventing progression of symptomatic early OA include high tibial osteotomy (HTO), focal resurfacing, and internal offloading devices. However, there is limited evidence to support their efficacy or determine the optimal timing of intervention to prevent OA progression. At present there are no disease-modifying drugs but the search for new biological targets continues.4
One of the major obstacles to the development of disease-modifying interventions has been the lack of reliable methods to diagnose, stage, and monitor pathological changes in the joint. There are numerous patient-reported outcome measures (PROMs) that can successfully monitor the clinical impact of OA. However, pain and loss of function are highly variable and multifactorial phenomena.5
Furthermore, there is often considerable discordance between symptoms and structural joint damage, thus PROMs are not reliable markers of joint pathology.6 Radiographs remain the current 'gold standard' for structural assessment, but are indirect, inaccurate, unreliable, and unresponsive measurements of cartilage thickness, which is unrepresentative of whole joint pathology.7,8 MRI is a rapidly evolving tool for whole joint structural assessment. Although MRI can detect knee OA with high specificity, the sensitivity of MRI is below clinical diagnostic standards.9 Therefore, its routine use for OA management in clinical practice has not been defined.
Given the lack of a suitable measurement, arthroplasty surgery is often used as an endpoint in the assessment of disease-modifying OA therapies. It is an easy dichotomous measure that signifies the failure of an intervention to prevent joint failure. However, the overall proportion of OA patients undergoing arthroplasty is small and influenced by multiple factors. These include factors related to the patient (i.e. age, sex, body mass index (BMI), comorbidities, ethnicity/culture, preferences, expectations, and socioeconomic status); the surgeon (i.e. preferences, experience, and technical ability); and the healthcare framework (i.e. access and provision of resources, geography, and treatment guidelines).10-14 Therefore, arthroplasty may not be a reliable surrogate for OA joint failure. A biological surrogate endpoint would be ideal but is currently lacking.
Biochemical biomarkers derived from biological fluids offer an alternative mode of assessing OA disease activity. Although the literature has produced many potential candidate OA biomarkers, none have been sufficiently validated or qualified to inform prognosis, monitor progression, or respond to therapeutic intervention. Most notable is the absence of a biological diagnostic assay to determine when a synovial joint is undergoing OA destructive change. Biomarker discovery has largely concentrated on biological fluids distant from the synovial joint, such as peripheral blood and urine. Although easy to collect, they inherently lack specificity for any particular joint, or even OA, and are severely vulnerable to systemic and pre-analytical variability.15 Synovial fluid (SF) undoubtedly best reflects the biological milieu of the joint, offering the most direct and specific measure of joint pathophysiology. This has recently been demonstrated in the context of prosthetic joint infection (PJI).16 Traditionally, studies have investigated single or only a small number of markers. OA comprises a complex myriad of pathological processes, and it is now generally accepted that a multi-marker approach comprising a profile of several combined biomarkers is likely to be more appropriate.17
We herein describe and demonstrate the accuracy of a conceptually novel biomarker method by combining multi-molecule SF analysis with a machine-learning approach. The resulting diagnostic biomarker is a potential surrogate endpoint for end-stage OA (esOA) with utility in biologically defining OA joint failure in the assessment of disease-modifying interventions.
Methods
Patient groups
The study was granted regional and institutional ethical approval and was conducted in full compliance with the Human Tissue Act (2004) and Declaration of Helsinki (2013). Consecutive patients who were due to undergo knee surgery under the care of the senior author (AP), as described below, were invited to participate in the study. Recruitment was over a period of one year. Patients who gave their written informed consent were recruited into the following groups for prospective SF analysis: esOA (patients with advanced clinical and radiological disease, refractory to nonoperative management, being treated by knee arthroplasty surgery); and non-OA knee injury (patients undergoing surgery for cruciate or meniscal injuries without clinical, radiological (radiological and MRI), or arthroscopic evidence of degenerative changes or chondral injury; the median interval between injury and surgery was 6.5 months (interquartile range (IQR) 4 to 9.75).
Patients were excluded if there was a history of: rheumatoid or other inflammatory arthritis (in any joint); septic arthritis; post-traumatic OA; previous meniscal or cruciate injury with or without surgical intervention; previous arthroscopic surgery, high-tibial osteotomy, or arthroplasty (partial or total) in the index joint; systemic or intra-articular glucocorticoid within six weeks of sample collection; or intra-articular viscosupplementation within six weeks of sample collection. In addition to the above, patients were excluded from the injury group if there was a history of clinical symptoms of OA in any joint system.
The inflammatory cohort comprised patients with rheumatoid or psoriatic arthritis affecting the knee joint on a range of anti-inflammatory and/or disease-modifying treatments (Supplementary Table i). SF samples were collected during a previous study (unpublished).
Synovial fluid samples
SF from OA patients was obtained by needle aspiration after superficial dissection, but prior to arthrotomy to avoid contam`ination with blood. For injury patients, SF was needle-aspirated after skin preparation, but prior to any surgical incisions. All samples were collected during the use of a high-thigh tourniquet. Any macroscopically blood-tinged samples were discarded, and the patient excluded from the study. Lavage samples were not taken because of potentially variable and uncontrolled dilution that would make comparisons unreliable.
Samples were placed in sterile specimen pots and stored immediately at 4°C pending processing within four hours. SF was centrifuged at 3,000 g for 25 minutes at 4°C to separate solid debris and cells. The supernatant was then aliquoted into 500 μl microfuge tubes, snap-frozen in liquid nitrogen, and stored at -80°C until analysis.
Prior to analysis, aliquots were thawed at room temperature and clarified at 10,000 g force for ten minutes. The supernatant was treated with 2 mg/ml bovine testicular hyaluronidase (type I-S, 618.4 U/mg; Sigma-Aldrich, St. Louis, Missouri, USA). This entailed 1:1 volume mixture of SF with 4 mg/ml hyaluronidase, vortexing for five seconds, and incubation at room temperature for one hour on a shaker. Samples were centrifuged at 1,000 g for five minutes and the supernatant used for the assay. The end result was two-fold sample dilution with 2 mg/ml (approximately 1,200 U/ml) hyaluronidase. Hyaluronidase treatment can improve intra-assay precision and assay signal of SF analysis by multiplex immunoassays.18
Wide-spectrum immunoassay analysis
SF samples were analyzed for 35 candidate biomarkers that were chosen from cytokines, chemokines, growth factors, matrix enzymes, and markers of cartilage turnover with previously reported or potential relevance to OA pathophysiology (Table I). This biological panel was not intended to be definitive or exhaustive.
Table I.
Biological panel for wide-spectrum synovial fluid analysis.
| Mediator group | Candidate biomarkers |
|---|---|
| Pro-inflammatory cytokines | IL-1β, TNF-α, IL-6, IL-8, IL-2, IL-12, IL-15, GM-CSF |
| Regulatory cytokines | IL-1Ra, IL-4, IL-10, IL-2R |
| Chemokines | RANTES, MIP-1α, MIP-1β, MCP-1, IP-10, Eotaxin, MIG |
| Growth factors | TGF-β1*, TGF-β2*, TGF-β3*, BMP-2, BMP-7 |
| Matrix enzymes* | MMP-1, MMP-3, MMP-9, MMP-13, TIMP-1, ADAMTS-4 |
| Cartilage turnover | ARGS neo-epitope, COMP, PIIANP |
| Others (bone) | LIGHT, DcR3 |
-
*
Assays for transforming growth factor beta isoforms and matrix enzymes measured total levels, and not active levels.
-
ADAMTS-4, a disintegrin-like and metalloproteinase with thrombospondin motifs-4; ARGS, 374-alanine-arginine-glycine-serine neoepitope of aggrecan; BMP, bone morphogenetic protein; COMP, cartilage oligomeric matrix protein; DcR3, decoy receptor 3; GM-CSF, granulocyte macrophage-colony stimulating factor; IL, interleukin; IP-10, interferon γ-induced protein 10 kDa; LIGHT, homologous to lymphotoxin, exhibits inducible expression and competes with HSV glycoprotein D for herpesvirus entry mediator, a receptor expressed on T cells; MCP, monocyte chemoattractant protein; MIG, monokine induced by gamma interferon; MIP, macrophage inflammatory proteinMMP, matrix metalloproteinase; PIIANP, type IIA procollagen N-terminal propeptide; RANTES, Regulated on Activation, Normal T Expressed and Secreted; TGF-β, transforming growth factor beta; TIMP, tissue inhibitor of metalloproteinases; TNF-α, tumour-necrosis factor-alpha.
Wide-spectrum SF analysis was conducted using a combination of Luminex, MesoScale Discovery (MSD), and enzyme-linked immunosorbent (ELISA) assays (Supplementary Table ii). Commercially sourced immunoassays were conducted according to the manufacturers’ protocol. Custom MSD assays were performed using optimized in-house protocols following MSD guidelines and MSD recommended reagents. The same platform, assay kit, reagents, lot numbers, and protocols were used for each marker throughout the study to analyze all samples. On all platforms, calibrators and blanks were measured in duplicate. SF aliquots were run in duplicate for all assays except polystyrene-bead Luminex assays, where they were run in triplicate.
Immunoassay data underwent stringent quality control (detailed in Supplementary Methods). For a marker to qualify for quantitative analysis, measurements had to fulfil the following criteria: at least 50% of samples in each cohort were required to be above lower limit of quantification, and at least 75% of quantifiable samples in each cohort were required to have acceptable intra-assay precision. The β-substitution method was used to handle any (left) censored data for quantifiable markers.19 The β-substitution procedure was conducted separately for patient cohorts, which were treated as distinct data arrays.
Statistical analysis
Marker concentrations were natural logarithm-transformed, (mean) centred, and scaled to unit variance.20 Supervised classification by partial least squares discriminant analysis (PLS-DA) was conducted to distinguish between patient cohorts on the basis of SF measurements.21
PLS-DA was implemented with the non-linear iterative partial least squares (NIPALS) algorithm. Prediction models were developed with the study cohort as the categorical dependent outcome variable and the SF analytes as the predictor variables. R2 was used to estimate goodness of model fit. Internal validation using cross-validation was conducted to generate a Q2 value as an estimate of the model's predictive quality. A total of seven rounds of cross-validation were conducted and a Q2 > 0.5 was considered acceptable.22 Low R2 and/or Q2 values indicate that the relationship between the outcome and the predictors is poor or there is significant noise in the data. The number of latent projections (components) used in the model was determined by the compromise between optimum R2 and Q2 values, i.e. the model was stopped at maximum cumulative Q2 value. Observation score plots were produced to visually assess cohort class separation. Variable loading weights bi-plots were produced to display the relationship between analytes and cohorts. Analytes (predictors) in the vicinity of a dummy cohort (outcome) have the greatest discriminating power.
Data processing, principal component analysis (PCA), and PLS-DA were implemented in SIMCA-P ver. 14.1 (Umetrics, Umeå, Sweden). Coefficient heat maps were created using Multiple Experiment Viewer Ver. 4.8.1 (TM4 Software Suite, The Institute for Genomic Research, Rockville, Maryland, USA).
Model diagnostics
Model significance testing was achieved using cross-validated residuals analysis of variance (CV-ANOVA) methodology.23 Response permutation was used to assess whether the model’s predictive power was spurious. The distributions of standardized PLS-regression residuals were assessed for normality. Further details of model diagnostics are available in the Supplementary Methods. Sensitivity analyses were carried out, adjusting for age and stratifying by sex to exclude these as confounding factors.
Model performance
A confusion matrix was constructed to assess PLS-DA models by comparing actual cohort membership to the predicted cohort following internal cross-validation. Model sensitivity, specificity, and reliability was calculated for each study cohort. Sensitivity refers to the number of patients predicted correctly as a percentage of the total number of patients actually in the cohort. Specificity refers to the percentage of patients correctly classified as not belonging to a particular cohort. Reliability (or precision) refers to the number of patients predicted correctly as a percentage of the total number of patients predicted to be in the cohort, i.e. positive predictive value (PPV). The overall accuracy of the model was given by the total number of patients correctly classified (i.e. true positives) as a percentage of the total number of patients. The mean sensitivity, specificity, and reliability were calculated for each model. Receiver operating characteristic (ROC) curves were produced and area under the ROC curve (AUC) calculated to assess the diagnostic performance of the models.
SF marker importance
The variable influence on projection (VIP) parameter (with jack-knifed 95% confidence intervals (CIs)) is a measure of how much each predictor variable (SF marker) contributes to the overall PLS-DA model. This includes both its importance to class separation (outcome) and its importance to modelling the latent structure of predictor variables, i.e. components. Markers with a VIP > 0.8 were considered important for the overall model, VIP between 0.8 and 0.5 considered potentially important, and VIP < 0.5 considered unimportant.22
The importance of a given predictor variable for the outcome is proportional to its distance from the origin in the loading space (loading weight bi-plot). These lengths correspond to the PLS regression coefficients, which were therefore used to determine how strongly a marker is associated with a cohort. A coefficient is statistically significant if its (jack-knifed) 95% CI does not include zero. The 'biological fingerprint' of each cohort was defined by its combination of markers with significant PLS regression coefficients. Markers associated with a cohort (i.e. significant positive coefficient) were termed 'positive discriminators' of the fingerprint; those opposing a cohort (i.e. significant negative coefficient) were termed 'negative discriminators'.
Streamlined model
The PLS-DA process was repeated to obtain a streamlined model with the most parsimonious combination of quantitative SF markers for class discrimination. An iterative approach was used to obtain the greatest R2 and Q2 values with the least number of quantitative markers that all had a VIP > 0.5.
Model validation
The data used to generate the PLS-DA models are known as the 'training set'. Identical wide-spectrum SF analysis of new patients was used as 'test set' data to validate the PLS-DA models. The models are blinded to the cohort membership of new patients and assessed for their ability to correctly classify them. The predictive performance is assessed as described above. The ability to diagnose esOA was validated using ten patients with esOA who were used as a test cohort.
Results
SF was analyzed from 60 patients with esOA and 20 patients with non-OA knee injury. SF samples from 18 patients with inflammatory (rheumatoid or psoriatic) arthritis were obtained from a previous study. A summary of the clinical and radiological characteristics of patients with esOA, knee injury, and inflammatory arthritis are presented in Supplementary Results and Supplementary Table iii.
Wide-spectrum immunoassay analysis
In all, 20 markers were sufficiently quantifiable in all training cohorts with satisfactory intra-assay precision to qualify for further quantitative analysis: five pro-inflammatory cytokines (tumour-necrosis factor-alpha (TNF-α), interleukin (IL)-6, IL-8, IL-12, and IL-15); three chemokines (monocyte chemoattractant protein (MCP)-1, IP-10, and Eotaxin), three isoforms of transforming growth factor beta (TGF-β), five matrix enzymes (matrix metalloproteinase (MMP)-1, MMP-3, MMP-9, tissue inhibitor of metalloproteinase (TIMP)-1 and a disintegrin and metalloproteinase with thrombospondin motifs 4 (ADAMTS-4)); three markers of cartilage metabolism (374-alanine-arginine-glycine-serine (ARGS) neoepitope, cartilage oligomeric matrix protein (COMP), and type IIA procollagen N-terminal propeptide (PIIANP)); and decoy receptor 3 (DcR3). The standardized median marker concentrations by cohort are presented as a heat map in Supplementary Figure a. The proportions of quantifiable SF samples in each cohort for markers that did not qualify for further analysis are presented in Supplementary Table iv.
Predictive modelling using multivariate analysis
PLS-DA using the 20 quantitative markers produced good class separation between the three study cohorts (Figure 1a). A three-component model explained 77.0% (R2 = 0.770) of the variability between patient groups with a predictive quality of 71.8% (Q2 = 0.718).
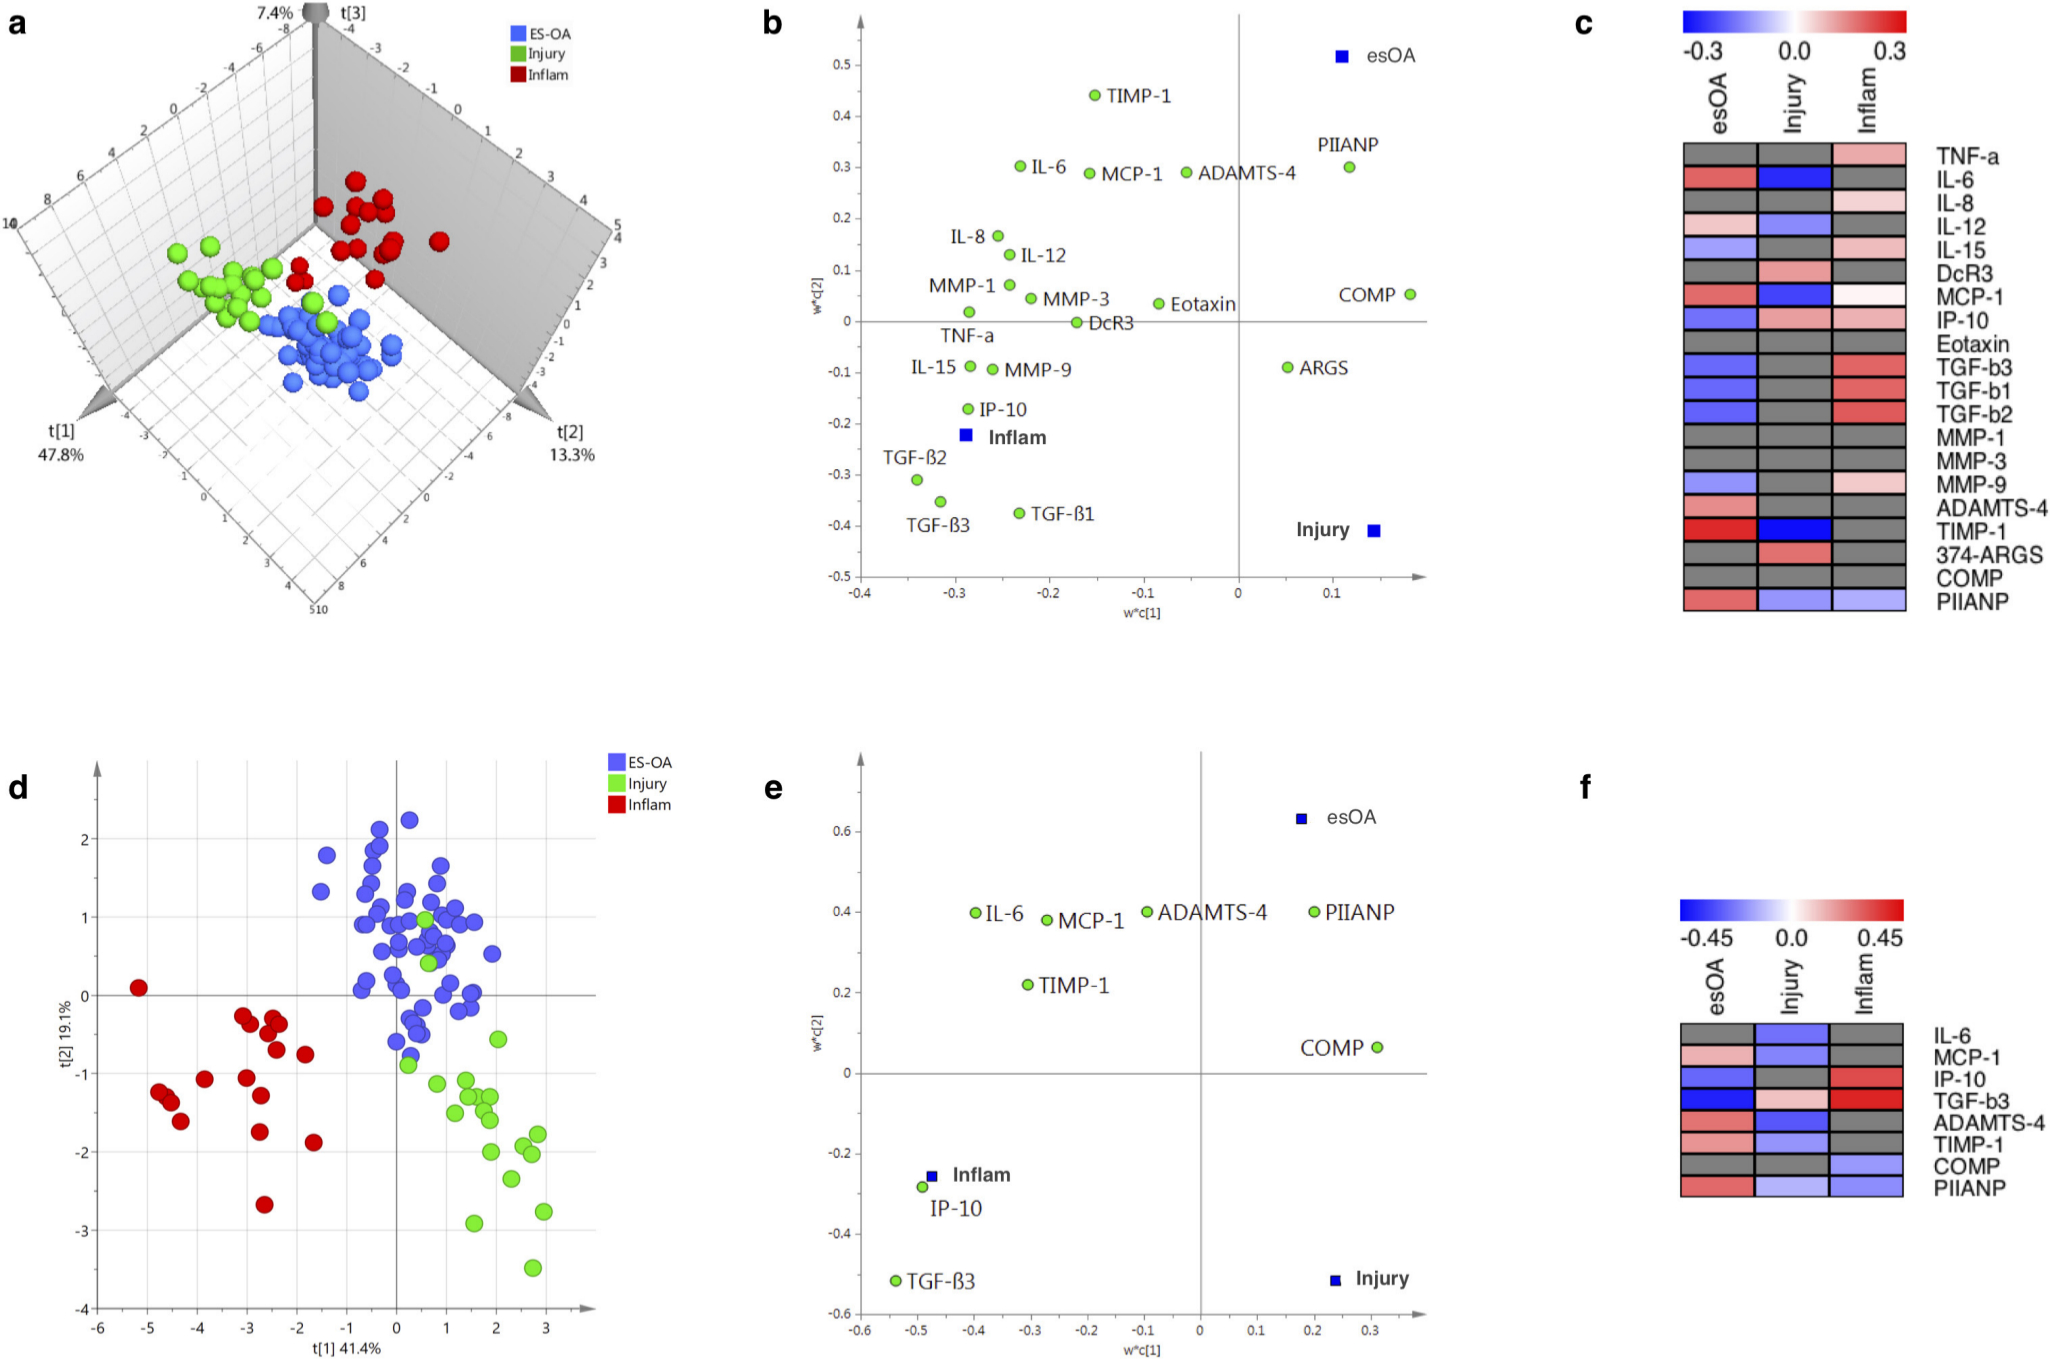
Fig. 1
a) to c) Full partial least square discriminant analysis (PLS-DA) models using 20 synovial fluid (SF) markers. Three-component model: R2 = 0.770; Q2 = 0.718. d) to f) Streamlined PLS-DA models using eight SF markers. Two-component model: R2 = 0.694; Q2 = 0.673. a) and d) Observation score plot providing a visual assessment of patient class separation. b) and e) Variable loading bi-plot displaying the relationship between markers and patient cohorts. Markers (X-variables) in the vicinity of a dummy cohort (Y-variable) have the greatest discriminating power. c) and f) Variable regression coefficient plots: distances from the origin on the variable loading bi-plot correspond to the PLS regression coefficients, which are used to determine how strongly a marker is associated with a cohort. Grey boxes denote markers with non-significant regression coefficients whose 95% confidence intervals span zero. 'Injury' refers to non-osteoarthritis knee injury. ADAMTS-4, a disintegrin and metalloproteinase with thrombospondin motifs 4; ARGS, alanine-arginine-glycine-serine; COMP, cartilage oligomeric matrix protein; DcR3, decoy receptor; esOA, end-stage knee osteoarthritis; IL, interleukin; Inflam, inflammatory arthritis; IP-10, interferon γ-induced protein 10 kDa; MCP, monocyte chemoattractant protein; MMP, matrix metalloproteinase; PIIANP, type IIA procollagen N-terminal propeptide; TGF, transforming growth factor; TIMP, tissue inhibitor of metalloproteinase; TNF-α, tumour-necrosis factor-alpha.
The confusion matrix comparing actual cohort to predicted cohort is presented in Table II. Only two patients with knee injury were misclassified as esOA; both had anterior cruciate ligament (ACL) injury plus meniscal tear. The model had excellent sensitivity, specificity, and reliability that were all > 95% (Tables II and III). ROC analysis demonstrates near-perfect discriminatory accuracy of the model: AUC being 1 for inflammatory arthritis, 0.997 for knee injury, and 0.989 for esOA (Figure 2a).
Table II.
Confusion matrix for partial least square discriminant analysis (PLS-DA) model using 20 quantitative synovial fluid markers (three-component model; R2 = 0.770; Q2 = 0.718). Actual patient cohort is compared to predicted cohort. Overall accuracy (= 98%). See 'Methods' for definitions of parameters.
| Predicted | ||||||
|---|---|---|---|---|---|---|
| esOA | Injury | Inflam | NC | Total ACT | ||
| Actual | esOA | 60 | 0 | 0 | 0 | 60 |
| Injury | 2 | 18 | 0 | 0 | 20 | |
| Inflam | 0 | 0 | 18 | 0 | 18 | |
| NC | 0 | 0 | 0 | 0 | 0 | |
| Total PRED | 62 | 18 | 18 | 0 | ||
-
*
Non-osteoarthritis-related injury.
-
esOA, end-stage knee osteoarthritis; Inflam, inflammatory arthritis; NC, no classification.
Table III.
Model performance for each study cohort.
| Model parameter | esOA | Injury* | Inflam | Model average† |
|---|---|---|---|---|
| Sensitivity, % | 100 | 90 | 100 | 96.7 |
| Specificity, % | 94.7 | 100 | 100 | 98.2 |
| Reliability, % | 96.8 | 100 | 100 | 98.9 |
-
*
Non-osteoarthritis-related injury.
-
†
Mean of three preceding values.
-
esOA, end-stage knee osteoarthritis; Inflam, inflammatory arthritis.
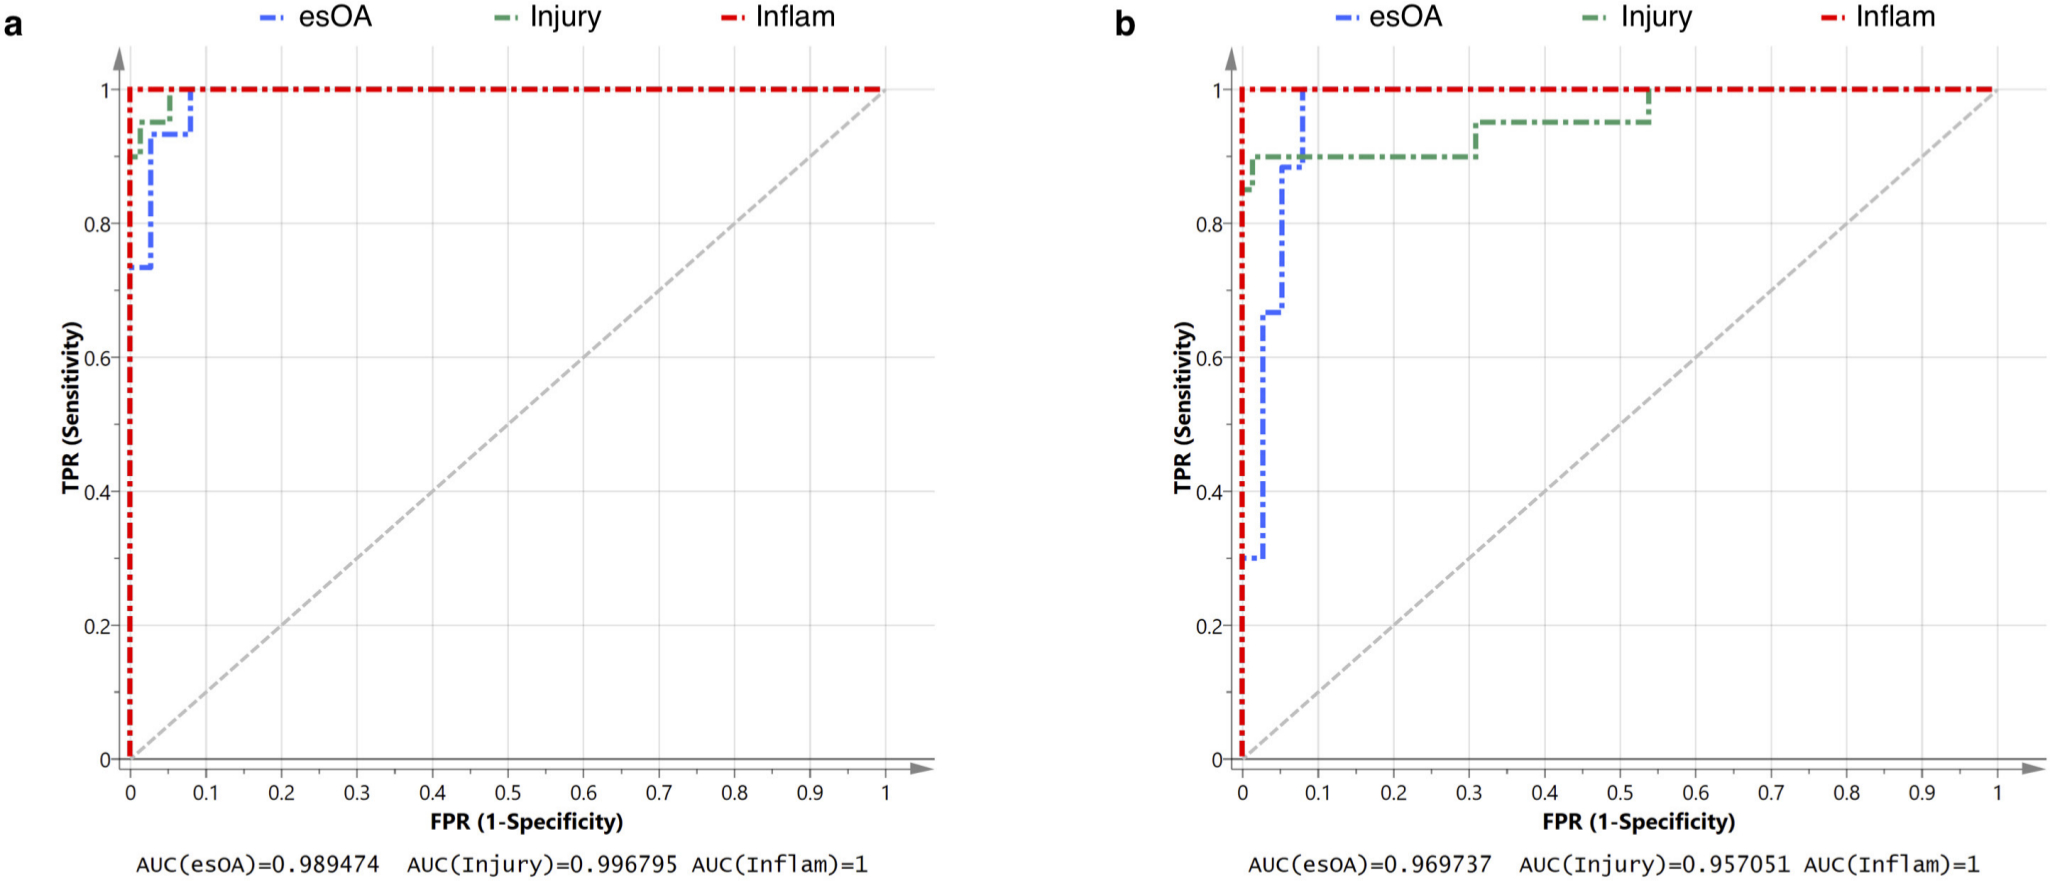
Fig. 2
Receiver operating curve (ROC) analysis of diagnostic performance. a) Full model using 20 synovial fluid (SF) markers. b) Streamlined model using eight SF markers. The area under the curve (AUC) as a measure of the diagnostic accuracy for patient cohort is presented. True positive rate (TPR) is equivalent to sensitivity. False positive rate (FPR) is equivalent to (1-specificity). 'Injury' refers to a non-osteoarthritic knee injury. esOA, end-stage knee osteoarthritis; Inflam, inflammatory arthritis.
All quantitative markers were important (VIP > 0.8) for the overall model except DcR3, COMP, and 374-ARGS, which were potentially important (0.5 < VIP < 0.8), and eotaxin, which was not important (VIP < 0.5) (Supplementary Results and Supplementary Figure aa).
The loading bi-plot (Figure 1b) suggests PIIANP has a strong positive discriminatory function for esOA. TIMP-1, ADAMTS-4, MCP-1, and IL-6 also loaded towards esOA. The majority of markers discriminated against knee injury except 374-ARGS, which loads in the direction of knee injury patients. Using the significant PLS regression coefficients, the fingerprint for esOA was characterized by positive discriminators TIMP-1, IL-6, PIIANP, MCP-1, ADAMTS-4, and IL-12 in combination with negative discriminators TGF-β isoforms, IP-10, IL-15, and MMP-9 (Figure 1c).
Streamlined model
The optimum streamlined PLS-DA model used eight quantitative SF markers: inflammatory cytokine IL-6; chemokines MCP-1 and IP-10; TGF-β3; aggrecanase ADAMTS-4; metalloproteinase inhibitor TIMP-1; and cartilage metabolism markers PIIANP and COMP. Good class separation was achieved with a two-component model that explained 69.4% (R2 = 0.694) of the variability between patient groups with a predictive quality of 67.3% (Q2 = 0.673) (Figure 1d). The streamlined model also had excellent sensitivity, specificity, and reliability and with only three knee injury patients being misclassified as esOA (Table IV). All three misclassified injury patients had ACL injury plus meniscal tear. The model had excellent sensitivity, specificity, and reliability that were all > 95% (Table V). ROC analysis demonstrates excellent discriminatory accuracy of the model: AUC being 0.970 for esOA, 0.957 for knee injury, and 1 for inflammatory arthritis (Figure 2b).
Table IV.
Confusion matrix for streamlined partial least square discriminant analysis (PLS-DA) model using eight quantitative synovial fluid markers (two-component model; R2 = 0.694; Q2 = 0.673). Actual patient cohort is compared to predicted cohort. Overall accuracy = 96.9%. See 'Methods' for definitions of parameters.
| Predicted | ||||||
|---|---|---|---|---|---|---|
| esOA | Injury* | Inflam | NC | TotalACT | ||
| Actual | esOA | 60 | 0 | 0 | 0 | 60 |
| Injury* | 3 | 17 | 0 | 0 | 20 | |
| Inflam | 0 | 0 | 18 | 0 | 18 | |
| NC | 0 | 0 | 0 | 0 | 0 | |
| Total PRED | 63 | 17 | 18 | 0 | ||
-
*
Non-osteoarthritis-related knee injury.
-
esOA, end-stage knee osteoarthritis; Inflam, inflammatory arthritis; NC, no classification.
Table V.
Model performance for each study cohort.
| Model parameter | esOA | Injury* | Inflam | Model average† |
|---|---|---|---|---|
| Sensitivity, % | 100 | 90 | 100 | 96.7 |
| Specificity, % | 94.7 | 100 | 100 | 98.2 |
| Reliability, % | 96.8 | 100 | 100 | 98.9 |
-
*
Non-osteoarthritis-related knee injury.
-
†
Mean of three preceding values.
-
esOA, end-stage knee osteoarthritis; Inflam, inflammatory arthritis.
The loading bi-plot shows that PIIANP discriminates best for esOA and most markers discriminate against knee injury (Figure 1e). TIMP-1 and ADAMTS-4 also load favourably towards esOA. The VIP scores for all eight markers in the streamlined model were important (TGF-β3, TIMP-1, IL-6, IP-10, MCP-1, and PIIANP) or potentially important (ADAMTS-4 and COMP) (Supplementary Results and Supplementary Figure bb). The fingerprint for esOA comprised positive discriminators PIIANP, TIMP-1, ADAMTS-4, and MCP-1 in combination with negative discriminators of IP-10 and TGF-β3 (Figure 1f).
Model diagnostics
Both full (F = 29.15; p = 3.24 × 10-36) and streamlined (F = 35.57; p = 1.5 × 10⁻³³) models were highly significant when tested by the CV-ANOVA method. The standardized residual distributions for both models were generally normal and response permutation testing also suggested model validity (Supplementary Results and Supplementary Figures c and d). Sensitivity analyses, including an adjustment for age, showed no noticeable differences by sex.
Model validation
The ability of the biomarker models to diagnose esOA was tested using ten patients with esOA. All test patients were female, but there was no significant difference in other clinical or radiological parameters compared to training set patients with esOA (Supplementary Table v). All ten validation test patients were classified correctly as esOA (accuracy 100%; reliability 100%) by both the full and streamlined PLS-DA biomarker models.
Discussion
This study describes a novel, pattern recognition approach for deriving a SF biomarker fingerprint for diagnosis of esOA from a panel of physiologically relevant cytokines, chemokines, growth factors, matrix enzymes, and markers of cartilage turnover. This potentially provides a missing biological test for advanced OA. Machine learning using PLS-DA generated an esOA fingerprint comprising positive discriminators of TIMP-1, IL-6, PIIANP, MCP-1, ADAMTS-4, and IL-12 with negative discriminators of TGF-β isoforms, IP-10, IL-15, and MMP-9. This was streamlined to an eight-marker model comprising positive discriminators of PIIANP, TIMP-1, ADAMTS-4, and MCP-1 with negative discriminators of IP-10 and TGF-β3. Both full and streamlined models had R2 (goodness-of-fit) and Q2 (predictive quality) parameters ∼ 0.7, which is excellent for a biological system. Both models achieved excellent (> 95%) diagnostic sensitivity, specificity, and reliability, and were successfully validated with new esOA test samples.
Biological validation of the individual molecules contributing to the biomarker models is detailed in the Supplementary Discussion. However, the mediators described were restricted by assay availability and should not be considered a definitive list. This work redefines and extends the concept of a biomarker to include multivariate models. Conceptually, the biological fingerprint for esOA in this study is not a biomarker in the traditional sense. The measurement of markers within the defined fingerprints have limited utility on their own. There are no concentration reference ranges or cut-offs. The biomarker is the predictive multivariate model including existing patient (training) data, which together can be considered a calibrated instrument. It is analogous to facial or fingerprint recognition algorithms, and is the first such pattern recognition approach in OA biomarker discovery.
The inclusion of patients with knee injury and inflammatory arthritis offers internal (construct) validity to SF measurements in the absence of normal control samples, and provides a biological contrast to OA from other knee joint pathologies. With a few exceptions,24 most OA biomarker studies use a single non-OA control cohort. This is usually a cohort of 'normal' patients in studies using peripheral biofluids, or patients with knee injury in SF studies. Many putative OA biomarkers may also be indicators of synovitis and inflammation common to OA and inflammatory arthritis. The use of PLS-DA analysis with inclusion of two non-OA comparator groups, one on either side of the OA disease spectrum, greatly increased the specificity of potential biomarkers and boosted the statistical power of analysis of relatively few (approximately 100) patients permitting 100% accuracy and 95% reliability of esOA diagnosis with only eight markers.
The described OA fingerprint model has the required attributes to qualify as a surrogate endpoint in OA trials to signify treatment failure, although this would require further rigorous biomarker qualification. The terminal joint failure of esOA represents a convergence of clinical and structural endpoints. Arthroplasty surgery is often considered the 'ultimate' clinical endpoint for knee OA and is itself a surrogate for esOA. However, not all patients with esOA will actually undergo arthroplasty as this clinical decision is influenced by numerous confounding factors. Furthermore, the natural history of OA can be prolonged and arthroplasty can be a distant endpoint for patients with early OA who are potentially receptive to disease modification. Consequently, the utility of arthroplasty surgery as an endpoint for disease-modifying treatment development is limited and trials would be large and lengthy.25 There has been a largely unsuccessful initiative to define a 'virtual joint arthroplasty' as a surrogate endpoint for trials to eliminate many of the biases associated with arthroplasty while maintaining its easy, dichotomous, OA-specific outcome.12,26 Consequently, our diagnostic esOA model would be of interest to the pharmaceutical industry to conduct smaller, shorter, and more ethically favourable studies.
Given the clinical and radiological measures indicative of esOA, the current biomarker model might be considered redundant as a clinical tool. However, it provides a biological diagnosis that has been thus far unavailable. The biomarker fingerprint would, therefore, be a useful adjunct to current methods of diagnosis and staging to guide patient management and assess current treatment methods, especially in situations of clinical equipoise. Follow-up studies in longitudinal cohorts will demonstrate the sensitivity of the panel for detecting esOA ahead of current imaging methods and its use in experimental interventions such as unloading will demonstrate if the biological end-stage defined here is reversible. Either outcome would provide a considerable advance in clinical decision-making and patient stratification.
The observation score plots of the PLS-DA models demonstrated strong separation of the inflammatory group from both knee injury and esOA groups, between which class separation was distinct but less clean. Two knee injury patients were misclassified as esOA in the full model and both were also misclassified in the streamlined model in addition to a third knee injury patient. Patients with knee injuries had no radiological (radiological and MRI) or arthroscopic evidence of OA. However, this was a heterogeneous group including isolated meniscal injury and ACL injury with or without meniscal injury, and the three misclassified patients had ACL injury with meniscal tear. The relative proximity of knee injury patients to those with esOA suggests that these groups may lie on a biological continuum. A persistent abnormal SF biology associated with molecular and premacroscopic OA changes may characterize injury patients as a high-risk/pre-OA cohort. There is strong evidence that such injuries are a very important risk factor for OA and Lohmander et al27 have described these as "the young patient with an old knee".27,28
One could speculate that the fingerprint model detects OA, and is not specific to terminal joint failure. This would preclude surrogate endpoint status, but could potentially be more useful for development and assessment of disease-modifying therapies such as surgical joint realignment as well as pharmaceuticals. It is not known exactly when the current OA fingerprint first appears along the continuum from normal joint to joint death. Serial longitudinal analysis of large well-characterized cohorts with associated clinical, radiological, and other biological measurements will be the gold standard approach to answering this question. An alternative short-term solution is the cross-sectional biomarker analysis of well-characterized patient cohorts at sequentially earlier stages of clinical and structural disease, including normal asymptomatic patients.24 The invasive nature of sample collection and potential low-volume yields would remain an obvious challenge. Such work would reveal biomarker fingerprints for the earlier OA disease stages and normal joints, which would have far-reaching implications for the development of disease-modifying therapies. If successful it may be possible to use the biomarker fingerprints as part of the set of indications for intervention, therefore guiding surgical decision-making.
There are a number of limitations to this study. Like most human SF studies, the numbers of patients are relatively small, especially in the reference groups, due to the comparatively invasive nature of SF sampling. It was not possible to obtain normal control SF despite adequate patient recruitment and ultrasound-guided methods. This is an ongoing obstacle for biomarker discovery since the truly normal knee and even early symptomatic OA often do not have sufficient effusion accessible without lavage. Although the biomarker models correctly diagnosed ten patients with esOA, this can only be considered partial validation. Full validation requires samples from patients with knee injury and inflammatory arthritis, and additional esOA patients. Both the knee injury and inflammatory arthritis cohorts represent heterogeneous groups of patients. This was a deliberate choice to assess whether the approach would pull out only the most widely and consistently different markers. Knee injury patients were sampled at variable intervals (four to nine months) after their index injury but there were no significant correlations between interval and marker concentrations. There was limited clinical and structural information available for the inflammatory cohort of patients with rheumatoid or psoriatic arthritis. In particular, the existence of OA secondary to inflammatory arthritis was not excluded. The study had very stringent inclusion and exclusion criteria for OA cohort membership, but the potential confounding effects of medications were not considered. In particular, knee injury patients may not have been on many (or any) medications, whereas esOA patients were likely to be taking a combination of paracetamol, nonsteroidal anti-inflammatory drugs (NSAIDs), and opioids, and patients with inflammatory arthritis were taking corticosteroids and/or disease-modifying drugs potentially in addition to analgesia. However, the multivariate approach was robust to the heterogeneity of the comparator groups. The choice of markers was guided by potential relevance to OA in the literature, but also by pragmatic availability of assays. Although we do not claim the panel is definitive or exhaustive, it does introduce an inherent source of reporting bias.
This study challenges the existing paradigm in OA biomarker discovery and highlights the need to reconsider and extend the concept of a biomarker to include multivariate approaches. SF analysis coupled with machine-learning produced and (partially) validated biomarker models with cohort-specific fingerprints that accurately and reliably discriminated esOA from knee injury and inflammatory arthritis with almost 100% efficacy. The presented findings and approach represent a new biomarker concept, and a potential diagnostic tool to complement existing esOA diagnostic criteria, define inclusion/exclusion criteria for therapy trails, and monitor the efficacy of such interventions.
References
1. Vos T , Flaxman AD , Naghavi M , et al. Years lived with disability (YLDs) for 1160 sequelae of 289 diseases and injuries 1990-2010: a systematic analysis for the global burden of disease study 2010 . Lancet . 2012 ; 380 ( 9859 ): 2163 – 2196 Crossref PubMed Google Scholar
2. Loeser RF , Goldring SR , Scanzello CR , Goldring MB . Osteoarthritis: a disease of the joint as an organ . Arthritis Rheum . 2012 ; 64 ( 6 ): 1697 – 1707 . Crossref PubMed Google Scholar
3. Carr AJ , Robertsson O , Graves S , et al. Knee replacement . Lancet . 2012 ; 379 ( 9823 ): 1331 – 1340 Crossref PubMed Google Scholar
4. Chevalier X , Eymard F , Richette P . Biologic agents in osteoarthritis: hopes and disappointments . Nat Rev Rheumatol . 2013 ; 9 ( 7 ): 400 – 410 . Crossref PubMed Google Scholar
5. Gwilym SE , Pollard TCB , Carr AJ . Understanding pain in osteoarthritis . J Bone Joint Surg Br . 2008 ; 90-B ( 3 ): 280 – 287 . Crossref PubMed Google Scholar
6. Bedson J , Croft PR . The discordance between clinical and radiographic knee osteoarthritis: a systematic search and summary of the literature . BMC Musculoskelet Disord . 2008 ; 9 : 116 . Crossref PubMed Google Scholar
7. Conaghan PG , Hunter DJ , Maillefert JF , Reichmann WM , Losina E . Summary and recommendations of the OARSI FDA osteoarthritis assessment of structural change Working group . Osteoarthritis Cartilage . 2011 ; 19 ( 5 ): 606 – 610 . Crossref PubMed Google Scholar
8. Guermazi A , Roemer FW , Burstein D , Hayashi D . Why radiography should no longer be considered a surrogate outcome measure for longitudinal assessment of cartilage in knee osteoarthritis . Arthritis Res Ther . 2011 ; 13 ( 6 ): 247 . Crossref PubMed Google Scholar
9. Menashe L , Hirko K , Losina E , et al. The diagnostic performance of MRI in osteoarthritis: a systematic review and meta-analysis . Osteoarthritis Cartilage . 2012 ; 20 ( 1 ): 13 – 21 . Crossref PubMed Google Scholar
10. Gossec L , Paternotte S , Maillefert JF , et al. The role of pain and functional impairment in the decision to recommend total joint replacement in hip and knee osteoarthritis: an international cross-sectional study of 1909 patients. Report of the OARSI-OMERACT Task Force on total joint replacement . Osteoarthritis Cartilage . 2011 ; 19 ( 2 ): 147 – 154 . Crossref PubMed Google Scholar
11. Jayadev C , Khan T , Coulter A , Beard DJ , Price AJ . Patient decision AIDS in knee replacement surgery . Knee . 2012 ; 19 ( 6 ): 746 – 750 . Crossref PubMed Google Scholar
12. Manno RL , Bingham CO , Paternotte S , et al. OARSI-OMERACT initiative: defining thresholds for symptomatic severity and structural changes in disease modifying osteoarthritis drug (DMOAD) clinical trials . Osteoarthritis Cartilage . 2012 ; 20 ( 2 ): 93 – 101 . Crossref PubMed Google Scholar
13. Pelletier J-P , Cooper C , Peterfy C , et al. What is the predictive value of MRI for the occurrence of knee replacement surgery in knee osteoarthritis? Ann Rheum Dis . 2013 ; 72 ( 10 ): 1594 – 1604 . Crossref PubMed Google Scholar
14. Mota REM , Tarricone R , Ciani O , Bridges JFP , Drummond M . Determinants of demand for total hip and knee arthroplasty: a systematic literature review . BMC Health Serv Res . 2012 ; 12: 225. Crossref PubMed Google Scholar
15. Simkin PA , Bassett JE . Cartilage matrix molecules in serum and synovial fluid . Curr Opin Rheumatol . 1995 ; 7 ( 4 ): 346 – 351 . Crossref PubMed Google Scholar
16. Chen M-F , Chang C-H , Yang L-Y , et al. Synovial fluid interleukin-16, interleukin-18, and CRELD2 as novel biomarkers of prosthetic joint infections . Bone Joint Res . 2019 ; 8 ( 4 ): 179 – 188 . Crossref PubMed Google Scholar
17. Williams FMK . Biomarkers: in combination they may do better . Arthritis Res Ther . 2009 ; 11 ( 5 ): 130 . Crossref PubMed Google Scholar
18. Jayadev C , Rout R , Price A , Hulley P , Mahoney D . Hyaluronidase treatment of synovial fluid to improve assay precision for biomarker research using multiplex immunoassay platforms . J Immunol Methods . 2012 ; 386 ( 1-2 ): 22 – 30 . Crossref PubMed Google Scholar
19. Ganser GH , Hewett P . An accurate substitution method for analyzing censored data . J Occup Environ Hyg . 2010 ; 7 ( 4 ): 233 – 244 . Crossref PubMed Google Scholar
20. van den Berg RA , Hoefsloot HCJ , Westerhuis JA , Smilde AK , van der Werf MJ . Centering, scaling, and transformations: improving the biological information content of metabolomics data . BMC Genomics . 2006 ; 7 : 142 . Crossref PubMed Google Scholar
21. Wold S , Sjöström M , Eriksson L . PLS-regression: a basic tool of chemometrics . Chemometrics and Intelligent Laboratory Systems . 2001 ; 58 ( 2 ): 109 – 130 . Google Scholar
22. Eriksson L , Byrne T , Johansson E , Trygg J , Vikström C . PLS . In : Eriksson L , Byrne T , Johansson E , Trygg J , Vikström C, eds . Multi- and Megavariate data analysis: basic principles and applications . 3rd ed . Malmö : Umetrics Academy , 2013 : 55 – 88 . Google Scholar
23. Eriksson L , Trygg J , Wold S . CV-ANOVA for significance testing of PLS and OPLS® models . J. Chemometrics . 2008 ; 22 ( 11-12 ): 594 – 600 . Google Scholar
24. Yin C-M , Suen W-C-W , Lin S , Wu XM , Li G , Pan XH . Dysregulation of both miR-140-3p and miR-140-5p in synovial fluid correlate with osteoarthritis severity . Bone Joint Res . 2017 ; 6 ( 11 ): 612 – 618 . Crossref PubMed Google Scholar
25. Altman RD , Abadie E , Avouac B , et al. Total joint replacement of hip or knee as an outcome measure for structure modifying trials in osteoarthritis . Osteoarthritis Cartilage . 2005 ; 13 ( 1 ): 13 – 19 . Google Scholar
26. Felson DT . Osteoarthritis: Virtual joint replacement as an outcome measure in OA . Nat Rev Rheumatol . 2012 ; 8 ( 4 ): 187 – 188 . Crossref PubMed Google Scholar
27. Lohmander LS , Englund PM , Dahl LL , Roos EM . The long-term consequence of anterior cruciate ligament and meniscus injuries: osteoarthritis . Am J Sports Med . 2007 ; 35 ( 10 ): 1756 – 1769 . Crossref PubMed Google Scholar
28. Roos EM . Joint injury causes knee osteoarthritis in young adults . Curr Opin Rheumatol . 2005 ; 17 ( 2 ): 195 – 200 . Crossref PubMed Google Scholar
Author contributions
C. Jayadev: Planned the study, Recruited the patients, Performed the experiments, Collated and analyzed the data, Wrote and edited the manuscript.
P. Hulley: Planned the study, Provided technical and laboratory support, Edited the manuscript.
C. Swales: Provided additional samples, Edited the manuscript.
S. Snelling: Planned the study, Provided technical and laboratory support, Edited the manuscript.
G. Collins: Provided bioinformatics advice and further statistical analysis.
P. Taylor: Provided technical and laboratory support, Edited the manuscript.
A. Price: Planned the study, Recruited the patients, Collected the samples, Edited the manuscript.
C. Jayadev and P. Hulley are joint first authors.
Funding statement
The author or one or more of the authors have received or will receive benefits for personal or professional use from a commercial party related directly or indirectly to the subject of this article. In addition, benefits have been or will be directed to a research fund, foundation, educational institution, or other non- profit organization with which one or more of the authors are associated.
ICMJE COI statement
C. Jayadev reports institutional grants from Orthopaedic Research UK and the League of Friends Nuffield Orthopaedic Centre, both related to the study. A. Price reports an institutional grant from the National Institute for Health Research, related to the study, and consultancy payments from Zimmer Biomet, unrelated to the study. P. Hulley reports grants/grants pending from Versus Arthritis and a UCB Pharma project studentship, both unrelated to the study.
Acknowledgements
Thanks to Fiona Germaschewski and Katherine Sulley, both of GlaxoSmithKine Biopharmaceutical Research & Development at the time of the study, for providing additional sample analysis.
Supplementary material
The supplementary material provides extra information for the interested reader. The main text refers to supplementary figures and tables which can be found in this document. The supplementary material is divided into Methods, Results, and Discussion.
© 2020 Author(s) et al. This is an open-access article distributed under the terms of the Creative Commons Attribution Non-Commercial No Derivatives (CC BY-NC-ND 4.0) licence, which permits the copying and redistribution of the work only, and provided the original author and source are credited. See https://creativecommons.org/licenses/by-nc-nd/4.0/.
