


Abstract
Objectives
To investigate the appropriate dose and interval for the administration of triamcinolone acetonide (TA) in treating tendinopathy to avoid adverse effects such as tendon degeneration and rupture.
Methods
Human rotator cuff-derived cells were cultured using three media: regular medium (control), regular medium with 0.1 mg/mL of TA (low TA group), and with 1.0 mg/mL of TA (high TA group). The cell morphology, apoptosis, and viability were assessed at designated time points.
Results
In the low TA group, the cells became flattened and polygonal at seven days then returned to normal at 21 days. The cell apoptosis ratio and messenger ribonucleic acid expression of caspase-3, 7, 8, and 9 increased, and viability was reduced in the low and high groups at seven days. In the low TA group, apoptosis and viability returned to normal at 21 days, however, in the high TA group, the cell morphology, apoptosis ratio, caspase-3, 7, 8, and 9 and viability did not return by day 21. Re-administration was performed in the low TA group at 7-, 14-, and 21-day intervals, and cell viability did not return to the control level at the 7- and 14-day intervals.
Conclusion
A 0.1 mg/mL dose of TA temporarily decreased cell viability and increased cell apoptosis, which was recovered at 21 days, however, 1 mg/mL of TA caused irreversible damage to cell morphology and viability. An interval > three weeks was needed to safely re-administer TA. These findings may help determine the appropriate dose and interval for TA injection therapy.
Cite this article: Bone Joint Res 2014;3:328–34.
Article focus
Previous reports have shown the deleterious effect of triamcinolone acetonide (TA) on tendon tissue.
To our knowledge, no previous study has assessed how the timing and dosing of TA injection therapy can be altered to avoid potential side effects.
This study focused on the appropriate dose and interval of TA administration in an in vitro setting.
Key messages
A 0.1 mg/mL dose of TA had temporary effects on decreasing cell viability of the human rotator cuff-derived cells and increasing cell apoptosis at day 7, however, these effects were no longer evident by day 14 and were recovered by day 21.
A 1.0 mg/mL dose of TA resulted in irreversible changes to the human rotator cuff-derived cells.
These results may be helpful in deciding the appropriate dose and interval of TA injection therapy.
Strengths and limitations
This study was performed in an in vitro setting; therefore, there are significant limitations in assuming that the results can directly translate into the in vivo setting.
Introduction
Repeated corticosteroid injections are often used in patients with rotator cuff tendinopathy, trigger finger, and lateral epicondylitis.1-4 The effectiveness of corticosteroid injections is due to their anti-inflammatory properties.5-6 However, the frequent use of corticosteroids may increase the risk of deterioration of living tissue, and the appropriate dose and interval of injections are controversial.7 The therapeutic use of corticosteroids is a contributing factor in the occurrence of tendon rupture,6-8 andseveral reports have described the detrimental effects of glucocorticoids on tendon cells. For example, dexamethasone inhibited cell proliferation and reduced collagen synthesis in primary tendon cells of rat tails.9 Additionally, an inhibitory effect of glucocorticoids on tendon cell proliferation and proteoglycan production has been found both in vitro and in vivo.10-12
Triamcinolone acetonide (TA) (Kenacort-A; Bristol-Myers, Tokyo, Japan), a synthetic analogue of hydrocortisone, is used in the injection form for the treatment of inflammatory diseases.13,14 However, many cases of tendon injury and rupture after TA injections have been reported.3,15-20 Because of its poor solubility, TA dissolves slowly in aqueous solutions and diffuses into tissue and cellular layers. It has been suggested that this characteristic causes longstanding and deleterious effects.21 Muto et al22 reported considerable deleterious effects of TA with regard to decreases in viability and apoptosis of human rotator cuff-derived cells. Dean et al23 conducted a meta-analysis on the adverse effect of TA in human and animal studies in terms of collagen synthesis, apoptosis, the expression of matrix metalloproteinase the tissue inhibitor of metalloproteinase, and cytokines.23 They concluded that the local administration of a glucocorticoid has significant negative effects on tendon cells in vitro, including reduced cell viability, cell proliferation and collagen synthesis.
Although there are a number of reports on the adverse effects of corticosteroid administration, several clinical questions remain: how often and how much TA can cause deleterious effects and what is the timeframe for potential recovery? To date, there has been no report on the appropriate dose and interval of TA administration for the tendon. Therefore, the purpose of this study was to investigate the appropriate dose and interval of TA administration to avoid detrimental effects in an in vitro setting.
Materials and Methods
Preparation of human rotator cuff-derived cells
The human rotator cuff-derived cells were isolated from the torn edges of human supraspinatus tendons, which were procured during arthroscopic repair of the rotator cuff after obtaining informed consent from the patients (two men aged 61 and 54 years, and one woman aged 72 years). The protocol of this study was approved by our institutional review board. The human adult rotator cuff tissues were transported in a sterile saline solution on ice. The tissue samples (each weighing approximately 0.3 g) were cut into small pieces under sterile conditions, followed by digestion for four hours in Dulbecco’s modified Eagle’s medium (DMEM) (Sigma, St. Louis, Missouri) supplemented with 30 mg/mL of collagenase II (Gibco, Langley, Oklahoma) at 37°C, 95% humidity, and 5% CO2. After digestion, the cells were pelleted, washed in phosphate-buffered saline and cultured in 75 cm2 cell culture flasks with DMEM supplemented with 10% foetal bovine serum (FBS) (Sigma) and 1% penicillin-streptomycin (PS) (Sigma) (regular medium). The cultures obtained from each patient were treated separately. All experiments were performed with cells from the third passage, and the same passage of cells was used for each experiment.
Cell culture
TA was diluted with saline to 1.0 and 0.1 mg/mL. The human rotator cuff-derived cells were cultured in three different media: regular medium, consisting of DMEM supplemented with 10% FBS and 1% PS (control group); regular medium with 0.1 mg/mL of TA (low TA group); and regular medium with 1.0 mg/mL of TA (high TA group). The medium was replaced every three days. The study’s protocol is shown in Figure 1.
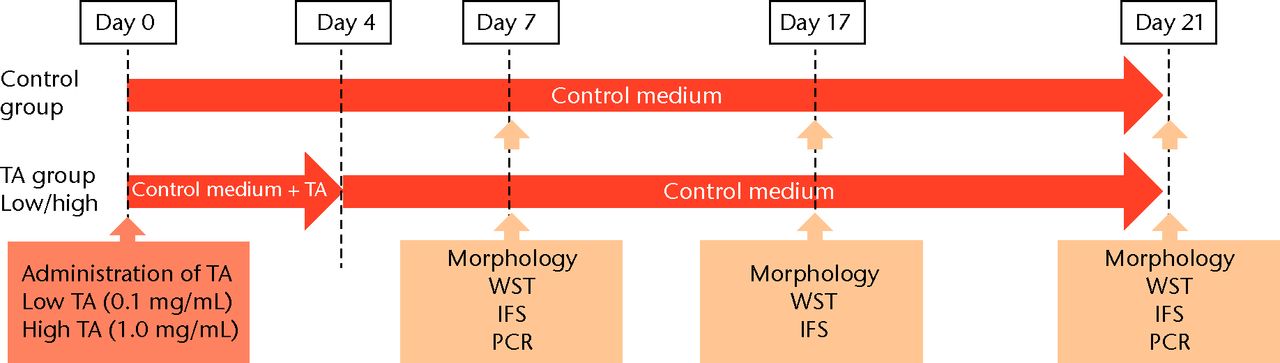
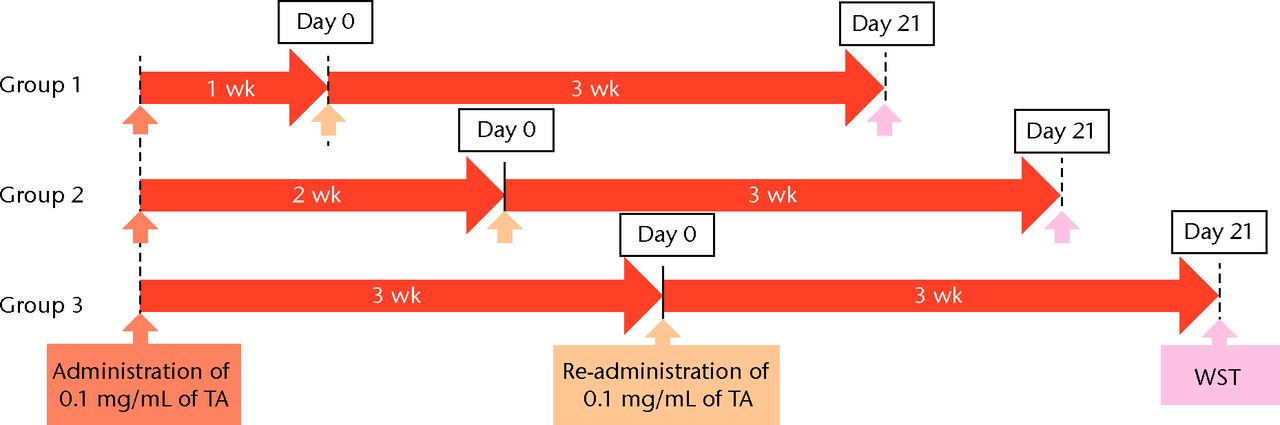
Figs. 1a - 1b
Flow chart showing a) the time course of this study and b) protocol of interval analysis. IFS, immunofluorescence staining; TA, triamcinolone acetonide; WST, water-soluble tetrazolium salt assay; PCR, polymerase chain reaction (group 1, 7-day interval; group 2, 14-day interval; group 3, 21-day interval).
Cell morphology
A total of 5 × 10⁵ cells were seeded onto six-well plates. Cell morphology was observed using a BZ-8000 confocal microscope (Keyence, Osaka, Japan) at days 7, 14, and 21.
Cell viability assays
Cell viability was measured by a water-soluble tetrazolium salt (WST) assay using a Cell Counting Kit-8 (Dojindo, Kumamoto, Japan), as previously described.24 Using 96-well plates, the 5 × 10³ cells were seeded per well, and 100 μL of medium was added. For the WST assay, each well was supplemented with 10 μL of WST for three hours at 37°C in a CO2 incubator before spectrophotometric evaluation. The conversion of the WST to the formazan assay was spectrophotometrically measured at 450 nm. The total cell viability of each group was expressed as the fold difference from the control group at corresponding time points. The cells were exposed to TA at each dose for 7, 14, and 21 days, followed by replacement with a regular medium for three days. To analyse the effect of the re-administration of TA, a 0.1 mg/mL of TA (low dose) was administered in the same manner at 7, 14, and 21 days after the initial TA treatment (Fig. 2) was administered in the same manner at 7, 14, and 21 days after the initial TA treatment (Fig. 2).
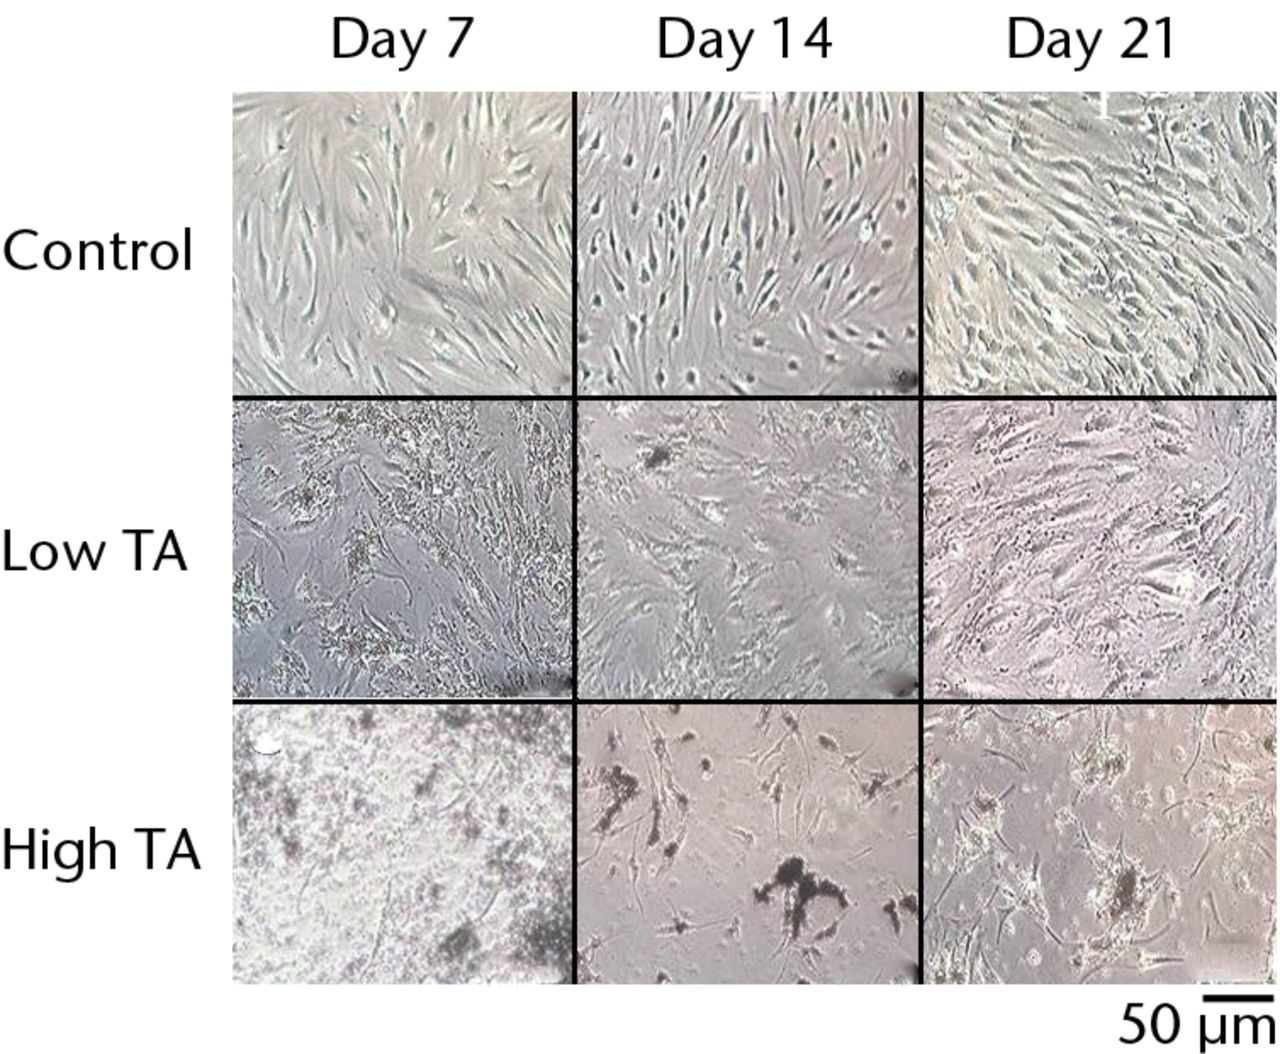
Fig. 2
Cell morphology showing that exposure to triamcinolone acetonide (TA) for seven days yielded flattened and polygonal cells. However, cells in the low TA group had a similar appearance to the control cells at day 21. In the high TA group, there was no recovery of appearance after 21 days.
Detection of apoptosis
To detect cell apoptosis, staining was performed at 7, 14 and 21 days after cultivation using the APO-DIRECT Kit (Bay Bioscience, Kobe, Japan) according to the manufacturer’s protocol. The nucleus was stained with diamidino-2-phenylindole (DAPI). Fluorescent images were obtained using a BZ-8000 confocal microscope (Keyence). For quantitative measurement, the average number of both the apoptotic cells and the DAPI-positive cells were counted from four rectangular areas in each well. The percentage of apoptotic cells was expressed as an average and was calculated as follows: (apoptotic cells/total cells) × 100.
Quantitative real-time polymerase chain reaction
We examined the quantitative real-time polymerase chain reaction (PCR) to reveal the mechanism of apoptosis in cells treated with TA at 7 and 21 days. The messenger ribonucleic acid (mRNA) expressions of caspase 3, 7, 8 and 9 were analysed using quantitative real-time PCR. The total RNA was extracted from control cells and TA-treated cells using an RNeasy Mini Kit (Qiagen, Valencia, California) per the manufacturer's protocol. Oligo (dT) primed first-strand complementary deoxyribonucleic acid (cDNA) was synthesised using a High Capacity cDNA Transcription Kit (Applied Biosystems, Foster City, California). Quantitative real-time PCR was performed in a 20 μl reaction mixture using the SYBR Green Master Mix reagent (Applied Biosystems) on the ABI prism 7500 sequence detection system (Applied Biosystems). The PCR conditions were as follows: one cycle at 95 °C for ten minutes followed by 40 cycles at 95 °C for 15 seconds and at 60 °C for one minute. Pre-designed primers specific for caspase-3, 7, 8, 9, and β-actin were obtained from Invitrogen (Carlsbad, California). The primer sequences were as follows: caspase-3, 5′- TGG TTC ATC CAG TCG CTT TG-3′ (forward) and 5′- CAT TCT GTT GCC ACC TTT CG-3′ (reverse); caspase-7, 5′- GAG CGA CGG AGA GAG ACT GT-3′ (forward) and 5′- CCC CTG CTC TTC AAT ACA GC-3′ (reverse); caspase-8, 5′- GCC TCC CTC AAG TTC CT-3′ (forward) and 5′- CCT GGA GTC TCT GGA ATA ACA-3′ (reverse); caspase-9, 5′- CGA ACT AAC AGG CAA GCA GC-3′ (forward) and 5′- ACC TCA CCA AAT CCT CCA GAA C-3′ (reverse); and β-actin, 5′- GCA AAT TGC TTC TAG GCG GAC TA-3′ (forward) and 5′- CAT CTT GTT TTC TGC GCA AGT T-3′ (reverse). The relative expressions of caspase-3, 7, 8, and 9 were calculated using the ΔΔ-Ct method, normalising to β-actin.
Statistical analysis
In all graphs, the mean values and standard deviations (sd) are provided. Comparisons among the groups were made using the Mann–Whitney U test or the Steel-Dwass test.25 P-values < 0.05 were considered significant. The data were analysed using StatView (Brainpower, Calabasas, California) and Microsoft Excel 2010 (Microsoft Corp., Redmond, Washington).
Results
Cell morphology
The cells in the control group showed a spindle-shaped phenotype at days 7, 14 and 21.In the low TA group, the cells became flattened and polygonal at day 7 but returned to a spindle shape at day 14. By day 21, the cells had a similar appearance to those in the control group. In the high-TA group, the cells also became flattened and polygonal at day 7. The morphology of the cells did not return to a normal level at days 14 or 21 (Fig. 2).
Cell viability assays
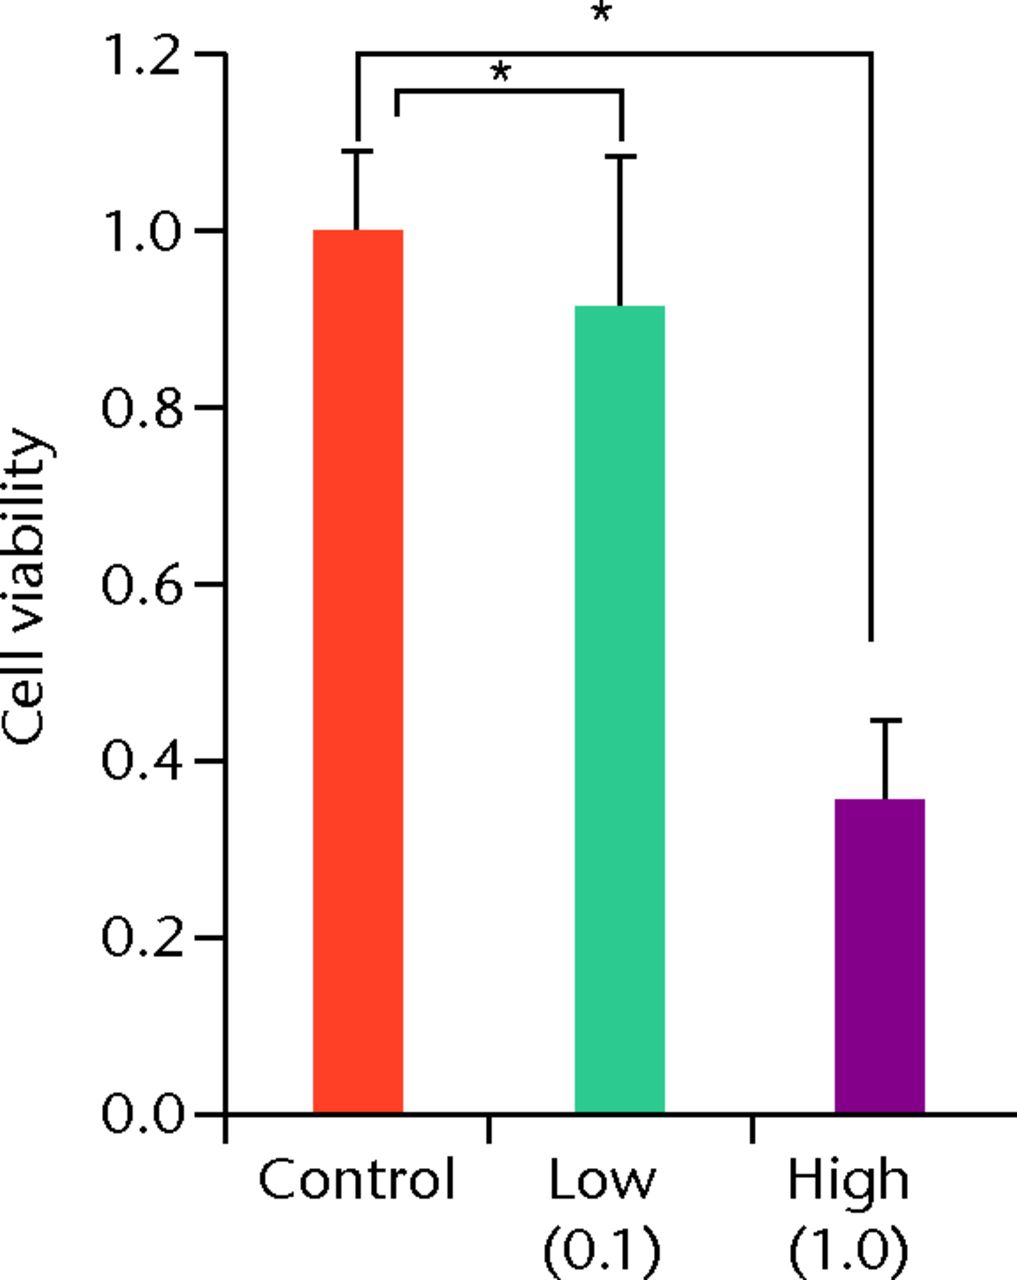
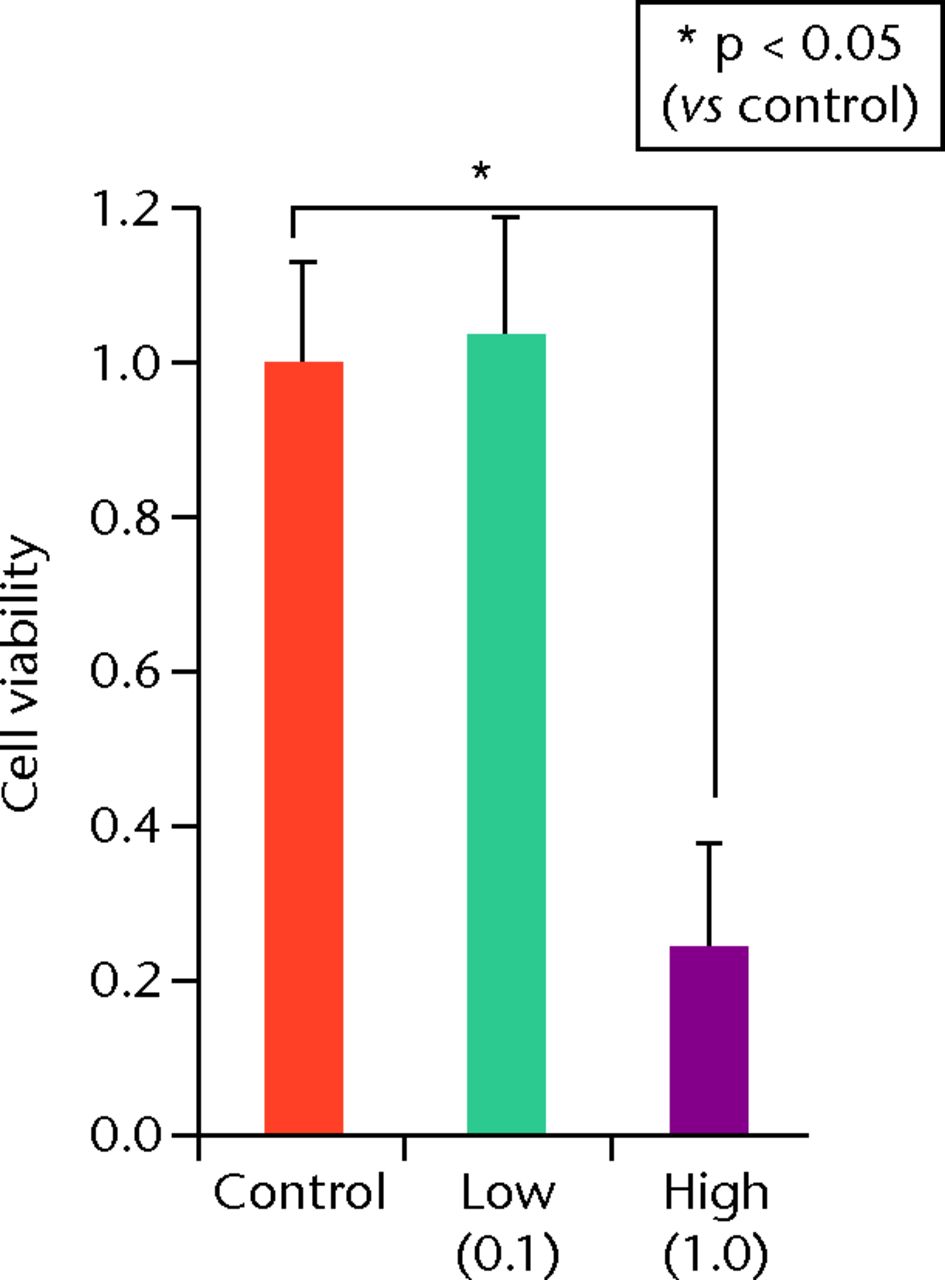
At day 7 the cell viability was 0.73 (sd 0.06) in the low TA group and was 0.21 (sd 0.07) in the high TA group (Fig. 3a) in the high TA group (Fig. 3a). At day 14, the cell viability was 0.92 (sd 0.16) in the low TA group and 0.36 (sd 0.09) in the high TA group (Fig. 3b) in the high TA group (Fig. 3b). At day 21, the cell viability was 1.03 (sd 0.15) in the low TA group and 0.25 (sd 0.13) in the high TA group (Fig. 3c) in the high TA group (Fig. 3c). Both the low and high TA groups showed significantly lower cell viability compared with the control group at days 7 and 14. At day 21, there was no difference between the control and low TA groups, whereas the high TA group still demonstrated significantly lower cell viability compared with the control group.
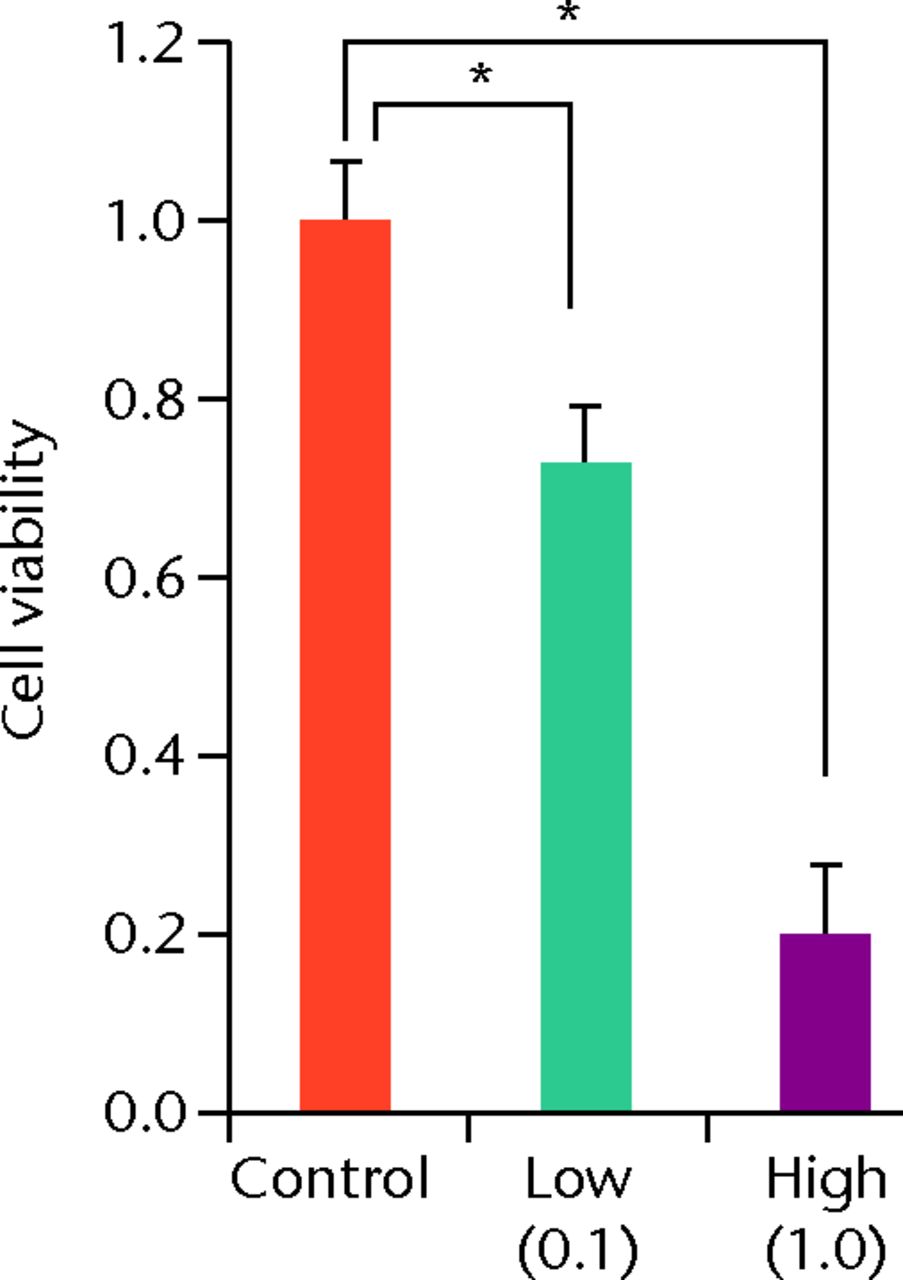
Figs. 3a - 3c
Histograms showing cell viability at a) day 7: significantly lower in the TA groups than in the control group. Also, cell viability in the high TA group was significantly lower than that in the low TA group. b) Day 14: cell viability in the low TA group had a tendency to recover nearly that of the control group. Cell viability in the high TA group remained decreased. c) Day 21: cell viability in the low TA group recovered to the point in the control.
Apoptotic cell analysis
The apoptotic cells were stained green during immunofluorescence staining (Fig. 4). In the control group, few apoptotic cells were seen at days 7, 14 and 21. In the low TA group, a higher number of apoptotic cells was observed at day 7 compared with that in the control group. The appearance of apoptotic cells decreased at days 14 and 21 compared with that at day 7. In the high TA group, numerous apoptotic cells were observed at day 7. At days 14 and 21, the number of apoptotic cells did not decrease. In the low TA group, the rate of apoptotic cells was significantly reduced at days 14 and 21 compared with that at day 7 (day 7: 25.5%, sd 9.3; day 14: 16.8%, sd 5.8 and day 21: 11.6%, sd 5.8). However, in the high TA group, the rate of apoptotic cells was not reduced at any point (day 7: 37.5, sd 12.2%; day 14: 39.9%, sd 18.6 and day 21: 37.5%, sd 14.6).
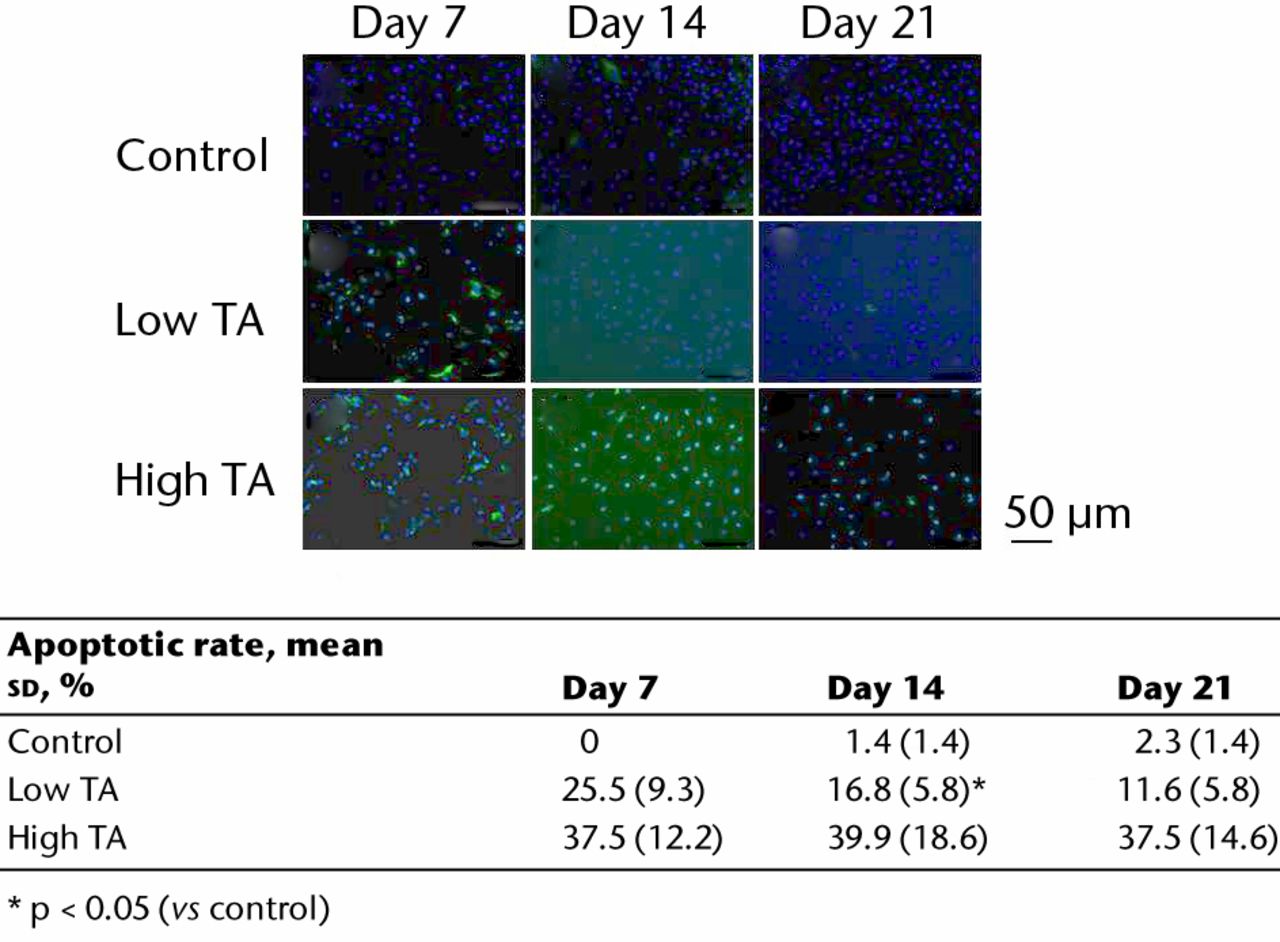
Fig. 4
Immunofluorescence staining showing apoptotic cells (green). In the control, there were few apoptotic cells. Apoptosis in the low TA group decreased over time. The expression of apoptosis was increased in the high TA group, and did not change. The table shows the ratios of apoptotic cells. In the low TA group, the rate of apoptotic cells was significantly reduced at days 14 and 21 compared with day 7. However, in the high TA group, there was no decrease.
Quantitative real-time polymerase chain reaction
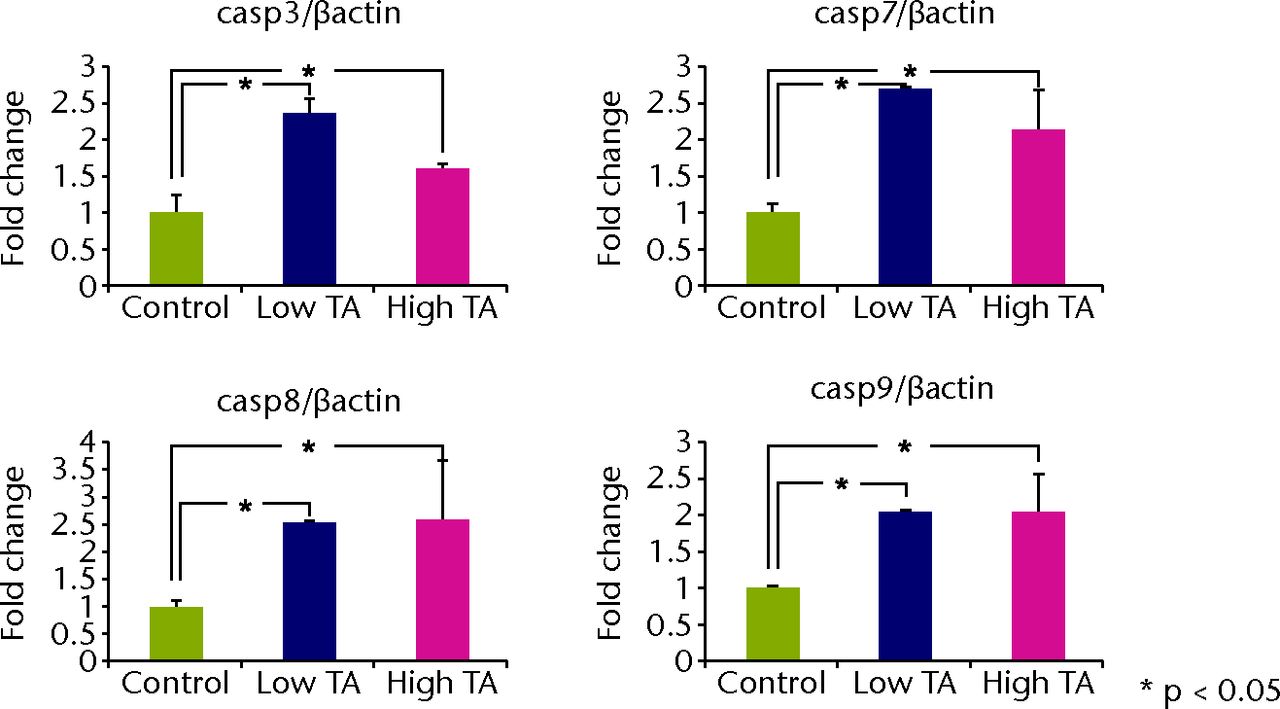
Quantitative real-time PCR revealed that the mRNA expressions of caspase-3, 7, 8 and 9 in the TA-treated group were significantly increased at day 7 compared with those in the control group (p < 0.05; Fig. 5a). All mRNA expressions of caspase were significantly reduced in the low TA group at day 21 (P < 0.05; Fig. 5b). There was no decrease in the high TA group at day 21.
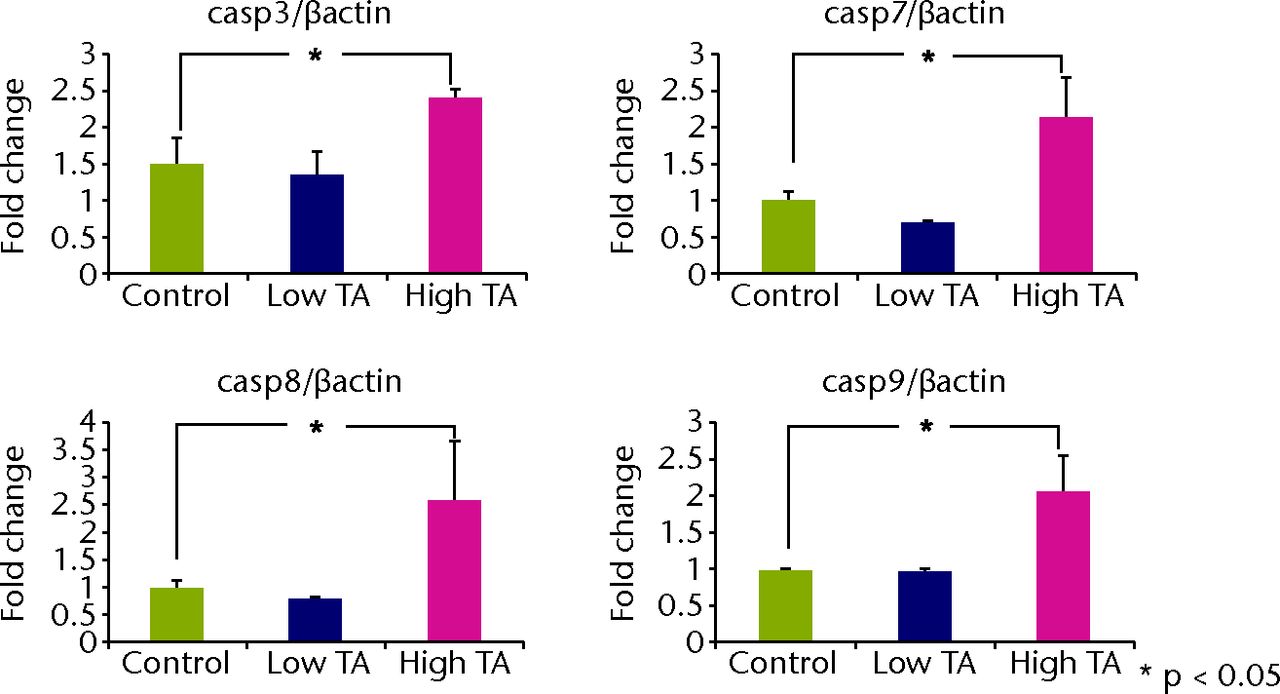
Figs. 5a - 5b
Graphs showing that real-time PCR revealed that the mRNA expressions of caspase-3, 7, 8, and 9 in the TA-treated group were significantly increased at day 7 compared with a) those in the control group (p < 0.05;). All mRNA expressions of caspase were significantly reduced in b) the low TA group at day 21 (p < 0.05;). There was no decrease in high TA group at day 21.
The effect after the re-administration of TA at different intervals
To determine the appropriate interval of TA administration, the cells were treated at 7-, 14-, and 21-day intervals after the initial treatment. Since a TA concentration of 1.0 mg/mL showed irreversible effects on the cells, re-administration was performed using a concentration of 0.1 mg/mL at different intervals. At day 21 after the second TA treatment, the cell viability was analysed. The protocol for this is shown in Figure 1b. The cell viability was 0.40 (sd 0.04) in the seven-day interval group (group 1) and was 0.56 (sd 0.04) in the 14-day interval group (group 2), which was significantly lower compared with that in the control group (Fig. 6) in the 14-day interval group (group 2), which was significantly lower compared with that in the control group (Fig. 6), which was significantly lower compared with that in the control group (Fig. 6). In the 21-day interval group (group 3), the cell viability was 0.87 (sd 0.08), which was not significantly different compared with that in the control group (Fig. 6), which was not significantly different compared with that in the control group (Fig. 6).
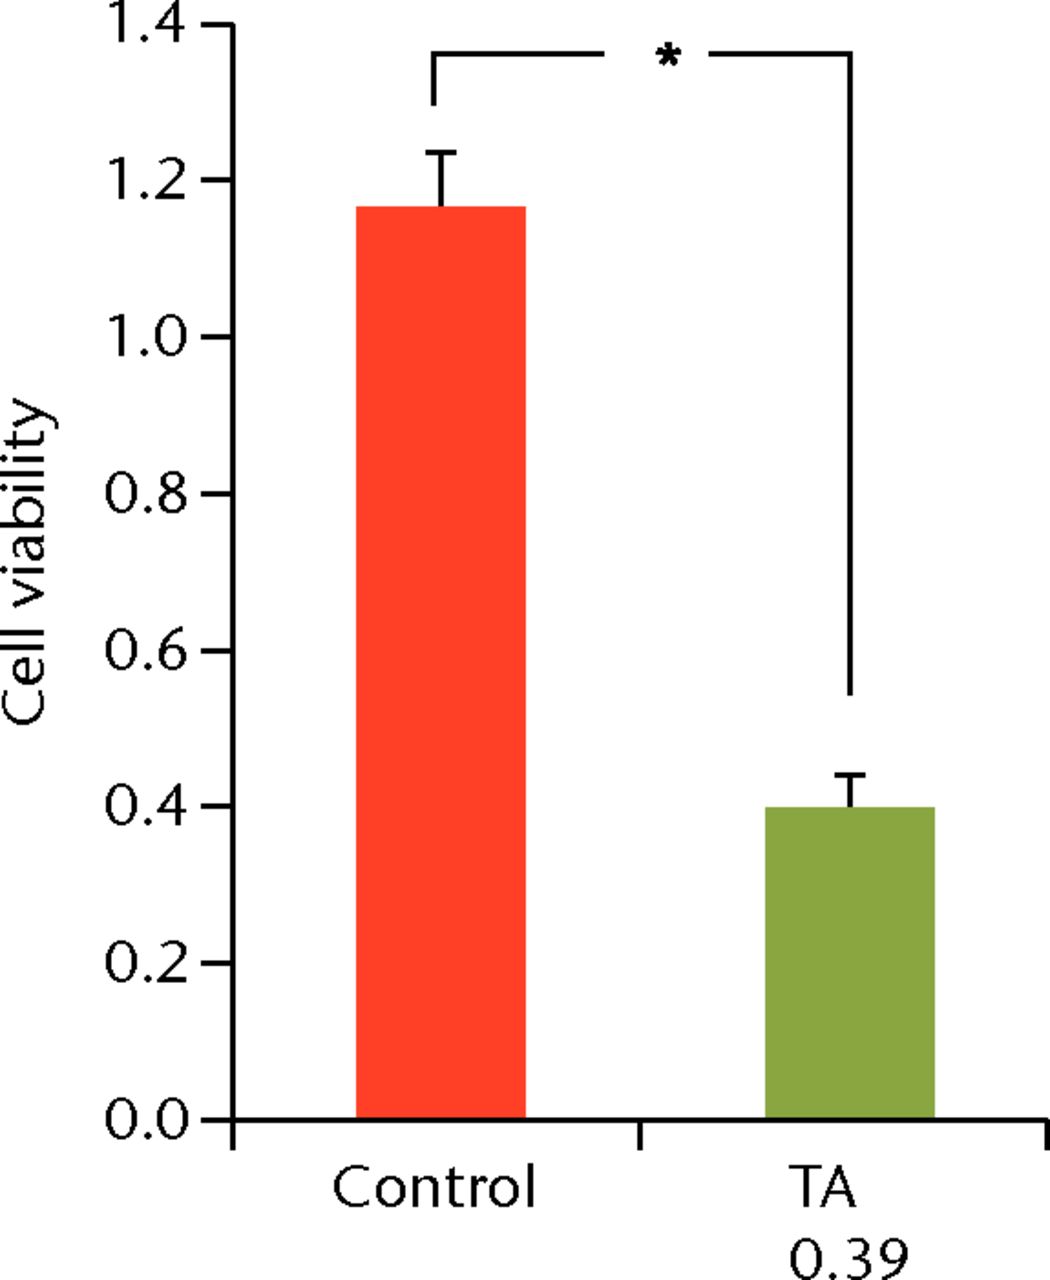
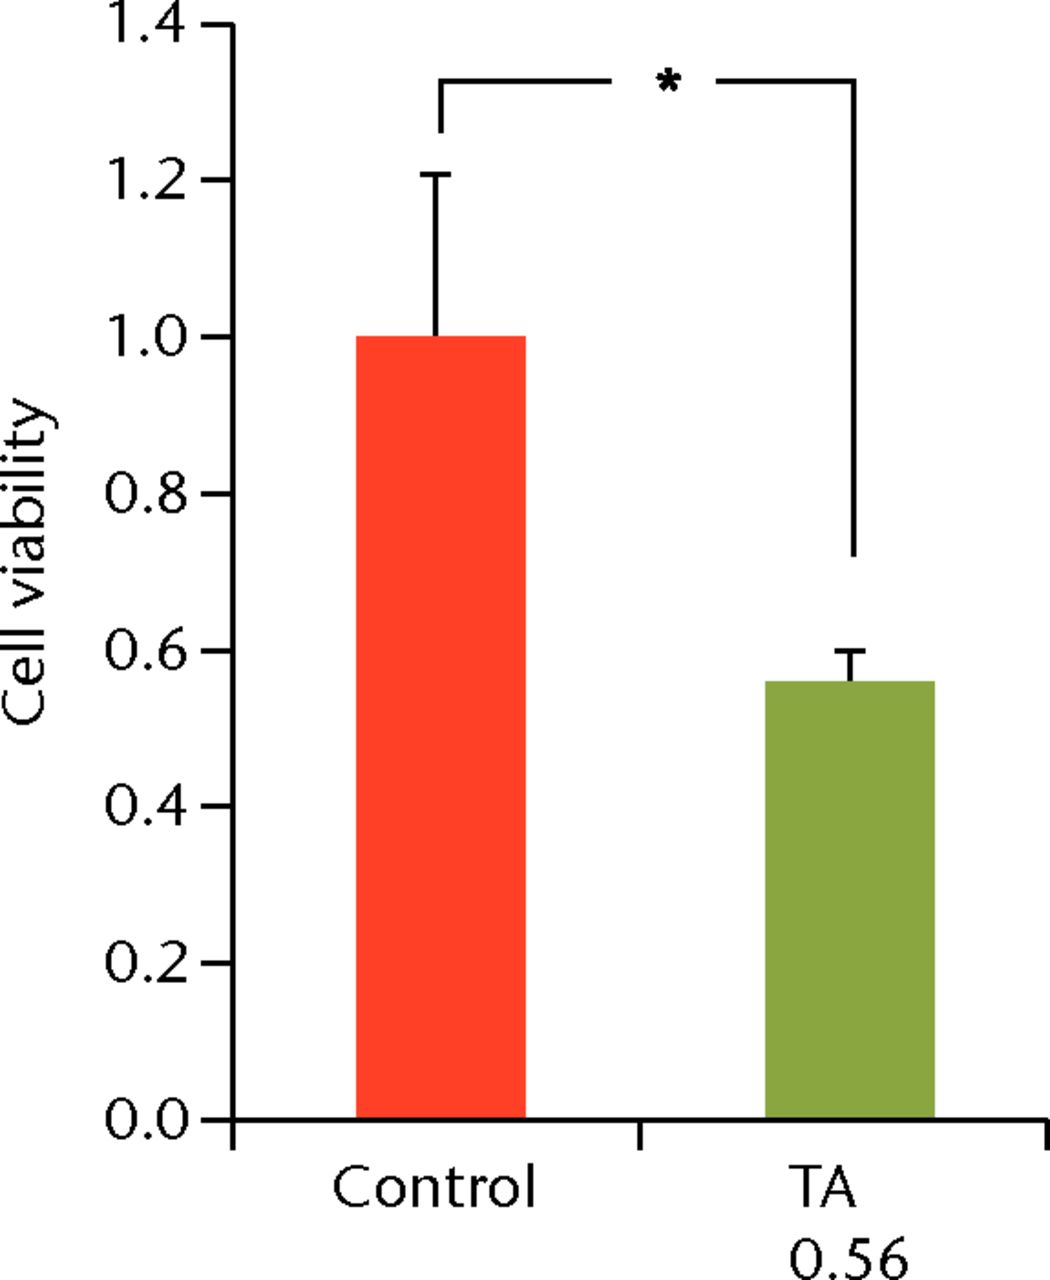
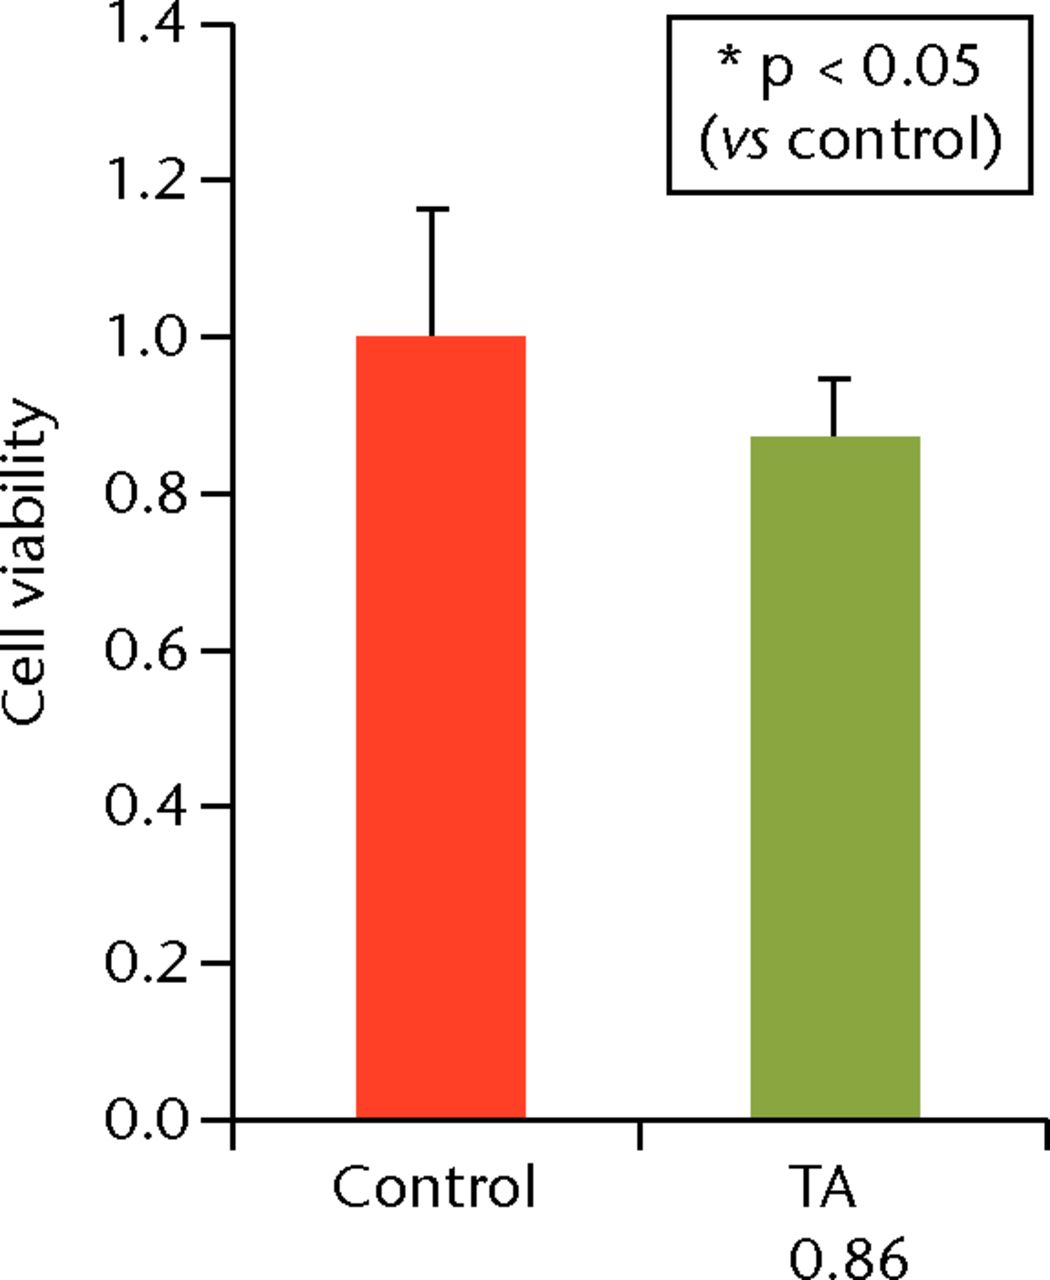
Figs. 6a - 6c
Cell viability (re-administration) was 39.8% (sd 4.3) in the one-week interval group (group 1) and 56.1% (sd 3.9) in the two-week interval group (group 2), which was significantly lower than that in the control group. In the three-week interval group (group 3), cell viability was 86.5% (sd 7.9), and a significant difference was not seen compared with the control group.
Discussion
This study revealed that recovery from the deleterious effects of TA was possible, but it was dependent on both the dose and the interval of administration of TA. In an in vitro study, the methylprednisolone reduced the biomechanical properties of rotator cuff tendons.11 Tempfer et al21 showed that TA caused a decrease in rates of proliferation and in the collagen synthesis of human tendon cells, triggering a differentiation process resulting in an increased number of adipocytes and chondrocytes. Wong et al26 reported that TA-suppressed human tenocyte cellular activity and collagen synthesis. Muto et al22 reported that TA affects viability and apoptosis of human rotator cuff-derived cells. In an in vivo study, Tillander et al17 reported that subacromial injections of TA caused damage in rat rotator cuffs. The fact that TA is a depository drug with prolonged action makes it beneficial as an anti-inflammatory agent in controlling symptoms and providing a longer remission effect, which is why TA is widely used in clinical situations. However, it may also be detrimental to human rotator cuff tenocytes by prolonging the suppression of their viability and the promotion of apoptosis.10 In clinical practice, there are no widely accepted guidelines for corticosteroid injections regarding the appropriate dose and intervals.
With regard to the dose of corticosteroids, Wong et al26 reported that incubation with 0.04 μg/mL and 0.4 mg/mL doses of dexamethasone for four days reduced cell viability in human tendon cells. Hossain et al27 showed that induction of apoptosis was observed in tenocytes when 25 μg/mL and 50 μg/mL doses of dexamethasone were administered. The range of corticosteroid concentration was near to the serum concentration after oral ingestion, however, it was much lower than the concentration of a local injection. In this study, the concentration of TA used was determined as 0.1 mg/mL because it was close to the concentration after the local injection of TA.27 In the present study, the exposure to 0.1 mg/mL of TA caused deleterious effects at days 7 and 14. These effects returned to the control level at day 21. Alternatively, the high number of apoptotic cells in the high TA group at every time point suggests that 1.0 mg/mL of TA causes irreversible changes to the human tendon cells. These results indicated that a high concentration of TA may cause irreversible effects on human tenocytes.
The apoptosis pathway induced by TA has not been revealed in past reports. Lee et al28 reported that dexamethasone induces the apoptosis of nasal polyps via caspase cascades and the Fas-FasL signaling, mitochondrial and p38 MAPK/JNK pathways. We examined quantitative real-time PCR to reveal the mechanism of apoptosis in TA-treated cells. The mRNA expressions of caspase-3, 7, 8 and 9 were increased in both TA groups at day 7, indicating that there was not only drug toxicity but also apoptosis induced by TA. In addition, induction of mRNA expressions of caspase-8 (exogenous factor) and caspase-9 (endogenous factor) indicated that both endogenous and exogenous pathways were activated by TA. In the low TA group, gene expression of caspase-3, 7, 8 and 9 decreased to the control level at day 21; on the other hand these expressions remained higher in high TA group. This result suggested that treatment with low TA caused a reversible effect during the experimental period in contrast to the TA group undergoing treatment with high TA.
We also examined the cumulative effect of multiple TA administrations at different intervals. Because a TA concentration of 1.0 mg/mL showed irreversible effects on the cells, the cells were treated with 0.1 mg/mL of TA twice at different intervals. The re-administration at one- and two-week intervals showed decreased cell viability compared with that in the control group, while re-administration at a three-week interval displayed no difference in cell viability compared with that in the control group. These results indicated that it takes more than three weeks to recover after the initial TA administration.
There are limitations in our study. First, the effects of TA were analysed only in an in vitro system. Since TA injected locally would be metabolised by the whole body systems, these results do not reflect the pharmacokinetics in vitro. Although we determined the TA concentration according to a previous report, it is difficult to estimate the TA concentration after injection in the clinical setting. In addition, we did not assess the relationship between the effect of TA and the numerous numbers of inflammatory cells in tendinopathy. Further studies are needed to analyse the cumulative effects of multiple steroid injections on the whole body systems. Second, the rotator cuff-derived cells that we used may not have identical characteristics as tenocytes in vivo. Since the cell was maintained in a two-dimensional culture, we did not assess its property as a tenocyte.
In conclusion, the administration of 1.0 mg/mL of TA caused irreversible effects on the human rotator cuff-derived cells, while 0.1 mg/mL of TA showed reversible effects. However, it took three weeks to recover from the deleterious effects of 0.1 mg/mL of TA. Moreover, an interval longer than three weeks was needed for the safe re-administration of TA.
Acknowledgments: The authors would like to give a special thanks to T. Ueha, M. Nagata, K. Tanaka, and M. Yasuda for their expert technical assistance.
1 Plafki C , SteffenR, WillburgerRE, WittenbergRH. Local anaesthetic injection with and without corticosteroids for subacromial impingement syndrome. Int Orthop2000;24:40–42.CrossrefPubMed Google Scholar
2 Fukuda H . Partial-thickness rotator cuff tears: a modern view on Codman's classic. J Shoulder Elbow Surg2000;9:163–168.PubMed Google Scholar
3 Gyuricza C , UmohE, WolfeSW. Multiple pulley rupture following corticosteroid injection for trigger digit: case report. J Hand Surg Am2009;34:1444–1448.CrossrefPubMed Google Scholar
4 Hay EM , ThomasE, PatersonSM, DziedzicK, CroftPR. A pragmatic randomised controlled trial of local corticosteroid injection and physiotherapy for the treatment of new episodes of unilateral shoulder pain in primary care. Ann Rheum Dis2003;62:394–399.CrossrefPubMed Google Scholar
5 Andres BM , MurrellGA. Treatment of tendinopathy: what works, what does not, and what is on the horizon. Clin Orthop Relat Res2008;466:1539–1554. Google Scholar
6 Blair B , RokitoAS, CuomoF, JarolemK, ZuckermanJD. Efficacy of injections of corticosteroids for subacromial impingement syndrome. J Bone Joint Surg [Am]1996;78-A:1685–1689.CrossrefPubMed Google Scholar
7 Petri M , DobrowR, NeimanR, Whiting-O’KeefeQ, SeamanWE. Randomized, double-blind, placebo-controlled study of the treatment of the painful shoulder. Arthritis Rheum1987;30:1040–1045.CrossrefPubMed Google Scholar
8 Alvarez CM , LitchfieldR, JackowskiD, GriffinS, KirkleyA. A prospective, double-blind, randomized clinical trial comparing subacromial injection of betamethasone and xylocaine to xylocaine alone in chronic rotator cuff tendinosis. Am J Sports Med2005;33:255–262.CrossrefPubMed Google Scholar
9 Scutt N , RolfCG, ScuttA. Glucocorticoids inhibit tenocyte proliferation and tendon progenitor cell recruitment. J Orthop Res2006;24:173–182.CrossrefPubMed Google Scholar
10 Fisher P . Role of steroids in tendon rupture or disintegration known for decades. Arch Intern Med2004;164:678.CrossrefPubMed Google Scholar
11 Mikolyzk DK , WeiAS, ToninoP, et al.Effect of corticosteroids on the biomechanical strength of rat rotator cuff tendon. J Bone Joint Surg [Am]2009;91-A:1172–1180.CrossrefPubMed Google Scholar
12 Plotkin MB , FossML, GoldinB, EllisDG. Dose-response effects of anti-inflammatory steroid injections on mechanical properties of rat tail tendons. Med Sci Sports1976;8:230–234.PubMed Google Scholar
13 Nichols AW . Complications associated with the use of corticosteroids in the treatment of athletic injuries. Clin J Sport Med2005;15:370–375.CrossrefPubMed Google Scholar
14 Sawaizumi T , NannoM, ItoH. De Quervain’s disease: efficacy of intra-sheath triamcinolone injection. Int Orthop2007;31:265–268. Google Scholar
15 Ford LT , DeBenderJ. Tendon rupture after local steroid injection. South Med J1979;72:827–830.CrossrefPubMed Google Scholar
16 Jakubik J . Finger tendon rupture following local application of triamcinolone-acetonide (Kenalog A-40). Acta Chir Plast1981;23:180–188.PubMed Google Scholar
17 Tillander B , FranzenLE, KarlssonMH, NorlinR. Effect of steroid injections on the rotator cuff: an experimental study in rats. J Shoulder Elbow Surg1999;8:271–274.CrossrefPubMed Google Scholar
18 Woon CY , PhoonES, LeeJY, NgSW, TeohLC. Hazards of steroid injection: suppurative extensor tendon rupture. Indian J Plast Surg2010;43:97–100.CrossrefPubMed Google Scholar
19 Yamada K , MasukoT, IwasakiN. Rupture of the flexor digitorum profundus tendon after injections of insoluble steroid for a trigger fingerJ Hand Surg Eur. Vol2011;36:77–78. Google Scholar
20 Zhang B , HuST, ZhangYZ. Spontaneous rupture of multiple extensor tendons following repeated steroid injections: a case report. Orthop Surg2012;4:118–121.CrossrefPubMed Google Scholar
21 Tempfer H , GehwolfR, LehnerC, et al.Effects of crystalline glucocorticoid triamcinolone acetonide on cultured human supraspinatus tendon cells. Acta Orthop2009;80:357–362. Google Scholar
22 Muto T , KokubuT, MifuneY, et al.Platelet-rich plasma protects rotator cuff-derived cells from the deleterious effects of triamcinolone acetonide. J Orthop Res2013;31:976–982.CrossrefPubMed Google Scholar
23 Dean BJ , LostisE, OakleyT, et al.The risks and benefits of glucocorticoid treatment for tendinopathy: a systematic review of the effects of local glucocorticoid on tendon. Semin Arthritis Rheum2014;43:570–576.CrossrefPubMed Google Scholar
24 Tohidnezhad M , VarogaD, WruckCJ, et al.Platelet-released growth factors can accelerate tenocyte proliferation and activate the anti-oxidant response element. Histochem Cell Biol2011;135:453–460.CrossrefPubMed Google Scholar
25 Dwass, M. Some k-Sample Rank Order Tests. In: Olkin I, Ghurye SG, Hoeffding W, Madow WG, Mann HB, eds. Contributions to probability and statistics. Stanford, California: Stanford University Press, 1960:198–202. Google Scholar
26 Wong MW , LuiWT, FuSC, LeeKM. The effect of glucocorticoids on tendon cell viability in human tendon explants. Acta Orthop2009;80:363–367.CrossrefPubMed Google Scholar
27 Hossain MA , ParkJ, ChoiSH, KimG. Dexamethasone induces apoptosis in proliferative canine tendon cells and chondrocytes. Vet Comp Orthop Traumatol2008;21:337–342.PubMed Google Scholar
28 Lee TH , NamJG, LeeHM, et al.Dexamethasone induces apoptosis of nasal polyp-derived tissue cultures through JNK and p38 MAPK activation. Clin Exp Otorhinolaryngol2014;7:112–118.CrossrefPubMed Google Scholar
Funding statement:
None declared
Author contributions:
Y. Harada: Study design, Data collection, Data analysis, Manuscript writing
T. Kokubu: Study design, Data analysis, Editorial contribution, Principal investigator
Y. Mifune: Data analysis, Editorial contribution
A. Inui: Data analysis, Editorial contribution
R. Sakata: Data analysis, Editorial contribution
T. Muto: Data analysis, Data collection, Editorial contribution
F. Takase: Data analysis, Editorial contribution
M. Kurosaka: Editorial contribution
ICMJE Conflict of Interest:
None declared
©2014 The British Editorial Society of Bone & Joint Surgery. This is an open-access article distributed under the terms of the Creative Commons Attributions licence, which permits unrestricted use, distribution, and reproduction in any medium, but not for commercial gain, provided the original author and source are credited.
