


Abstract
Objectives
The development of tibiofemoral angle in children has shown ethnic variations. However this data is unavailable for our population.
Methods
We measured the tibiofemoral angle (TFA) and intercondylar and intermalleolar distances in 360 children aged between two and 18 years, dividing them into six interrupted age group intervals: two to three years; five to six years; eight to nine years; 11 to 12 years; 14 to 15Â years; and 17 to 18 years. Each age group comprised 30 boys and 30 girls. Other variables recorded included standing height, sitting height, weight, thigh length, leg length and length of the lower limb.
Results
Children aged two to three years had a valgus angulation with a mean TFA of 1.8° (sd 0.65) in boys and 2.45° (sd 0.87) in girls. Peak valgus was seen in the five- to six-year age group, with mean TFAs of 6.7° (sd 1.3) and 7.25° (sd 0.64) for boys and girls, respectively. From this age the values gradually declined to a mean of 3.18° (sd 1.74) and 4.43° (sd 0.68) for boys and girls, respectively, at 17 to 18 years. Girls showed a higher valgus angulation than boys at all age groups.
Conclusion
This study defines the normal range of the TFA in south Indian boys and girls using an easy and reliable technique of measurement with a standardised custom-made goniometer.
Cite this article: Bone Joint Res 2013;2:155–61.
Article focus
Development of the tibiofemoral angle (TFA) in south Indian children aged between two and 18 years
Key messages
The reversal of physiological varus in our population occurs by the age of two years
Peak valgus angulation is seen at five to six years of age, after which the valgus angulation gradually decreases until maturity
Girls show higher valgus angulation than boys
Strengths and limitations
Demonstrates the use of a standardised custom-made goniometer as an easy and reliable technique of measurement of the TFA
Values serve as guidelines for deformity correction in the paediatric age group and for designing joint prostheses and implants, while the standard deviations help distinguish physiological variations from pathological ones
Limitations include lack of data for children aged < two years
Introduction
Bow legs and knock knees are commonly encountered paediatric orthopaedic problems.1 During development the knee undergoes sequential physiological changes in its axial alignment from varus to valgus. Knowledge of the normal limits of the tibiofemoral angle (TFA) in children is an aid in distinguishing physiological from pathological variations. Many children undergo treatment for physiological genu varum or valgum, which, in some cases, may prove harmful.2-4 This knowledge also helps the surgeon determine the acceptable limits for deformity.
Physiological variations have been studied measuring the TFA and the intercondylar (ICD) and intermalleolar (IMD) distances. These parameters have been evaluated using radiological, photographic and clinical measurement with a goniometer.2-7 Although each method has its advantages and disadvantages, the clinical method is widely used as it is non-invasive, easy, reliable and reproducible.3-6
The existing studies have shown variations in the range of the normal values in different ethnic groups.8,9 No normal values have been established so far in the south Indian (Dravidian) paediatric and adolescent population. This study aimed to establish such values for the south Indian population and to define differences that might exist between different ethnic groups.
Materials and Methods
A cross-sectional study was undertaken on 360 normal south Indian children, ranging in age from two to 18 years. The approval of the Institutional Review Board and the local education authorities were obtained. Children aged < five years were selected from those attending the outreach vaccination clinics of the institution, and also from two childcare centres in the district. Children aged ≥ five years were selected from six schools in the same locality. The children were divided into six interrupted age groups: two to three years; five to six years; eight to nine years; 11 to 12 years; 14 to 15 years; and 17 to 18 years. A total of 30 boys and 30 girls were recruited into each of these age groups. A sample size of 30 per age group was deemed to be adequate to obtain information on central tendency and dispersion for this normative study.10
Children with orthopaedic disorders (such as developmental dislocations of the hip, various skeletal dysplasias, cerebral palsy, neuromuscular disorders and foot deformities), those who had undergone surgery of the lower limbs and those who had a leg-length discrepancy of > 2 cm were excluded. The left lower limb of each child was measured by a single examiner (SEM). Children aged < two years were not included in this study. Age in years was verified by documents from the schools or immunisation cards in younger children.
All measurements were made by a single researcher (SEM). Standing and sitting heights were measured using a standardised height rod and weight was measured using a standardised weighing scale. The length of the thigh was measured from the anterior superior iliac spine (ASIS) to the medial joint line of the knee. The leg length was measured from the medial joint line of the knee to the tip of the medial malleolus. The sum of the above two was designated as the length of the lower limb. These measurements were undertaken using standardised measuring tape.
The tibiofemoral angle and the intercondylar and intermalleolar distance were measured as described. The children were made to stand with the hips and knees in full extension and neutral rotation, with the knees or ankles touching each other. The ASIS was marked with a skin marker pen. The centre of patella was identified with the aid of concentric circles of increasing diameters and then marked with the pen (Fig. 1). The centre of the ankle was marked as the midpoint between the medial and the lateral malleoli with the help of a standardised vernier calliper (Fig. 2). We customised standardised goniometers, validated by the Biomedical Department, with expandable arms for higher accuracy (Fig. 3). The goniometer was placed with its hinge at the centre of the patella. Each axis of the goniometer was adjusted such that the tip of the proximal limb touched the ASIS and the tip of the distal limb touched the midpoint of the ankle (Fig. 4). The TFA was measured using the goniometer to the nearest degree. This angle corresponded to the angle suspended by the anatomical axis of the femur with the anatomical axis of the tibia. A valgus TFA was given a positive value, while a varus TFA was given a negative value.
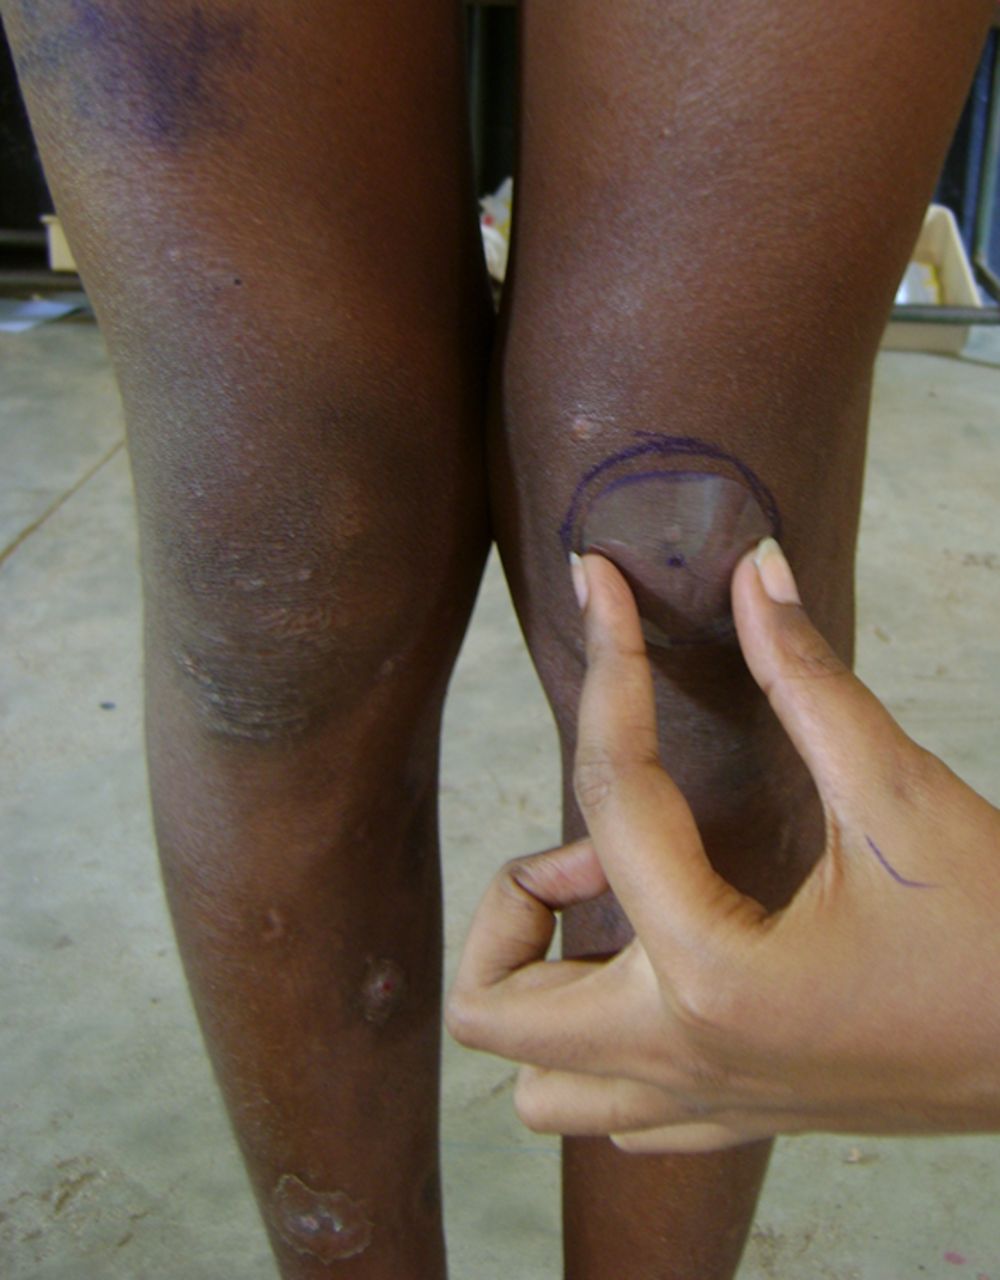
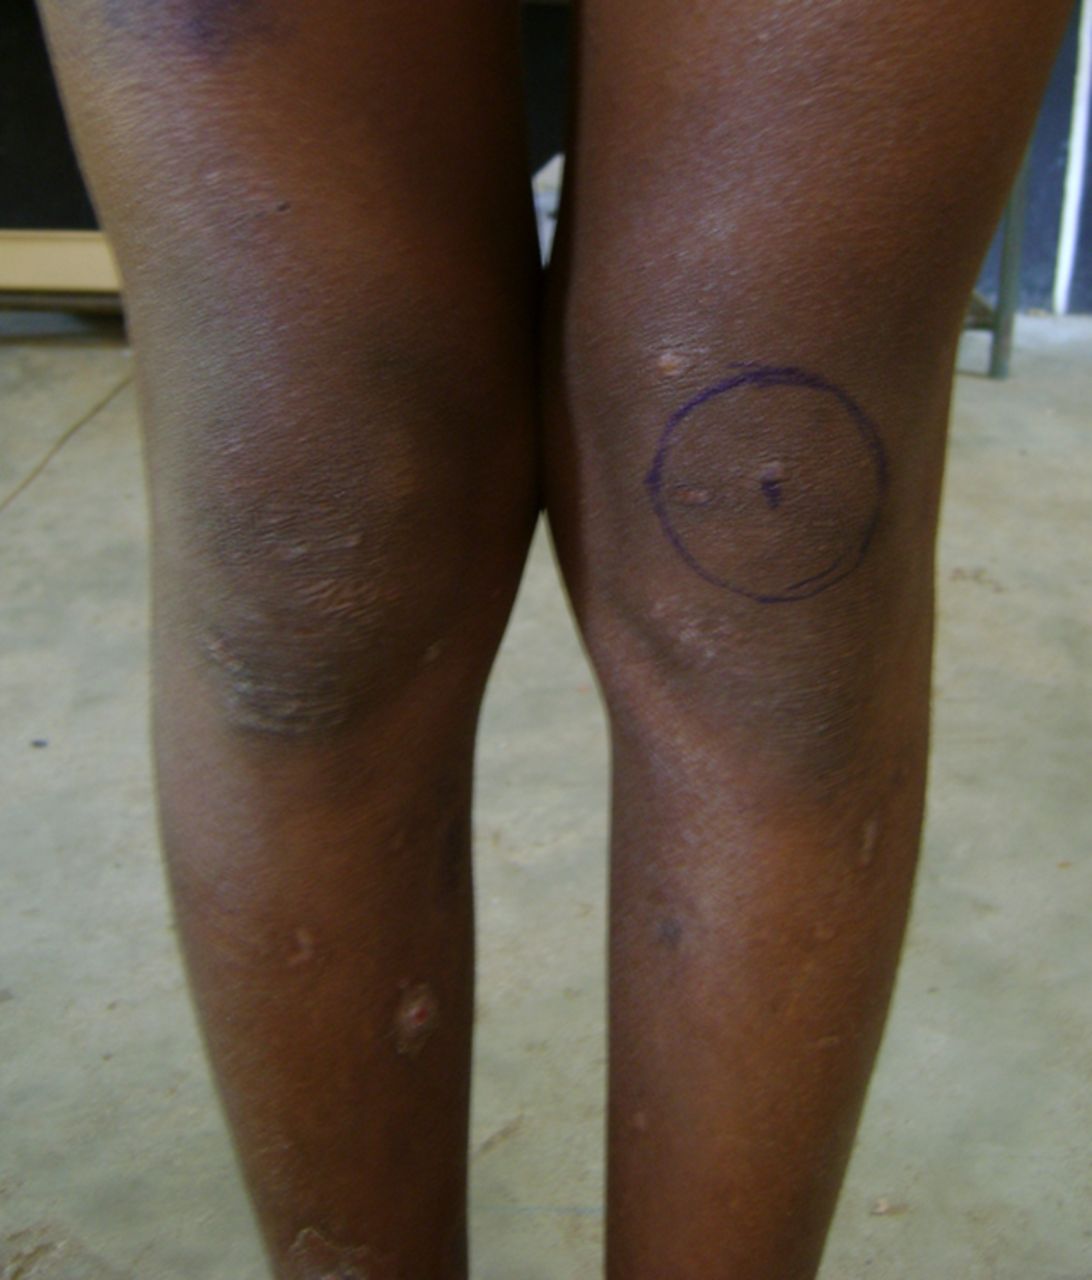
Figs. 1a - 1b
Clinical photographs showing the determination of the centre of the patella using a concentric circle.
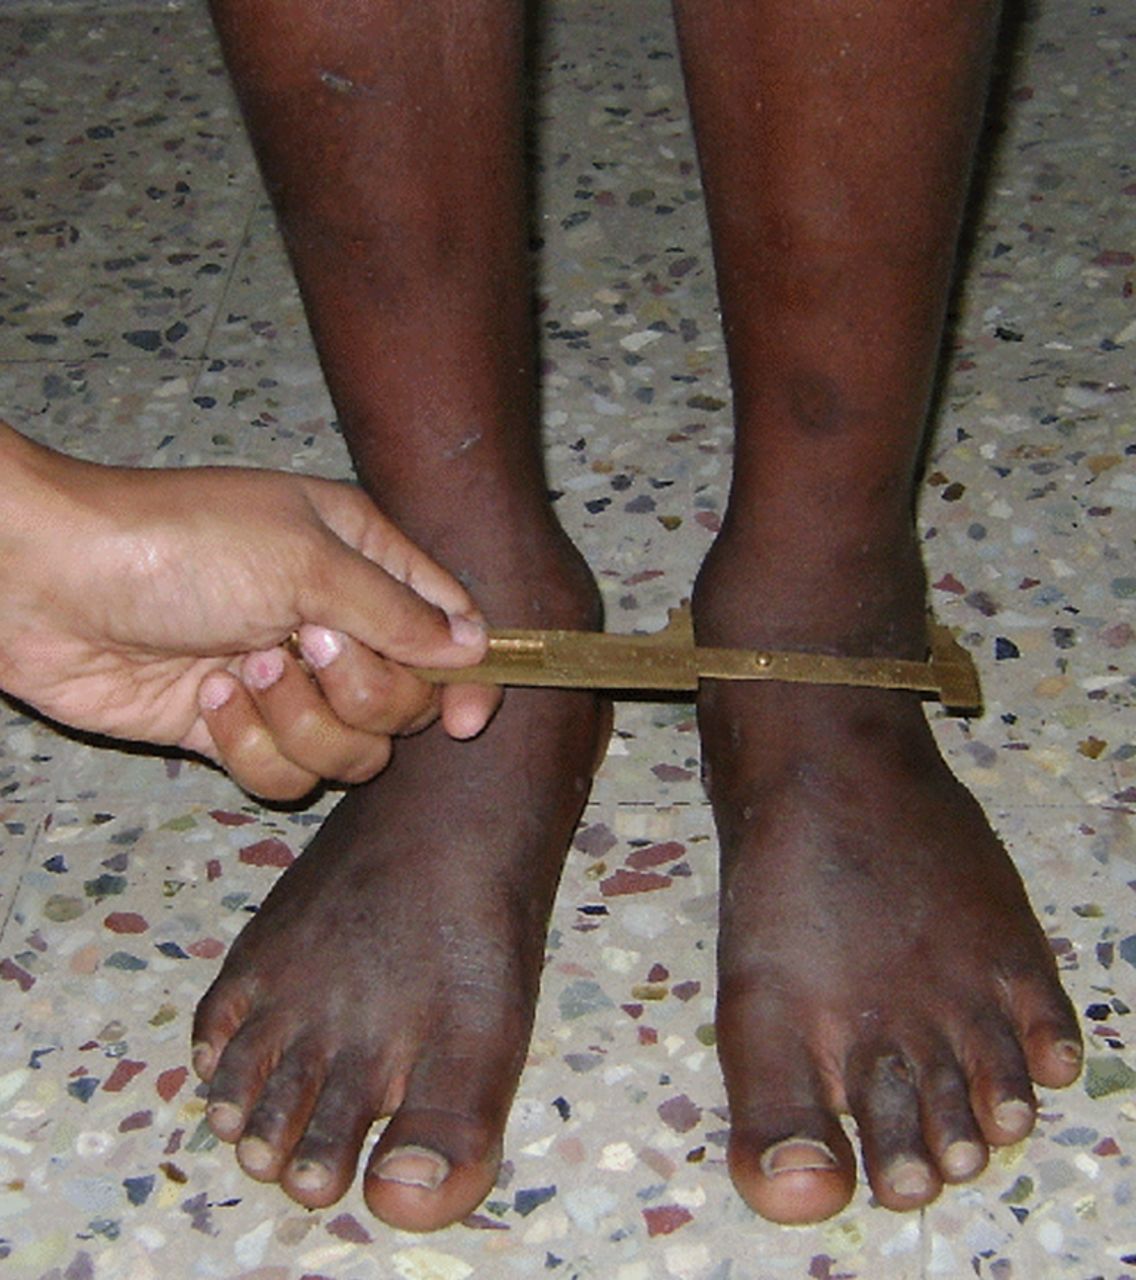
Fig. 2
Clinical photograph showing the determination of centre of the ankle using a vernier calliper.
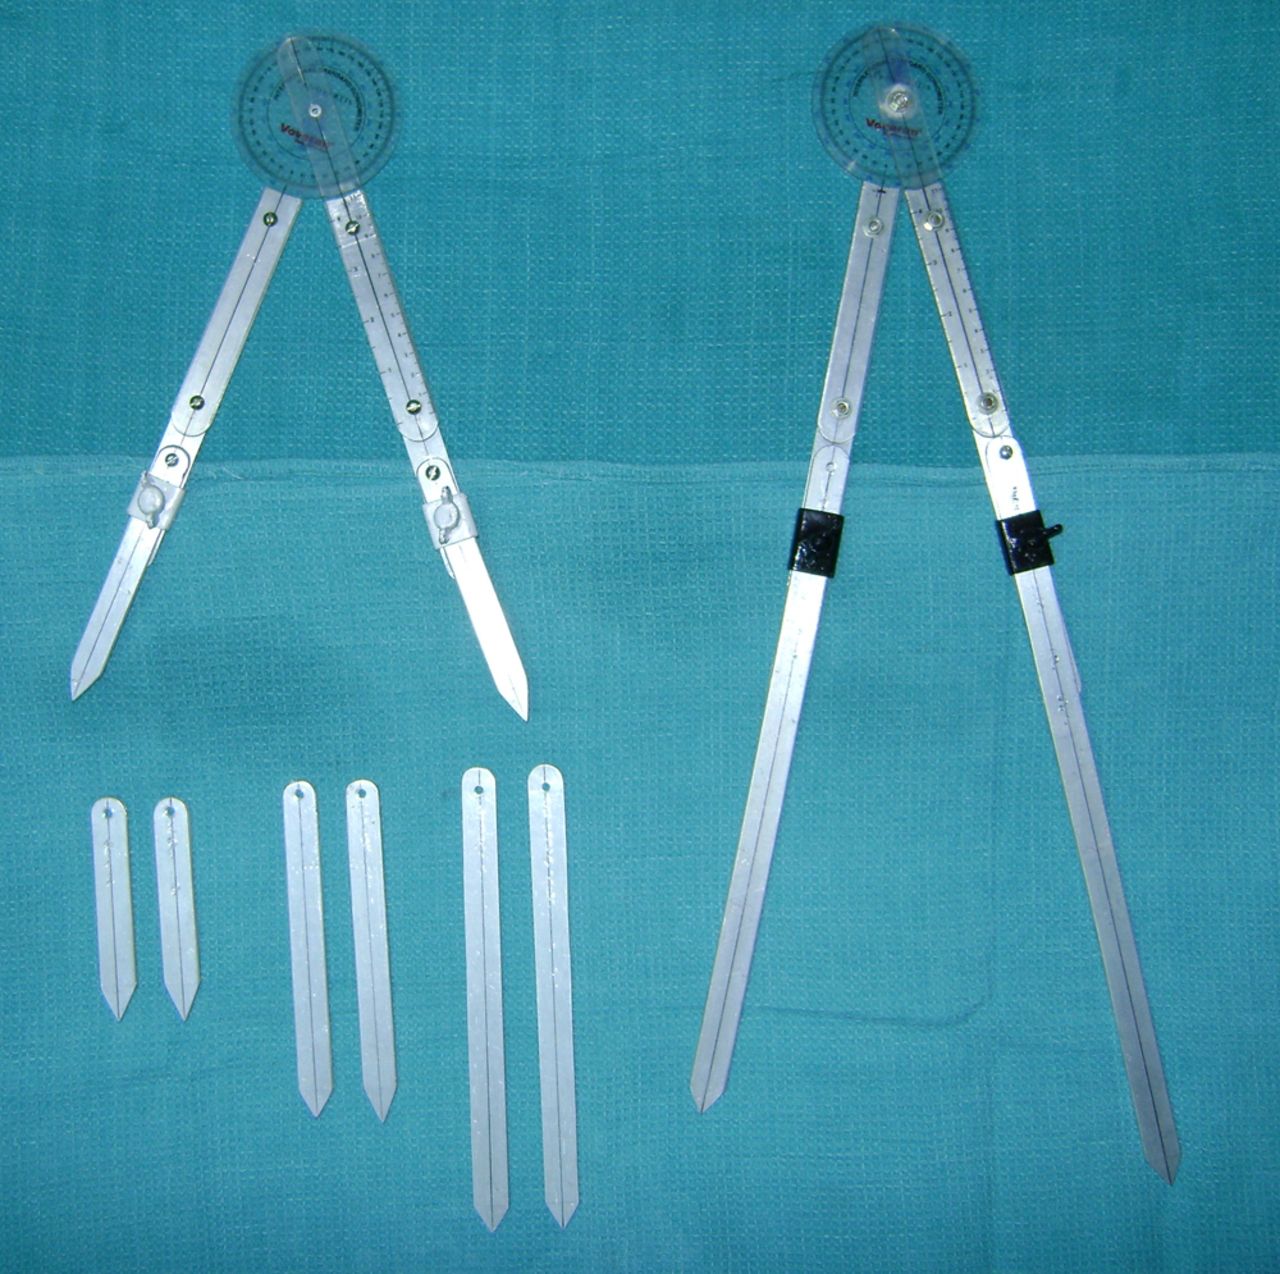
Fig. 3
Photograph showing the customised standardised goniometers with expandable arms.
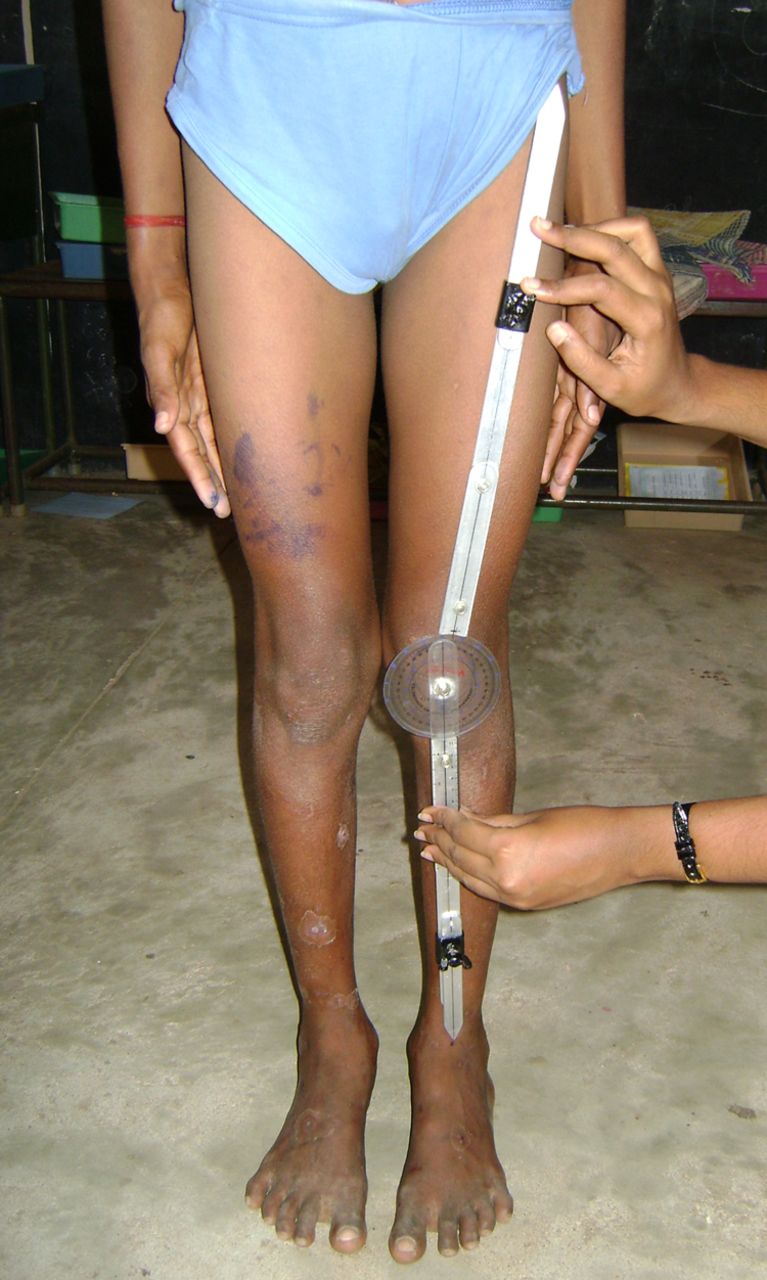
Fig. 4
Clinical photograph showing the determination of the tibiofemoral angle using customised standardised goniometer.
The ICD and IMD were measured with a standardised vernier calliper. The IMD was measured as the distance between the medial malleoli with the medial femoral condyles in contact. In cases where the IMD was 0, the ICD was measured as the distance between the medial femoral condyles with the medial malleoli touching.
Statistical analysis
This was conducted using STATA 10.0 (StataCorp, College Station, Texas). The mean differences of the TFA between the boys and girls were assessed using the independent t-test. Any possible correlation between the TFA, ICD or IMD with any of the following variables: age, standing and sitting heights, weight, thigh length, leg length and length of the lower extremity, was assessed by performing the Pearson’s correlation test. A p value < 0.05 was considered to be statistically significant.
The left lower limb was measured in each child by a single examiner (SEM). In order to assess intra-observer variability, the TFA of 20 children (aged between five and 15 years) who presented to the Paediatric Orthopaedic outpatient clinic on a single day were measured, and then measured a second time after six hours in random order. The difference between the two readings for any angle measured (R1 – R2) was plotted against the mean between the two angles measured on a single individual (R1 + R2)/2 (Fig. 5).
![Fig. 5
Scatter plot showing the intra-observer
variability. The graph is plotted between the difference in angle
measured (R1 – R2) and the mean angle ([R1 + R2]/2) measured by
a single observer. Most of the points lie between the –1° and +1°
axes, indicating minimal intra-observer variation.](/api/asset/2046-3758.28.2000157/2000157-galleyfig5.jpeg)
Fig. 5
Scatter plot showing the intra-observer variability. The graph is plotted between the difference in angle measured (R1 – R2) and the mean angle ([R1 + R2]/2) measured by a single observer. Most of the points lie between the –1° and +1° axes, indicating minimal intra-observer variation.
Results
The mean TFA in boys and girls of different age groups is shown in Table Iand Figure 6. Children between two and three years of age were found to have a valgus angulation. Thus the reversal from varus to valgus alignment occurred under the age of two years. Peak valgus angulation was achieved at five to six years, with a mean valgus of 6.7° (sd 1.3) in boys and 7.25° (sd 0.64) in girls. Thereafter the angle decreased with age until it reached a mean of 3.18° (sd 1.74) in boys and 4.43° (sd 0.68) in girls aged 17 to 18 years. The overall mean valgus angulation was 4.05° (sd 2.32) in boys and 4.90° (sd 2.11) in girls. Girls had a greater valgus angle than boys, which was statistically significant (p = 0.0004).
Table I
Mean tibiofemoral angle (TFA) by age group and gender (CI, confidence interval)
| Mean (sd) TFA (°) | |||||
|---|---|---|---|---|---|
| Age group | Boys | Girls | Mean difference (95% CI of TFA) | p-value | |
| 2 to 3 years | 1.80 (0.65) | 2.45 (0.87) | -0.65 (-1.0 to -0.21) | 0.003 | |
| 5 to 6 years | 6.70 (1.30) | 7.25 (0.64) | -0.55 (-1.1 to 0.03) | 0.06 | |
| 8 to 9 years | 4.86 (1.06) | 5.76 (2.23) | -0.9 (-1.8 to 0.003) | 0.05 | |
| 11 to 12 years | 4.50 (1.78) | 5.31 (1.58) | -0.81 (-2.05 to -0.04) | 0.04 | |
| 14 to 15 years | 3.50 (2.80) | 4.73 (0.74) | -1.23 (-2.17 to 0.24) | 0.11 | |
| 17 to 18 years | 3.18 (1.74) | 4.43 (0.68) | -1.25 (-1.86 to -0.17) | 0.02 | |
| Total | 4.05 (2.32) | 4.90 (2.11) | -0.85 (-1.31 to -0.38) | < 0.001 | |
Table II
Findings of studies on the tibiofemoral angle (TFA) in children (ICD, intercondylar distance; IMD, intermalleolar distance)
| Findings | |||||||||||||
|---|---|---|---|---|---|---|---|---|---|---|---|---|---|
| Authors | Children (n) | Race | Age (yrs) | Technique | Varus | Valgus | Peak valgus | Final valgus | Gender variation | Notes | |||
| Salenius and Vankka2 | 1279 | Caucasian | 0 to 16 | Radiological and clinical | < 1 yr | 18 mths to 3 yrs | 2 to 3 yrs | 5° to 6° | No | - | |||
| Cheng et al3 | 2630 | Chinese | 0 to 12 | Clinical | - | - | - | - | No | Newborns: mean ICD of 3 cm (0 to 5.5). At 1 yr: ICD 0 cm. At 3 yrs: maximum IMD 2.8 cm. At 8 yrs: reversion to plateau of 0 cm | |||
| Heath and Staheli4 | 196 | White | 0.5 to 11 | Photographic | 6 mths | - | 4 yrs (8°) | 11 yrs (< 6°) | No | - | |||
| Cahuzac et al6 | 427 | European | 10 to 16 | Clinical | - | - | - | - | Yes | Girls: constant valgus (IMD < 8 cm or ICD < 4 cm). Boys: varus evolution (4.4°) during the last 2 years of growth (IMD < 4 cm/ ICD < 5 cm) | |||
| Arazi et al5 | 590 | Turkish | 3 to 17 | Clinical | - | Up to 11° | 9.6° at 7 yrs (boys) and 9.8° at 6 yrs (girls) | 6.6° (boys) and 7.5° (girls) | At ages of 13, 14 and 16 years | - | |||
| Omololu et al14 | 2166 | Nigerian | 1 to 10 | Clinical | 1 to 3 yrs | - | - | 11° in 1 to 10 yrs | Between 3 and 7 years | - | |||
| Oginni et al11 | 2036 | Nigerian | 0 to 12 | Photography and clinical | 0 to 6 mths | > 23 mths | - | - | Yes | Bimodal: 21 to 23 months | |||
| Yoo et al12 | 452 | Korean | 0 to 16 | Radiological | < 1 yr | - | 4 yrs (max. 7.8°) | 7 to 8 yrs (5° to 6°) | No | - | |||
| Saini et al8 | 215 | Indian | 2 to 15 | Clinical | < 2 yrs | > 2 yrs | 6 yrs (approx. 8°) | 10 yrs (4° to 5°) | Yes | - | |||
| Rahman and Badahdah13 | 300 | Saudi | 2 to 12 | Clinical | - | 2 yrs | 3 to < 4 yrs (9.46° (sd 0.85)) | 11 to 12 yrs (3.47°) | Yes | - | |||
| Present study | 360 | South Indian | 2 to 18 | Clinical | - | 2 yrs | 5 to 6 yrs (6.7° (sd 1.3) boys and 7.25° (sd 0.64) girls) | 17 to 18 yrs (3.18° (sd 1.74) boys and 4.43° (sd 0.68) girls) | Yes | - | |||
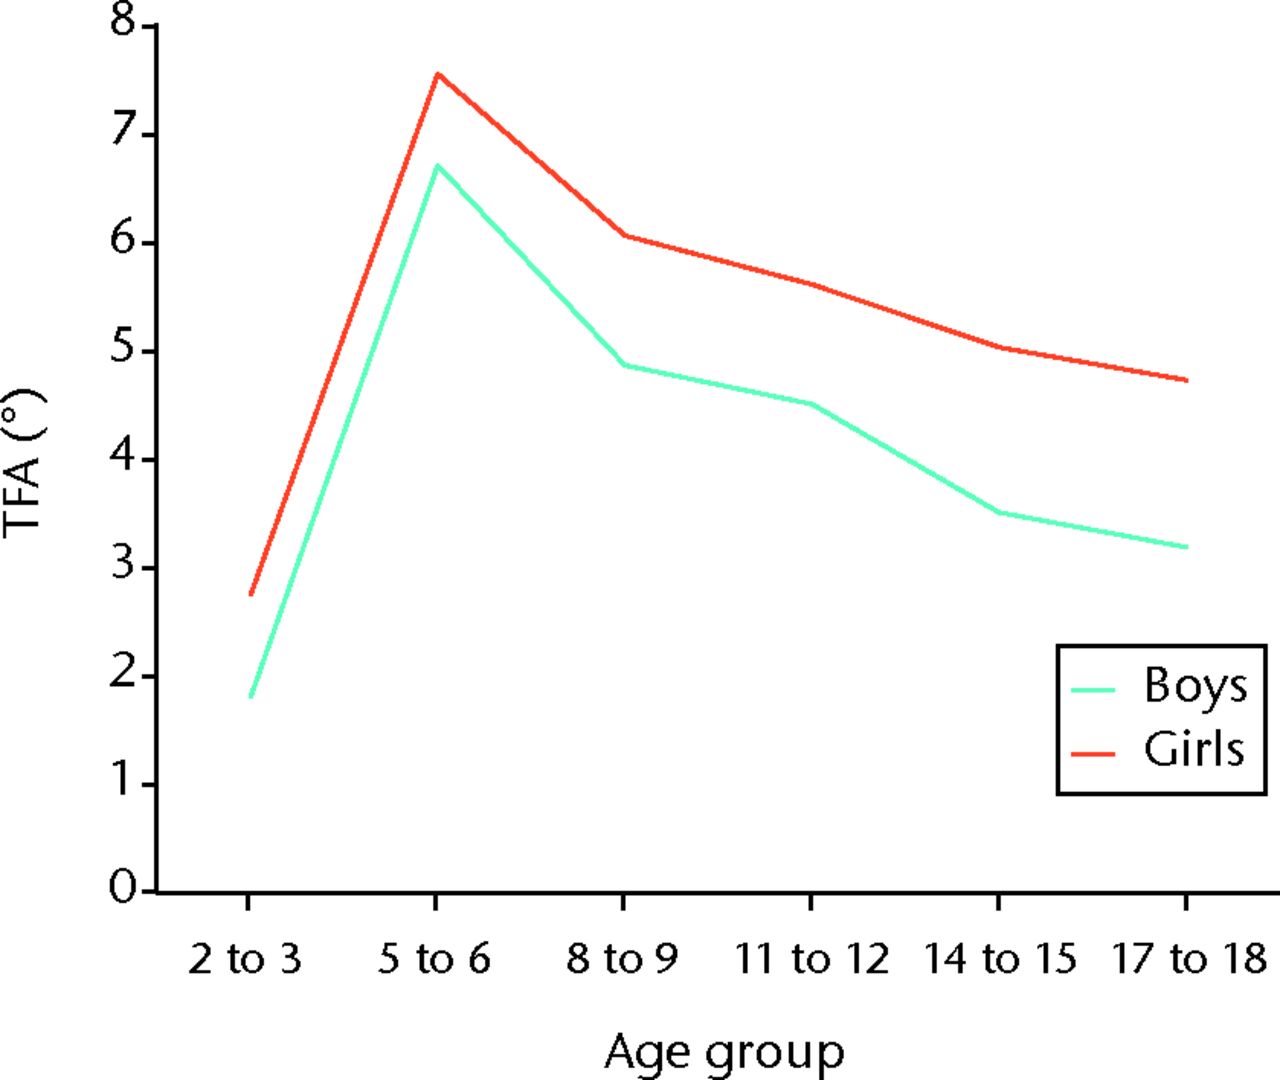
Fig. 6
Graph showing the mean tibiofemoral angle (TFA) in age group and gender.
The mean IMD of the children in this study was 1.58 cm (sd 0.89). All those with ICD were recorded with a negative value. Only ten out of the 360 children measured demonstrated a varus angulation. A maximum IMD of 3.3 cm was seen in the five- to six-year age group.
On analysis we found that after the age of five years there was a significant negative correlation between age and the TFA (r = -0.5046, p < 0.001). A significant positive correlation was found between the IMD and the TFA (r = 0.7147, p < 0.001).
Also after the age of five years there was a significant negative correlation between TFA and standing height (r = -0.5065, p < 0.001), thigh length (r = -0.5116, p < 0.001) and length of the lower limb (r = -0.5095, p < 0.001).
Intra-observer reliability
The mean difference between the two readings of TFA in 20 children for intra-observer reliability was -0.15° (95% confidence interval (CI) -1.93 to +1.63). As zero is included in this range no systematic error exists. Since most of the points lay between the –1° and +1° axes, it demonstrated that the measurement of the clinical tibiofemoral angle showed minimal intra-observer variability (Fig. 5).
Discussion
In 1975, Salenius and Vankka2 published their data on the development of the TFA in healthy Caucasian children. They found a pronounced varus alignment of the knee before the age of one year, which changed to valgus between 18 months and three years. Thereafter the valgus corrected spontaneously to between 5° and 6°.2 Following this radiological study, the photographic technique was adopted by Heath and Staheli4 and clinical measurement with a goniometer by many investigators,3,5,6,8 with the advantages of low price, reliability, reproducibility and being radiation-free. We therefore chose the clinical measurement technique for the measurement of the TFA in this study.
The clinical technique using a standardised goniometer has the advantage of using fixed bony points over photographic and radiological techniques. In the previous studies the femoral and tibial axes were either marked with skin dots, or the goniometers were placed on imaginary lines.3,5,6,8 We believe that this was subject to error as the marking of imaginary lines may not be reliable and skin dots can stretch and get displaced. With the use of bony anatomical landmarks and also expandable rigid goniometers whose tips reach long enough to touch the landmarks, the measurement error is minimised. The reliability and minimal intra-observer variability of the measurement of the TFA in this study with custom-made extensions for a standardised goniometer has led us to propose its use in actual clinical practice.
The normal ranges of the TFA have been defined in Caucasian, Chinese, Korean, Nigerian, Turkish, Indian and Saudi children (Table II). However, these ranges have been shown to differ with respect to age, time to transition from infantile varus to valgus, peak valgus and gender variation in children of different ethnic groups.3-5,8,11-14
In our study we found that south Indian children aged > two years had a valgus angulation. Thus reversal of physiological varus in our population has already occurred before the age of two years. This observation was comparable with the first published study by Salenius and Vankka2 in Caucasian children and also Cheng et al,3 Heath and Staheli,4 Oginni et al,11 Saini et al8 and Rahman and Badahdah13 in Chinese, white, Nigerian, Indian and Saudi children, respectively. We found no children with varus at the two- to three-year transition period. Thus a varus angulation in a south Indian child over the age of two years would warrant further radiological evaluation, regular follow-up and appropriate management.
With respect to age of peak valgus angulation, south Indian children reached maximum valgus at a later age of five to six years when compared with Caucasian, white, Chinese, Nigerian and Saudi children.2-4,11,13Salenius and Vankka2 recorded peak valgus angulation in the Caucasians at two to three years of age, and Heath and Staheli4 reported greatest mean knock-knee of 8° at a mean age of four years. In the largest study by Cheng et al3 in 2630 Chinese children, a maximum IMD of 2.8 cm was observed at the age of three years. Oginni et al11 reported maximal and uniform knock-knees (-7.1° (sd 1.4)) between three and 3.5 years of age in Nigerian children, while Rahman and Badahdah13 reported maximum mean valgus of 9.46° (sd 0.85) at three to four years of age in Saudi children.
Our study showed that south Indian boys demonstrated peak valgus angulation of 6.7° (sd 1.3) while girls had a peak valgus of 7.25° (sd 0.64). This was comparable with the maximal valgus values described by Oginni et al11 in Nigerian children (-7.1° (sd 1.4)) and by Yoo et al12 in Korean children (7.8°). However, Chinese, Turkish and Saudi children had higher peak valgus values of 8°, 9.6° to 9.8° and 9.46° (sd 0.85), respectively.3,5,13
Our children showed a gradual decrease in angulation till maturity, reaching a mean valgus of 3.18° (sd 1.74) in boys and 4.43° (sd 0.68) in girls at 17 to 18 years of age. In comparison with studies that included older adolescents, our children had a lower valgus angulation at maturity than the Caucasian, European, Turkish and Korean children.2,5,6,12 Salenius and Vankka2 and Yoo et al12 described a final valgus of 5° to 6° in the Caucasian and Korean children. Cahuzac et al6 showed that in European children aged 10 to 16 years, girls had a constant valgus angulation of 5.5° while boys showed a gradual and significant decrease in the valgus angulation (4.4°) during the last two years of growth. Arazi et al5 found that Turkish children exhibited valgus angles of 6.6° and 7.5° in boys and girls, respectively, at the age of 17 years. These values were significantly higher than those noted in other populations. The authors considered this variation due to racial differences, techniques of measurement and observer-related factors.5 The lower valgus angulation demonstrated by our south Indian children at maturity could account for a higher incidence of varus osteoarthritis of the knees in our population. These values could serve as reference for the designing of joint prostheses and implants for this population.
Our study demonstrated that south Indian girls had a higher valgus angulation than boys (p < 0.001). This was similar to Cahuzac et al6 who showed that European boys between ten and 16 years were more bow-legged than the girls. Other authors showed no difference in the development of the TFA with respect to gender. Cheng et al3 and Heath and Staheli4 did not include adolescents, and therefore may have missed potential gender variations in these patients.
Saini et al8 investigated TFA development in 215 Indian children and found that physiological varus rarely persisted beyond two years of age. Mean peak knee valgus of almost 8° was seen at approximately six years of age. Thereafter, the valgus decreased and, after the age of ten years, stabilised at around 4° to 5° in most children. This study comprised a heterogeneous population including immigrants, patients’ relatives and children from mainly the northern states of India.8 In comparison, our study was in concordance regarding achieving valgus angulation by the age of two years. However our peak valgus and final adult values were lower than those reported by Saini et al.8 We attribute this to the possibility of racial differences and heterogeneous nature of the group studied by them.
Our study showed a significant correlation between the TFA and IMD. As the IMD increased, the TFA also increased in both boys and girls (r = 0.7147, p < 0.001). A maximum IMD of 3.3 cm was seen in five to six years of age. Cheng et al3 described their results in terms of ICD or IMD, noting these to be clinically easy to apply and reliable. In contrast, Cahuzac et al6 reported that the TFA was more accurate than a measurement of ICD/IMD, as the standard deviation of the ICD/IMD exceeded the mean value. Arazi et al5 also observed difficulties in measurement of ICD/ IMD, suggesting that the measurement of the TFA was easy and more reliable.5 We also felt that measurement of the TFA was more reliable and accurate. We experienced difficulties in measurement of the ICD/ IMD and found that slight variation in position of the subject caused significant change in the values. In spite of obtaining a significant moderate correlation between the IMD and TFA, we did not feel it could reliably replace the clinical measurement of TFA.
Significant correlation was also seen between the standing height, thigh length, length of the lower limbs and the TFA. From the age of five years the TFA decreased with increases in standing height, thigh length and length of the lower limb (all p < 0.001). Saini et al8 did not note any significant correlation of the TFA and height. We attribute a significantly lower TFA in adolescent boys than girls due to their increased height, although no correlation was seen regarding weight, sitting height or leg length. Arazi et al5 did however obtain a fair degree of correlation between weight and TFA.5 Cahuzac et al6 felt that obesity did not increase the TFA or IMD, but found the largest intermalleolar distances in overweight children, possibly due to differences in soft-tissue thickness at the knee.
Only ten (2.7%) of the 360 children measured demonstrated a varus angulation. These children were between four and 17 years of age and formed less than the first percentile. We considered these as pathological varus, which may be related to nutritional or metabolic causes and would require further evaluation.
Limitations in our study included a lack of data for children aged < two years. We found it difficult to measure the TFA and other length-related variables in children aged younger than two years as the limbs were small and they were too restless for accurate measurements. Since the children in our study showed valgus angulation, the reversal of knee angles from physiological varus to valgus occurs before two years of age and therefore outside the boundaries of this study. We also did not include urban children in our study as they comprised a heterogeneous population.
Conclusion
This study shows that healthy south Indian children above of the age of two years have a valgus angulation. Thus reversal of physiological varus in our population occurs by the age of two years. Peak valgus angulation is seen at five to six years of age. Thereafter the valgus angulation gradually decreases till maturity. Girls show higher valgus angulation than boys. Since this study defines the normal range of the TFA in boys and girls and also the standard deviation, it helps divide normal physiological variations from pathologic ones. A child showing values outside the two standard deviations would thus require careful evaluation. Our data also serves as guidelines for those embarking on deformity correction in the paediatric age group, with values for older adolescents serving as useful data for the design of prostheses and implants, as they seem to be significantly different from other populations. This study establishes a modified technique for the clinical measurement of TFA that is reliable, reproducible and suitable for clinical practice.
The authors would like to thank Dr A. Livingston and Ms Legashri for their assistance in data collection and also Mr. P. Samuel for performing the statistical analysis of this study. Without their professional help this study could not have been completed.
1 Sherman M . Physiologic bowing of the legs. South Med J1960;53:830–836.CrossrefPubMed Google Scholar
2 Salenius P , VankkaE. The development of the tibiofemoral angle in children. J Bone Joint Surg [Am]1975;57-A:259–261.PubMed Google Scholar
3 Cheng JC , ChanPS, ChiangSC, HuiPW. Angular and rotational profile of the lower limb in 2,630 Chinese children. J Pediatr Orthop1991;11:154–161.CrossrefPubMed Google Scholar
4 Heath CH , StaheliLT. Normal limits of knee angle in white children: genu varum and genu valgum. J Pediatr Orthop1993;13:259–262. Google Scholar
5 Arazi M , OğünTC, MemikR. Normal development of the tibiofemoral angle in children: a clinical study of 590 normal subjects from 3 to 17 years of age. J Pediatr Orthop2001;21:264–267.PubMed Google Scholar
6 Cahuzac JP , VardonD, Sales de GauzyJ. Development of the clinical tibiofemoral angle in normal adolescents: a study of 427 normal subjects from 10 to 16 years of age. J Bone Joint Surg [Br]1995;77-B:729–732. Google Scholar
7 Sharrard WJ . Knock knees and bow legs. Br Med J1976;1:826–827.CrossrefPubMed Google Scholar
8 Saini UC , BaliK, ShethB, GahlotN, GahlotA. Normal development of the knee angle in healthy Indian children: a clinical study of 215 children. J Child Orthop2010;4:579–586.CrossrefPubMed Google Scholar
9 Kaspiris A , GrivasTB, VasiliadisE. Physiological alignment of the lower limbs changes during childhood: a clinical study in south-west Greece. Adv Biomed Res2010;1:249–251. Google Scholar
10 Balasubramanian P , MadhuriV, MuliyilJ. Carrying angle in children: a normative study. J Pediatr Orthop B2006;15:37–40.CrossrefPubMed Google Scholar
11 Oginni LM , BadruOS, SharpCA, DavieMW, WorsfoldM. Knee angles and rickets in Nigerian children. J Pediatr Orthop2004;24:403–407.CrossrefPubMed Google Scholar
12 Yoo JH , ChoiIH, ChoTJ, YooWJ. Development of tibiofemoral angle in Korean children. J Korean Med Sci2008;23:714–717.CrossrefPubMed Google Scholar
13 Rahman SA , BadahdahWA. Normal development of the tibiofemoral angle in Saudi children from 2 to 12 years of age. World Appl Sci J2011;12:1353–1361. Google Scholar
14 Omololu B , TellaA, OgunladeSO, et al.Normal values of knee angle, intercondylar and intermalleolar distances in Nigerian children. West Afr J Med2003;22:301–304.CrossrefPubMed Google Scholar
Funding statement:
The study was funded by the internal resources of the Christian Medical College, Vellore, India
Author contributions:
S. E. Mathew: Conducted the study, Data collection, Data analysis, Writing the paper
V. Madhuri: Concept, Planning, Study design, Writing the paper
ICMJE Conflict of Interest:
None declared
©2013 The British Editorial Society of Bone & Joint Surgery. This is an open-access article distributed under the terms of the Creative Commons Attributions licence, which permits unrestricted use, distribution, and reproduction in any medium, but not for commercial gain, provided the original author and source are credited.
