


Abstract
Objectives
There remains a lack of data on the reliability of methods to estimate tibial coverage achieved during total knee replacement. In order to address this gap, the intra- and interobserver reliability of a three-dimensional (3D) digital templating method was assessed with one symmetric and one asymmetric prosthesis design.
Methods
A total of 120 template procedures were performed according to specific rotational and over-hang criteria by three observers at time zero and again two weeks later. Total and sub-region coverage were calculated and the reliability of the templating and measurement method was evaluated.
Results
Excellent intra- and interobserver reliability was observed for total coverage, when minimal component overhang (intraclass correlation coefficient (ICC) = 0.87) or no component overhang (ICC = 0.92) was permitted, regardless of rotational restrictions.
Conclusions
Measurement of tibial coverage can be reliable using the templating method described even if the rotational axis selected still has a minor influence.
Article focus
We aimed to assess the intra- and interobserver reliability of a three-dimensional digital templating method based on CT reconstruction for evaluating tibial coverage in total knee replacement (TKR)
It was hypothesised that the method was reliable, regardless of the reference axis used to align the tibial implant
Key messages
Contemporary methods for TKR increasingly rely on digital technologies for pre-operative planning. However the reliability of these methods with respect to tibial coverage remains unknown
This study addresses this gap in the current knowledge and describes a robust method for templating tibial coverage using CT-derived models of tibiae and various tibial components
Further work is required to explore the optimisation between tibial coverage, particularly of the cortical shell, and component rotation when aligning the component to the resected bone surface
Strengths and limitations
The results are founded on robust methods of templating with immediate clinical utility and a detailed statistical analysis with respect to intra- and interobserver reliability
Further work with a larger sample size is required to generalise to the wider population and with the vast variety of tibial components available
The definition of ‘coverage’ in the present context requires more precise delineation for the assessment of the efficacy of tibial components
Introduction
Interest in templating based on three-dimensional (3D) imaging has recently emerged in parallel with the growing enthusiasm for patient-specific instrumentation. The accurate placement of components on the tibia is important to achieve maximum coverage of the resected plateau, thereby imparting good initial implant stability,1-3 enhancing load transfer across the proximal tibia1,4-6 and decreasing the potential for implant subsidence.1,2,7
In order to optimise patellofemoral tracking, a number of studies have reported rotation with reference to the medial margin of the anterior tibial tuberosity (ATT)8 or to the posterior condylar axis of the tibia.9 Many other axes of reference have been described, such as the mid-sulcus of the tibial spine,10 the distal reference axes of the foot or ankle9,11,12 or the femoral transepicondylar axis (TEA).13,14 However, the literature suffers from a lack of consensus regarding the effect of rotational alignment on coverage.15 The controversy could be related to differences in methods, but importantly the reliability of the templating and measurement method employed is consistently not reported.7,16-18
Various templating methods have been used to estimate the theoretical tibial coverage afforded by different prosthesis designs.7,16-18 Two-dimensional (2D) tibial models created from photographed resection specimens obtained during TKR, from cadavers17 or digitised unmagnified radiographs of retrieved surgical specimens, have been described.2,16,19 However, the reliability of these 2D methods has never been reported, and could be questioned due to the lack of perspective and the obstruction of key anatomical landmarks when fitting the component template.
Modelling of the tibial structure in 3D has been described in cadaveric specimens,7 but surprisingly no recent publications have focused on digital templating of resected tibiae with contemporary modelling methods. We describe such a method based on low-dose CT imaging combined with 3D modelling. As with every new method, demonstrated reliability is a fundamental parameter before application to the clinical setting, in contrast to previous efforts.
In order to address the gap in the current literature, the purpose of this study was to assess the intra- and interobserver reliability of a 3D digital templating method based on CT reconstruction for evaluating tibial coverage in TKR. Our hypothesis was that the method was reliable regardless of the reference axis used to align the tibial implant.
Materials and Methods
Patients
Five patients awaiting TKR with pre-operative CT data were selected for the purposes of generating 3D tibial models. All five patients had tri-compartmental osteoarthritis and varus deformity. Three patients were male, and two were female. Their mean age was 70 years (57 to 82) and their mean body mass index was 31.8 kg/m2 (21.7 to 41.7). There were three right and two left knees.
Imaging and tibial model construction
Pre-operative CT scans were performed on the affected limb for all five patients. The scan was low-dose (< 20 mSV) and comprised axial slices of the pelvis, acetabulum and femoral head, through to the bottom of the foot with 2 mm slice thickness and 512×512 pixel resolution (Aquilion, Toshiba, Japan). The CT data were acquired in Dicom format and further processed using ImageJ software (National Institutes of Health, Bethesda, Maryland), where image stacks were created before being imported into ScanIP (Simpleware LTD, Exeter, United Kingdom). In ScanIP, the axial images of the tibiae were manually segmented and an unmeshed surface of each tibia generated. The data was down-sampled to a voxel range of 3×3×3 mm to 5×5×5 mm to optimise between level of detail and computational time. After down-sampling, smoothed 3D bony surfaces of the tibia were created, which were imported into SolidWorks CAD software (Dassault Systèmes SolidWorks Corporation, Waltham, Massachussetts) for the templating process.
Tibial model preparation
After import into SolidWorks, each model was digitally resected 10 mm below the articular surface, using the lowest point on the lateral tibial plateau as a reference point. The resection was made perpendicular to the long axis of the tibia in order to simulate the tibial cut made intra-operatively during TKR (Fig. 1). Following resection, each tibial plateau was digitally marked in the axial view with two axes of rotation for reference during templating (Fig. 2). The anterior tibial tubercle axis (ATT) was defined by a line connecting the centre of the posterior cruciate attachment on the tibia and a point located at the medial third of the anterior tibial tubercle. The two points were determined for each tibia by mutual agreement between three orthopaedic surgeons (AJC, SL and JCB). The posterior condylar axis (PCA) was defined by a line drawn perpendicular to the middle of a second line connecting the most posterior points on the medial and lateral tibial condyles respectively.
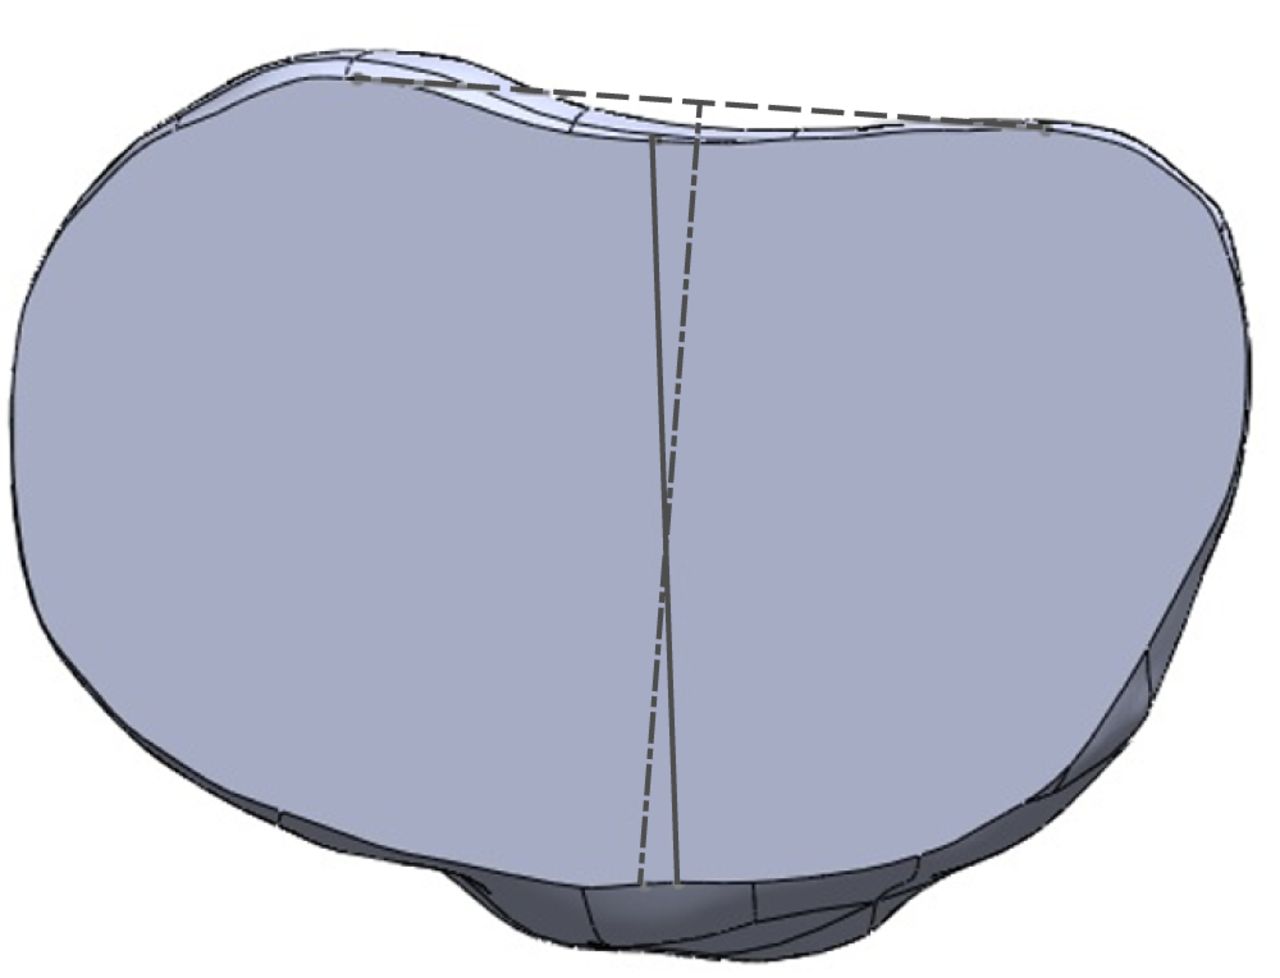
Fig. 2
Diagram showing the anterior tibial tubercle axis (ATT; solid grey line) and the posterior condylar axis (PCA; dashed line).
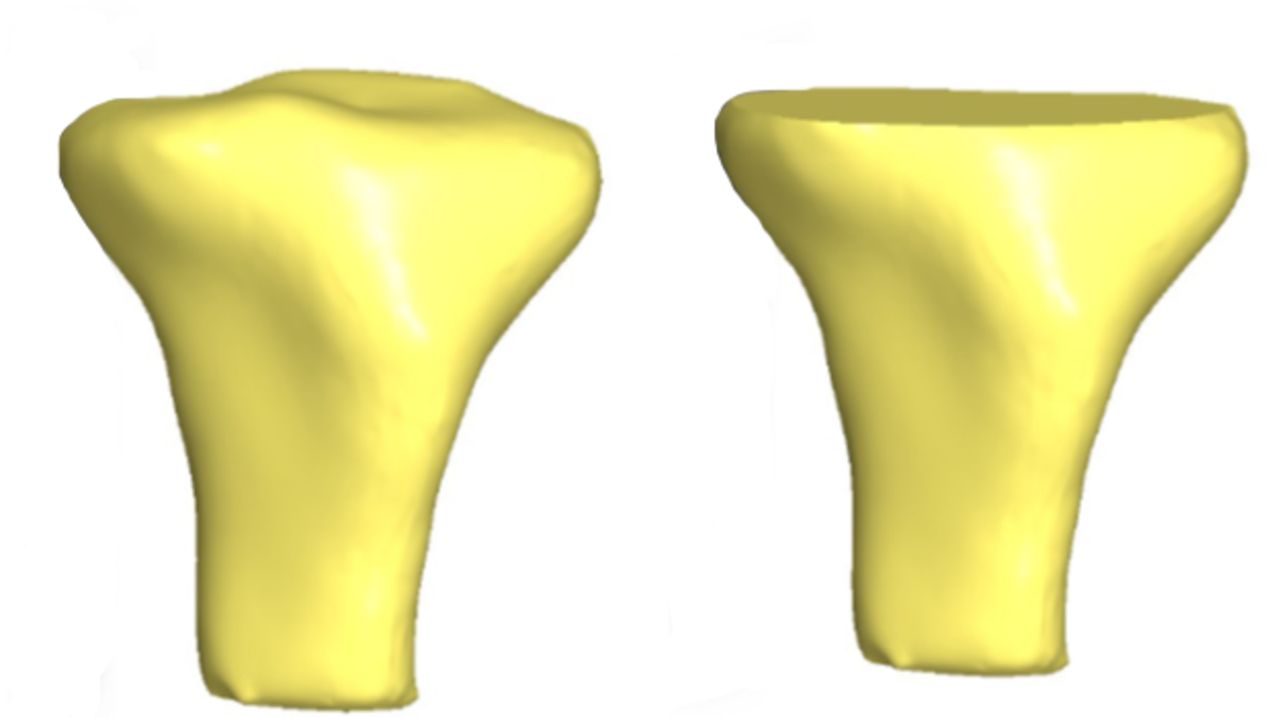
Fig. 1
Three-dimensional CT reconstructions before (left) and after resection (right).
Each tibia was also marked to define sub-regions of interest including the anterior, posteromedial and posterolateral regions (Fig. 3). To define these sub-regions, a medial to lateral line was drawn perpendicular to the posterior condylar axis line. This line was then shifted in the anterior-posterior direction until the widest medial to lateral portion of the tibia was located, which was termed the ML line. From the midpoint of the ML line, two additional lines were drawn at 60° in the posteromedial (PM line) and posterolateral directions (PL line).
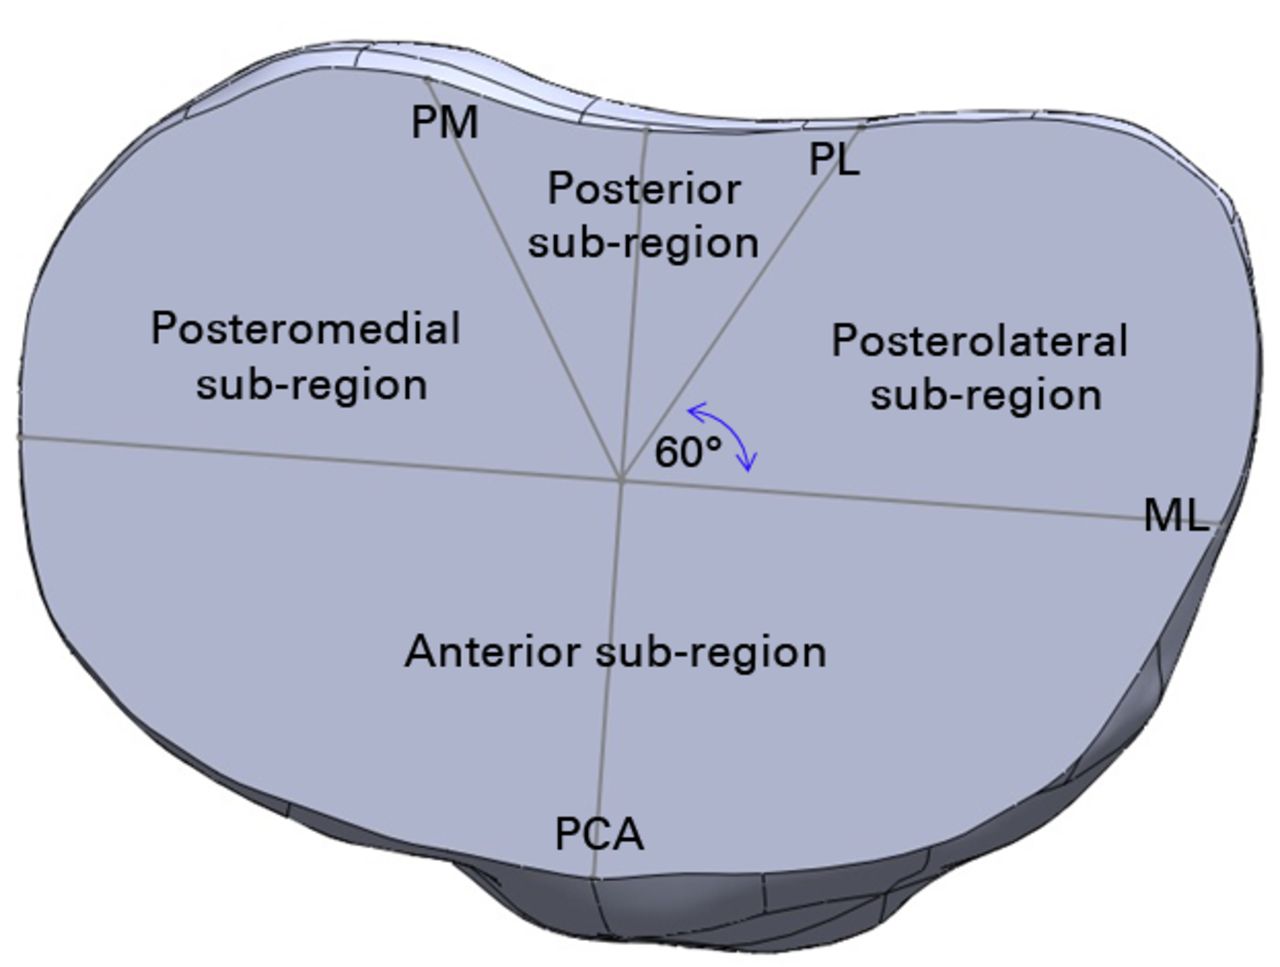
Fig. 3
Diagram showing the sub-regions of interest (PM, posteromedial line; PL, posterolateral line, ML, mediolateral line; PCA, posterior condylar axis).
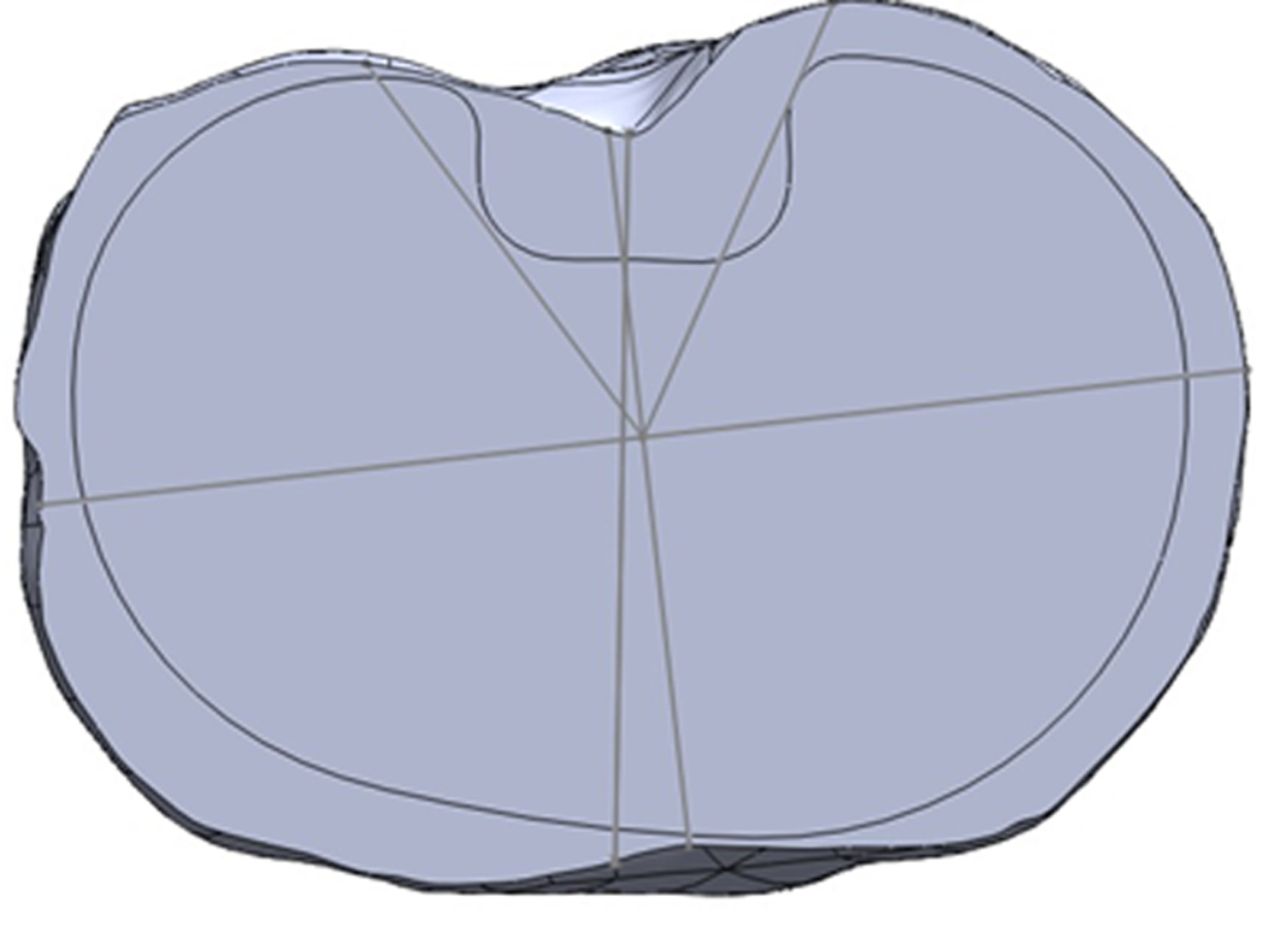
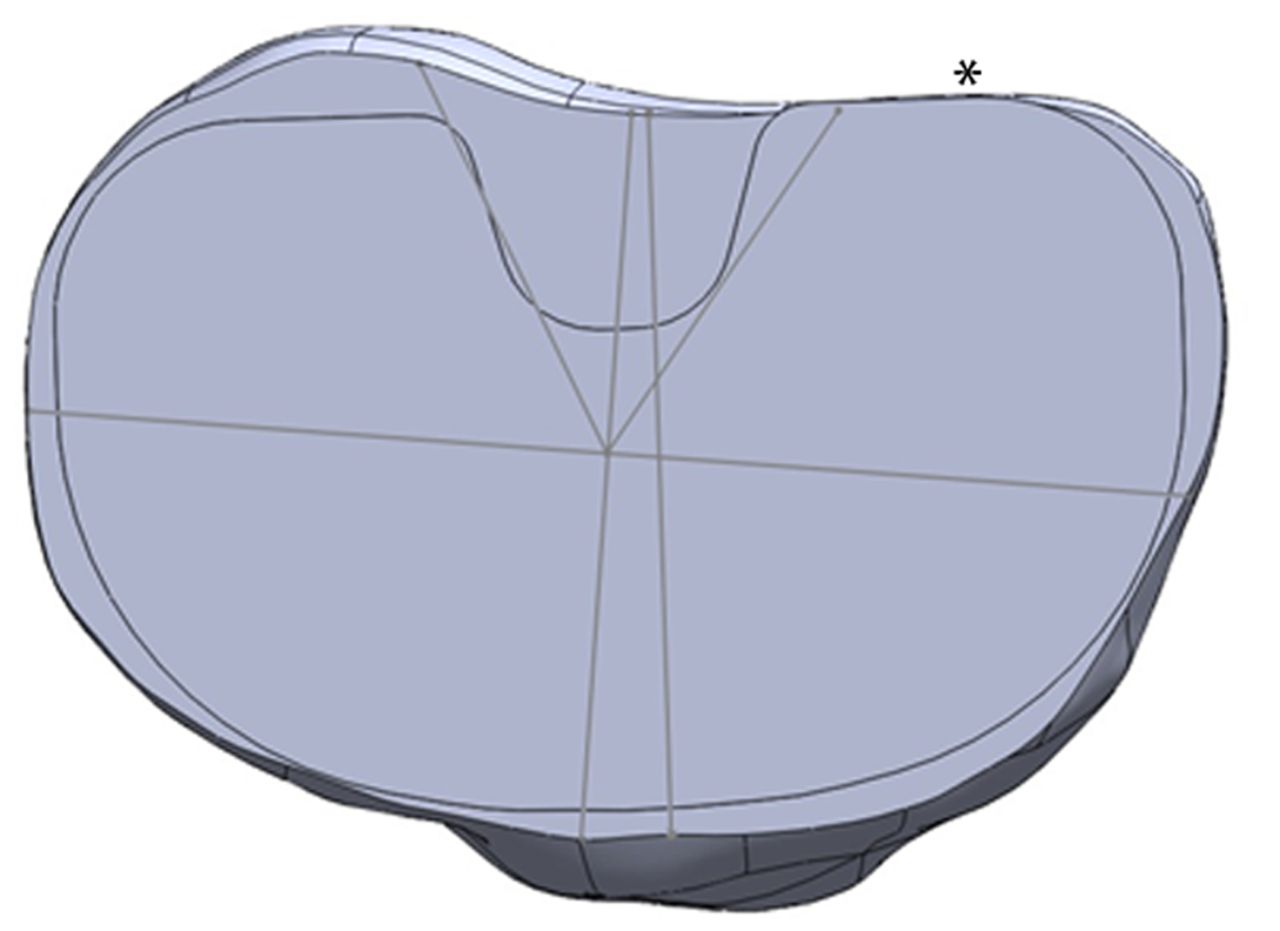
Figs. 4a - 4b
Diagrams showing the tibia template, with a) the asymmetric prosthesis aligned with the surgical axis, with no overhang permitted, and b) the symmetric prosthesis aligned with the surgical axis, with minimal posterolateral overhang permitted (*).
Prostheses, rotation and overhang definition
Digital tibial tray templates for one symmetric design (NexGen; Zimmer, Warsaw, Indiana), and one asymmetric design (Genesis II; Smith & Nephew, Memphis, Tennessee) were obtained directly from the manufacturers, with a range of tray sizes and corresponding areas (Table I). Each tray template was marked with a line drawn perpendicular to the rotational reference notch on the anterior aspect of the tray, to standardise rotation. Tibial coverage was tested with three different rotational axes, along with two different over-hang conditions, for a total of six rotation-overhang combinations. The three rotational axes were the anterior tibial tubercle axis (ATT), posterior condylar axis (PCA) and a third axis called the best fit axis (BFA). For the BFA, the tray was free to rotate in any axis in the axial plane to obtain maximal coverage. The first over-hang condition was no-overhang (NO), where no portion of the tray template could exceed the boundary of the resected tibia (Fig. 4a). The second condition was minimal-overhang (OV), where over-hang was permitted provided it was < 2 mm from the edge of the tray to the tibial cortex and did not occur anteriorly or medially (Fig. 4b). Provided the rotation and over-hang criteria were met in each combination, observers were free to select whichever tray size deemed most appropriate and also translate the tray in the medial-lateral and anterior-posterior directions to maximise coverage.
Table I
Number of available tibial trays and area range for each prosthesis tested
| Prosthesis | Available trays (n) | Prosthesis area range (mm2) |
|---|---|---|
| NexGen | 10 | 1936 to 4093 |
| Genesis II | 8 | 1886 to 3900 |
Prosthesis templating
Three orthopaedic surgeons (AJC, SL and JCB) independently templated the five tibiae with both trays on two separate occasions. Each selected tray was placed directly on the resected surface of the tibia in the axial plane. Rotation of the tray on the tibia was controlled to ensure that the tray was aligned with the correct rotational axis. For the best-fit condition, the tray was positioned on the resected surface in the axial plane but the surgeon was permitted to rotate the tray along any rotational axis in this plane. All six possible combinations of rotation and over-hang were templated by each surgeon for all five tibiae using both trays at time zero and again two weeks later. Adherence to rotation and over-hang restrictions was confirmed by an independent observer (MF) at the completion of each templating session. Any templated tibiae deemed unacceptable according to the described criteria were re-templated by the same surgeon.
Tibial coverage
The “Section Properties” function (within the SolidWorks software) was used to define and measure the area covered and uncovered by the tray. Tibial coverage was calculated as a proportion of the total area and for each of the sub-regions.
Statistical analysis
The intraclass correlation coefficient (ICC) and the Typical Error of Measurement (TEM, in mm2) were used to describe both inter- and intra-observer reliability of coverage calculations.20 The typical error of measurement indicates the amount of change in coverage associated with the templating and measurement method and reflects the threshold for detection of real differences between conditions. The ICC values were interpreted according to published guidelines,21 where an ICC value of < 0.4 indicates poor reproducibility, a value between 0.4 and 0.75 indicates fair to good reproducibility, and a value > 0.75 indicates excellent reproducibility. All statistical calculations were performed in Microsoft Excel (Microsoft, Waltham, Massachussetts).
Results
In total, each surgeon completed 120 template procedures in accordance with the criteria and conditions described.
Excellent intra-observer reliability (ICC ≥ 0.94; TEM ≤ 18.1 mm2) was observed when the trays were aligned to the ATT axis in the NO condition (Table II). Of the sub-regions, the posteromedial region displayed lower TEM (3.4 mm2 to 8.8 mm2) compared with the anterior region (15.1 mm2 to 18.1 mm2). A similar pattern was observed for the OV condition (Table II), with excellent reliability overall (ICC ≥ 0.95; TEM ≤ 17.2 mm2) and differences in TEM between anterior (12 mm2 to 17.2 mm2) and posteromedial (2.9 mm2 to 6.6 mm2) sub-regions.
Table II
Typical error of measurement (TEM) and intraclass correlation (ICC) for intra-observer reliability of coverage with trays aligned to the anterior tibial tubercle axis (CI, confidence interval; PM, posteromedial; PL, posterolateral; Obs, observer)
| No overhang | Overhang | ||||
|---|---|---|---|---|---|
| TEM (mm2) (95% CI) | ICC (95% CI) | TEM (mm2) (95% CI) | ICC (95% CI) | ||
| PM | |||||
| Obs1 | 7.8 (5.4 to 14.3) | 0.99 (0.95 to 1.0) | 6.6 (4.6 to 12.1) | 0.99 (0.95 to 1.0) | |
| Obs2 | 8.8 (6.0 to 16.0) | 0.98 (0.94 to 1.0) | 6.6 (4.5 to 12.0) | 0.99 (0.95 to 1.0) | |
| Obs3 | 3.4 (2.3 to 6.1) | 1 (0.99 to 1.0) | 2.9 (2.0 to 5.4) | 1 (0.99 to 1.0) | |
| PL | |||||
| Obs1 | 13.3 (9.2 to 24.3) | 0.94 (0.78 to 0.98) | 16.3 (11.2 to 29.7) | 0.95 (0.82 to 0.99) | |
| Obs2 | 12.1 (8.3 to 22.0) | 0.97 (0.87 to 0.99) | 6.7 (4.6 to 12.2) | 0.99 (0.97 to 1.0) | |
| Obs3 | 9.6 (6.6 to 17.5) | 0.98 (0.91 to 0.99) | 10.6 (7.3 to 19.3) | 0.98 (0.93 to 1.0) | |
| Anterior | |||||
| Obs1 | 17.1 (11.7 to 31.2) | 0.98 (0.91 to 0.99) | 12 (8.2 to 21.8) | 0.99 (0.96 to 1.0) | |
| Obs2 | 18.1 (12.4 to 33.0) | 0.97 (0.9 to 0.99) | 17 (11.7 to 31.0) | 0.98 (0.93 to 1.0) | |
| Obs3 | 15.1 (10.4 to 27.6) | 0.98 (0.93 to 1.0) | 17.2 (11.9 to 31.5) | 0.98 (0.93 to 1.0) | |
| Total | |||||
| Obs1 | 9.4 (6.5 to 17.2) | 1 (0.99 to 1.0) | 6.7 (4.6 to 12.3) | 1 (1.0 to 1.0) | |
| Obs2 | 11.2 (7.7 to 20.5) | 1 (0.98 to 1.0) | 7.1 (4.9 to 13.0) | 1 (1.0 to 1.0) | |
| Obs3 | 5.8 (4.0 to 10.6) | 1 (-) | 9.7 (6.6 to 17.6) | 1 (0.99 to 1.0) | |
When the trays were aligned to the PCA, excellent intra-observer reliability was observed for total and sub-region coverage in the NO (ICC ≥ 0.76; TEM ≤ 22.4 mm2) and OV (ICC ≥ 0.85; TEM ≤ 25.7 mm2) conditions. Intra-observer reliability of total coverage was comparable with the ATT condition, although ICCs were lower and TEM higher for sub-region coverage in the PCA condition (Table III). Nevertheless, a similar pattern was observed across both rotation-coverage combinations, with differences in TEM between anterior and posteromedial sub-regions (Table III).
Table III
Typical error of measurement (TEM) and intraclass correlation (ICC) for intra-observer reliability of coverage with trays aligned to the posterior condylar axis (CI, confidence interval; PM, posteromedial; PL, posterolateral; Obs, observer)
| No overhang | Overhang | ||||
|---|---|---|---|---|---|
| TEM (mm2) (95% CI) | ICC (95% CI) | TEM (mm2) (95% CI) | ICC (95% CI) | ||
| PM | |||||
| Obs1 | 10.6 (7.3 to 19.4) | 0.94 (0.78 to 0.98) | 11.5 (7.9 to 20.9) | 0.86 (0.55 to 0.96) | |
| Obs2 | 8.7 (6.0 to 15.8) | 0.89 (0.61 to 0.97) | 8.7 (6.0 to 15.8) | 0.91 (0.69 to 0.98) | |
| Obs3 | 9.4 (6.5 to 17.7) | 0.89 (0.62 to 0.97) | 8.3 (5.7 to 15.1) | 0.92 (0.71 to 0.98) | |
| PL | |||||
| Obs1 | 11.3 (7.8 to 20.6) | 0.95 (0.81 to 0.99) | 15.2 (10.4 to 27.7) | 0.85 (0.51 to 0.96) | |
| Obs2 | 10.3 (7.1 to 18.8) | 0.88 (0.58 to 0.97) | 12.1 (8.3 to 22.1) | 0.91 (0.69 to 0.98) | |
| Obs3 | 16.1 (11.1 to 29.5) | 0.76 (0.29 to 0.93) | 16.4 (11.3 to 30.0) | 0.86 (0.55 to 0.96) | |
| Anterior | |||||
| Obs1 | 22.4 (15.4 to 40.9) | 0.96 (0.68 to 0.99) | 25.7 (17.7 to 47.0) | 0.95 (0.82 to 0.99) | |
| Obs2 | 21.3 (14.7 to 38.9) | 0.97 (0.89 to 0.99) | 17.2 (11.8 to 31.3) | 0.98 (0.91 to 0.99) | |
| Obs3 | 22 (15.1 to 40.2) | 0.97 (0.89 to 0.99) | 16.8 (11.5 to 30.6) | 0.98 (0.93 to 1.0) | |
| Total | |||||
| Obs1 | 9.0 (6.2 to 16.5) | 1 (0.99 to 1.0) | 11.3 (7.8 to 20.6) | 0.99 (0.96 to 1.0) | |
| Obs2 | 8.2 (5.36 to 14.9) | 1 (0.99 to 1.0) | 6.5 (4.5 to 11.8) | 1 (0.99 to 1.0) | |
| Obs3 | 7.2 (5.0 to 13.2) | 1 (0.99 to 1.0) | 6.1 (4.2 to 11.2) | 1 (0.99 to 1.0) | |
Intra-observer reliability of total coverage using the BFA to set rotation was excellent in the NO condition (ICC 1.0; TEM ≤ 12.1 mm2) (Table IV). Similarly, sub-region coverage reliability was good to excellent (ICC 0.58 to 0.98; TEM ≤ 25.7 mm2). In the OV condition, total coverage reliability was comparable (ICC 0.73 to 1.0), although TEM was larger than for other rotation-overhang combinations (≤ 64.7 mm2). A similar pattern was observed for sub-region reliability with ICC ranging from poor (0.25) to excellent (0.95) and higher TEM than for other conditions (≤ 45.6 mm2) (Table IV). Of note for the BFA condition was comparable reliability for the anterior and posteromedial sub-regions.
Table IV
Typical error of measurement (TEM) and intraclass correlation (ICC) for intra-observer reliability of coverage with trays aligned using the best fit condition (CI, confidence interval; PM, posteromedial; PL, posterolateral; Obs, observer)
| No overhang | Overhang | ||||
|---|---|---|---|---|---|
| TEM (mm2) (95% CI) | ICC (95% CI) | TEM (mm2) (95% CI) | ICC (95% CI) | ||
| PM | |||||
| Obs1 | 15.5 (10.6 to 28.2) | 0.93 (0.73 to 0.98) | 45.6 (31.4 to 83.2) | 0.25 (-0.42 to 0.74) | |
| Obs2 | 5.4 (3.7 to 9.8) | 0.98 (0.93 to 1.0) | 9.1 (6.3 to 16.7) | 0.94 (0.79 to 0.99) | |
| Obs3 | 12.4 (8.6 to 22.7) | 0.85 (0.5 to 0.96) | 19.4 (13.3 to 35.4) | 0.74 (0.25 to 0.93) | |
| PL | |||||
| Obs1 | 16.8 (11.5 to 30.6) | 0.88 (0.58 to 0.97) | 13.8 (9.5 to 25.1) | 0.91 (0.69 to 0.98) | |
| Obs2 | 10.4 (7.2 to 19.0) | 0.97 (0.87 to 0.99) | 9.1 (6.2 to 16.5) | 0.97 (0.87 to 0.99) | |
| Obs3 | 25.7 (17.7 to 47.0) | 0.58 (0 to 0.88) | 25.1 (17.3 to 45.8) | 0.60 (0 to 0.8) | |
| Ant | |||||
| Obs1 | 16 (10.9 to 29.1) | 0.98 (0.92 to 1.0) | 20.7 (14.2 to 37.7) | 0.93 (0.75 to 0.98) | |
| Obs2 | 17.5 (12.1 to 32.0) | 0.98 (0.94 to 1.0) | 18.8 (12.9 to 34.3) | 0.95 (0.81 to 0.99) | |
| Obs3 | 24.6 (16.9 to 44.9) | 0.96 (0.85 to 0.99) | 37.9 (26.1 to 69.2) | 0.77 (0.32 to 0.94) | |
| Total | |||||
| Obs1 | 12.1 (8.4 to 22.2) | 1 (0.98 to 1.0) | 64.7 (44.5 to 118.1) | 0.73 (0.22 to 0.92) | |
| Obs2 | 5.2 (3.6 to 9.5) | 1 (-) | 5.7 (3.9 to 10.5) | 1 (0.99 to 1.0) | |
| Obs3 | 5.1 (3.5 to 9.3) | 1 (-) | 9.2 (6.3 to 16.8) | 0.99 (0.98 to 1.0) | |
Interobserver reliability of coverage was superior when trays were aligned using the ATT axis in the NO condition (ICC 0.94 to 1.0; TEM 8.3 mm2 to 17.5 mm2) when compared with PCA (ICC 0.72 to 0.94; TEM 17 mm2 to 54.5 mm2) and BFA (ICC 0.48 to 0.98; TEM 23.3 mm2 to 47.1 mm2) (Table V). In contrast, this pattern was not replicated in the OV condition (Table V), with ICC ranging from good (0.6) to excellent (1.0) for all axes and ATT total coverage displaying the highest TEM (56.2 mm2) of any axis.
Table V
Typical error of measurement (TEM) and intraclass correlation (ICC) for interobserver reliability of coverage with trays aligned to the best fit axis (BFA) and the anterior tibial tubercle (ATT) and posterior condylar (PCA) axes (CI, confidence interval; PM, posteromedial; PL, posterolateral; Ant, anterior)
| No overhang | Overhang | ||||
|---|---|---|---|---|---|
| TEM (mm2) (95% CI) | ICC (95% CI) | TEM (mm2) (95% CI) | ICC (95% CI) | ||
| ATT | |||||
| PM | 8.3 (6.4 to 11.9) | 0.99 (0.96 to 1.0) | 14.4 (11.1 to 20.6) | 0.94 (0.85 to 0.98) | |
| PL | 17.5 (13.5 to 25.0) | 0.98 (0.93 to 0.99) | 13.3 (10.2 to 19.0) | 0.97 (0.92 to 0.99) | |
| Ant | 14.1 (10.9 to 20.2) | 0.94 (0.85 to 0.98) | 21.4 (16.5 to 30.7) | 0.97 (0.92 to 0.99) | |
| Total | 10.1 (7.8 to 14.4) | 1 (0.99 to 1.0) | 56.2 (43.3 to 80.4) | 0.92 (0.81 to 0.98) | |
| PCA | |||||
| PM | 17 (13.1 to 24.3) | 0.74 (0.45 to 0.92) | 7.4 (5.7 to 10.6) | 0.94 (0.84 to 0.98) | |
| PL | 30 (23.1 to 42.9) | 0.94 (0.84 to 0.98) | 11.2 (8.6 to 16.0) | 0.92 (0.80 to 0.98) | |
| Ant | 20.4 (15.7 to 29.1) | 0.72 (0.43 to 0.91) | 15.1 (11.6 to 21.6) | 0.98 (0.95 to 1.0) | |
| Total | 54.5 (42.0 to 78.1) | 0.87 (0.69 to 0.96) | 6.6 (5.1 to 9.4) | 1 (0.99 to 1.0) | |
| BFA | |||||
| PM | 30.4 (23.4 to 43.5) | 0.48 (0.12 to 0.81) | 24.5 (18.9 to 35.1) | 0.60 (0.26 to 0.86) | |
| PL | 23.3 (17.9 to 33.3) | 0.73 (0.43 to 0.91) | 13.2 (10.2 to 18.9) | 0.91 (0.78 to 0.97) | |
| Ant | 29.6 (22.8 to 42.4) | 0.94 (0.84 to 0.98) | 22.6 (17.4 to 32.4) | 0.92 (0.79 to 0.98) | |
| Total | 47.1 (36.3 to 67.4) | 0.93 (0.82 to 0.98) | 26.4 (20.3 to 37.8) | 0.95 (0.88 to 0.99) | |
Discussion
The main finding of this study was that excellent reliability of tibial coverage can be obtained using 3D CT reconstruction and digital templating. While aligning components with the ATT axis produced the most reliable results for sub-region coverage, other axes demonstrated more variability in these measurements. Increased variability was particularly evident when no rotational control was used. Measurement of tibial coverage is overall reliable using the templating method described even if the rotational axis selected still has a minor influence.To our knowledge, this is the first study to report on the reliability of a templating and measurement method for assessing tibial coverage in TKR.
Even if digital templating could potentially revolutionise the conduct of surgical planning or sizing in the future, caution should be applied when interpreting the results if the reliability of the measurement is not well documented.7,16-18 Moreover, there are several disadvantages to previously reported methods, being time consuming and labour intensive, often requiring cadavers or surgical resection specimens and being prone to magnification or other measurement errors.2,7,16-18 A previous study compared eight different tibial tray designs, including six symmetric and two asymmetric designs.17 However, limited details were given regarding the criteria for choosing the template size and position to calculate tibial coverage. Furthermore, no attempts were made to control for component rotation and the authors did not quantify the reliability of the technique. Others have reported differences in coverage between template designs despite repeating these methodological deficiencies. Westrich et al16 failed to describe the criteria for positioning the templates in the medial-lateral or anterior-posterior direction. Similarly, no attempts were made to determine the reliability of the templating and measurement technique. In another study,7 3D tibial models were generated from cadaveric specimens and templated digitally with tibial trays from one symmetric and one asymmetric prosthesis design. The criteria used to position the templates in this study were defined, in contrast to previous studies, however all templating was carried out by a single surgeon and no attempt was made to assess the reliability of the templating and measurement technique. As a result of these limitations, there remains no gold standard method to assess tibial coverage, making it difficult to compare the results. Potentially, the present study could serve this purpose for future investigations in this area.
There are several advantages to the templating and measurement method we describe compared with earlier efforts. Firstly, 3D digital tibial models were generated from CT scans. The use of CT scans over cadavers has numerous advantages in that the potential sample size is increased and demographic data more readily available.15 Furthermore, computer digitisation of data points eliminates magnification errors and allows for manipulation in space to view the knee in the ideal orientation. A recent study reported excellent reliability using 3D-CT reconstruction to measure the position and orientation of TKR components post-operatively,22 thereby presenting a potential vehicle for future validation of the templating and measurement method described here. Further, digital templating each tibia in the present study facilitated efficiency in templating, standardised coverage calculations and ensured rotational and over-hang criteria were strictly followed. Lastly, as digital templates are now readily available from manufacturers, design changes and newer prostheses can be easily evaluated and comparisons can be made to previously tested prostheses under identical experimental conditions. In this way, labour, research costs and potential errors associated with replicating previous manual measurements, or cadaveric studies can be reduced.
Despite the advantages of our reported technique, there are also limitations of the study to note, aside from access to software to perform the templating and calculations, which may be prohibitive for some groups. First, the small sample of five tibial models is not likely to be representative of the wide variation in tibial morphology encountered by the surgeon during TKR.23 However, templating a larger number of tibiae using the described technique is unlikely to improve the reliability reported here, although the findings would be more generalisable. Secondly, two prosthesis designs were tested, one symmetric and one asymmetric. Templating for different prosthesis designs may be less reliable, particularly if a larger spectrum of tibial models is tested. Thirdly, the concept of ‘coverage’ itself is not well-defined and its clinical application is hampered by a lack of consensus. Some have emphasised covering the entire resected surface,4,17 others have focused on optimising coverage in specific regions2,24-26 and still others have stressed coverage of the cortical shell.3,27 We demonstrated the satisfactory reliability of our method for total and sub-region surface of the total resected surface, but further studies will be required to assess cortical shell coverage. It is also important to note that we tested only two fixed rotational axes, the ATT and the PCA. There is currently no consensus with regard to the rotational alignment of the tibial component and the design might restrict the choice of rotational axis.15 The reliability of templating and measurement techniques may therefore vary considerably if other rotational axes are used.
Conclusions
In this study we demonstrated excellent reliability both within and between observers using a novel, 3D CT reconstruction-based digital templating method for assessing the total tibial coverage afforded by different prosthesis designs. The reliability of this templating method permits ready comparison of existing and future prosthesis designs. Future studies employing this method to assess sub-region coverage should use the ATT to control for component rotation.
1 Stulberg BN , DombrowskiRM, FroimsonM, EasleyK. Computed tomography analysis of proximal tibial coverage. Clin Orthop Relat Res1995;311:148–156.PubMed Google Scholar
2 Westrich GH , LaskinRS, HaasSB, SculcoTP. Resection specimen analysis of tibial coverage in total knee arthroplasty. Clin Orthop Relat Res1994;309:163–175.PubMed Google Scholar
3 Bindeglass D , CohenJ, DorrL. Current principles of design for cemented knees. Techn Orthop1991;6:80–85. Google Scholar
4 Figgie HE , DavyDT, HeipleKG, HartRT. Load-bearing capacity of the tibial component of the total condylar knee prosthesis: an in vitro study. Clin Orthop Relat Res1984;183:288–297. Google Scholar
5 Garg A , WalkerPS. The effect of the interface on the bone stresses beneath tibial components. J Biomech1986;19:957–967.CrossrefPubMed Google Scholar
6 Goldstein SA , WilsonDL, SonstegardDA, MatthewsLS. The mechanical properties of human tibial trabecular bone as a function of metaphyseal location. J Biomech1983;16:965–969.CrossrefPubMed Google Scholar
7 Lemaire P , PiolettiDP, MeyerFM, MeuliR, DörflJ, LeyvrazPF. Tibial component positioning in total knee arthroplasty: bone coverage and extensor apparatus alignment. Knee Surg Sports Traumatol Arthrosc1997;5:251–257.CrossrefPubMed Google Scholar
8 Insall JN, Easley ME. Surgery of the knee. Vol 2. Philadelphia: Churchill Livingstone, 2001. Google Scholar
9 Greenberg RL, Kenna RV, Hungerford DS, et al. Instrumentation for total knee arthroplasty. In: Hungerford DS, Krackow KA, Kenna RV, eds. Total knee arthroplasty: a comprehensive approach. Baltimore: Williams and Wilkins; 1984:35. Google Scholar
10 Dalury DF . Observations of the proximal tibia in total knee arthroplasty. Clin Orthop Relat Res2001;389:150–155.CrossrefPubMed Google Scholar
11 Insall JN. Surgical techniques and instrumentation in total knee arthroplasty. In: Insall J, Windsor R, Scott W, Kelly M, Aglietti P, eds. Surgery of the knee. Second ed. Vol. 2. New York: Churchill Livingstone; 1993:739. Google Scholar
12 Yoshioka Y , SiuDW, ScudamoreRA, CookeTD. Tibial anatomy and functional axes. J Orthop Res1989;7:132–137.CrossrefPubMed Google Scholar
13 Huddleston JI , ScottRD, WimberleyDW. Determination of neutral tibial rotational alignment in rotating platform TKA. Clin Orthop Relat Res2005;440:101–106.CrossrefPubMed Google Scholar
14 Barrack RL , SchraderT, BertotAJ, WolfeMW, MyersL. Component rotation and anterior knee pain after total knee arthroplasty. Clin Orthop Relat Res2001;392:46–55.CrossrefPubMed Google Scholar
15 Bonnin MP , SaffariniM, MercierPE, LaurentJR, CarrillonY. Is the anterior tibial tuberosity a reliable rotational landmark for the tibial component in total knee arthroplasty?J Arthroplasty2011;26:260–267.CrossrefPubMed Google Scholar
16 Westrich GH , AgulnickMA, LaskinRS, HaasSB, SculcoTP. Current analysis of tibial coverage in total knee arthroplasty. The Knee1997;4:87–91. Google Scholar
17 Incavo SJ , RonchettiPJ, HoweJG, TranowskiJP. Tibial plateau coverage in total knee arthroplasty. Clin Orthop Relat Res1994;299:81–85.PubMed Google Scholar
18 Wevers HW , SimurdaM, GriffinM, TarrelJ. Improved fit by asymmetric tibial prosthesis for total knee arthroplasty. Med Eng Phys1994;16:297–300.CrossrefPubMed Google Scholar
19 Westrich GH , HaasSB, InsallJN, FrachieA. Resection specimen analysis of proximal tibial anatomy based on 100 total knee arthroplasty specimens. J Arthroplasty1995;10:47–51.CrossrefPubMed Google Scholar
20 Hopkins WG . Measures of reliability in sports medicine and science. Sports Med2000;30:1–15.CrossrefPubMed Google Scholar
21 Rosner B. Fundamentals in biostatistics. Belmont: Doxbury Press, 2005. Google Scholar
22 Hirschmann MT , KonalaP, AmslerF, et al.The position and orientation of total knee replacement components. J Bone Joint Surg [Br]2011;93-B:629–633.CrossrefPubMed Google Scholar
23 Hashemi J , ChandrashekarN, GillB, et al.The geometry of the tibial plateau and its influence on the biomechanics of the tibiofemoral joint. J Bone Joint Surg [Am]2008;90-A:2724–2734.CrossrefPubMed Google Scholar
24 Alexiades M , SandsA, CraigSM, ScottWN. Management of selected problems in revision knee arthroplasty. Orthop Clin North Am1989;20:211–219.PubMed Google Scholar
25 Bloebaum RD , BachusKN, MitchellW, HoffmanG, HofmannAA. Analysis of the bone surface area in resected tibia. Implications in tibial component subsidence and fixation. Clin Orthop Relat Res1994;309:2–10.PubMed Google Scholar
26 Walker PS , GreeneD, ReillyD, et al.Fixation of tibial components of knee prostheses. J Bone Joint Surg [Am]1981;63-A:258–267.PubMed Google Scholar
27 Bartel DL , BursteinAH, SantaviccaEA, InsallJN. Performance of the tibial component in total knee replacement. J Bone Joint Surg [Am]1982;64-A:1026–1033.PubMed Google Scholar
Funding statement:
Financial support for this study was provided by the Sydney Orthopaedic Research Institute. Patient imaging was originally funded by Stryker South Pacific for an unrelated study.
Author contributions:
A. J. Costa: Data collection, Writing the paper
S. Lustig: Data collection, Writing the paper
C. J. Scholes: Concept development, Statistical analysis, Writing the paper
J-C. Balestro: Data collection, Manuscript approval
M. Fatima: Data collection, Data analysis, Writing the paper
D. A. Parker: Concept development, Manuscript approval
ICMJE Conflict of Interest:
None declared
©2013 British Editorial Society of Bone and Joint Surgery. This is an open-access article distributed under the terms of the Creative Commons Attributions licence, which permits unrestricted use, distribution, and reproduction in any medium, but not for commercial gain, provided the original author and source are credited.
