


Abstract
Satisfaction with care is important to both patients and to those who pay for it. The Net Promoter Score (NPS), widely used in the service industries, has been introduced into the NHS as the ‘friends and family test’; an overarching measure of patient satisfaction. It assesses the likelihood of the patient recommending the healthcare received to another, and is seen as a discriminator of healthcare performance. We prospectively assessed 6186 individuals undergoing primary lower limb joint replacement at a single university hospital to determine the Net Promoter Score for joint replacements and to evaluate which factors contributed to the response.
Achieving pain relief (odds ratio (OR) 2.13, confidence interval (CI) 1.83 to 2.49), the meeting of pre-operative expectation (OR 2.57, CI 2.24 to 2.97), and the hospital experience (OR 2.33, CI 2.03 to 2.68) are the domains that explain whether a patient would recommend joint replacement services. These three factors, combined with the type of surgery undertaken (OR 2.31, CI 1.68 to 3.17), drove a predictive model that was able to explain 95% of the variation in the patient’s recommendation response. Though intuitively similar, this ‘recommendation’ metric was found to be materially different to satisfaction responses. The difference between THR (NPS 71) and TKR (NPS 49) suggests that no overarching score for a department should be used without an adjustment for case mix. However, the Net Promoter Score does measure a further important dimension to our existing metrics: the patient experience of healthcare delivery.
Cite this article: Bone Joint J 2014;96-B:622–8.
Historically, clinical measures such as ‘lack of complications’ have been used to measure the success of operations. Recently, the focus has shifted towards patient reported outcomes measures (PROMs) to ascertain a patient’s perception of clinical success. Supporters of PROMs suggest they provide a remarkably sophisticated measure of whether a patient feels better – and by how much.1 Measuring patient satisfaction is a recent evolution of this trend. Interestingly, an apparently good clinical outcome does not reliably predict a satisfied patient.2,3
Patient satisfaction is more than a measure of an individuals’ happiness; it includes a measure of their experience of healthcare delivery2,4 and may, perhaps, be a method by which to assess patient safety and clinical effectiveness.5 The UK government has proposed that patient satisfaction tests should be routinely employed in healthcare delivery to expose unacceptable standards of care.6 A new ‘friends and family test’, where patients are asked whether they would recommend an intervention or service to a loved one, has recently been introduced to the UK National Health Service with the intention of using this measure to compare the performance of hospitals and departments, highlight problems and trigger improvements in services.6
This ‘friends and family test’ is essentially a variation of the ‘Net Promoter Score’ originally proposed by Reichheld7 in 2003, and is widely used in business.8 The Net Promoter Score works by quantifying whether the product/service provided results in repeat business by assessing the likelihood that the customer will recommend that product/service to others.
The Net Promoter Score is a single metric that quantifies the response to a single direct survey question: How likely are you to recommend this service? Three categories of responder are identified and classified as ‘promoters’ (those who would definitely recommend and use the service again), ‘passives’ (who are broadly happy, but would not actively promote the service) and ‘detractors’ (who actively discourage others to experience the service). The overall score is simply calculated from the percentage of promoters minus the percentage of detractors (excluding the passives). Scores range from -100 (everyone is a detractor) to +100 (everyone is a promoter). In industry, a positive score is well regarded, and scores over 50 are thought to highlight good performance.9 The original description used a ten-point response scale, though subsequently a five-point response scale has been promoted.10,11 Most institutions now use the shorter response scale, and this is the format the NHS ‘friends and family test’ will adopt.
The ‘friends and family test’ is promoted by the UK government as an easy to understand question asked of patients about the care they have received, that reliably discriminates between good and poor experiences and should drive improvements by allowing the public to compare hospitals and providers.12 A single question metric forces patients to decide whether they are happy or not overall with the care they received. The use of a single metric in the NHS is broadly supported, although the appropriateness of using a ‘recommendation’ question to evaluate healthcare provision has been questioned, with some suggesting that patients may react badly to the concept of recommending treatment in the healthcare setting.13
The aims of this study were to quantify Net Promoter Scores for joint replacement and ascertain how our care benchmarked against other non-healthcare related services and to assess which factors influenced our patient’s recommendation response.
Patients and Methods
Over a five-year period (January 2007 to December 2011) we prospectively collected data for all patients undergoing primary total hip or knee replacement (THR and TKR) at a single orthopaedic centre. Regional ethics approval was obtained (ref: 11/AL/0079). Surgery was carried out by a multiplicity of consultant orthopaedic surgeons and their supervised trainees. All data was collected independently from the clinical teams by the associated university outcomes assessment unit.
As the intended use of this metric is to compare departments and services, we evaluated both THR and TKR to ascertain whether the surgical procedure undertaken had any influence on the eventual recommendation score (assuming that the patient experience of healthcare delivery at our unit was otherwise identical), not to investigate differences between the procedures.
During the study period, 6912 patients underwent hip or knee replacement. Questionnaires were completed by 6186 (89.5%) patients (3265 THR and 2921 TKR). All data were included in the analysis. We also recorded the patient’s age, gender and presence of co-morbidities and post-operative length of stay. The patient’s clinical outcome and satisfaction were assessed using patient-reported questionnaires.
The Oxford Hip or Knee Score14,15and Medical Outcomes Study Short Form 12 (SF-12) health assessment16were completed by all patients pre-operatively and then by postal follow-up at six and 12 months post-operatively.
After 12 months, patients were asked to rate their overall satisfaction with their operated hip or knee on a four-point scale (very satisfied, satisfied, unsure or dissatisfied). They were also asked to rate specific facets of their surgical outcome with the following questions, answered on a six-point scale (excellently, very well, well, fairly, poorly, don’t know):
1) How well did the surgery relieve the pain in your affected joint? 2) How well did the surgery increase your ability to perform regular activities? 3) How well did the surgery allow you to perform heavy work or sport activities? 4) How well did the surgery meet your expectations?
Patients indicated their satisfaction with the care they received at the hospital with the question: 5) Rate your overall hospital experience using the response scale; excellent; very good; good; fair; poor or unknown. These responses were scored from 1 (excellently) to 5 (poorly), excluding the ‘don’t knows’.
We also asked: Would you recommend this operation to someone else? with the possible responses of: definitely yes; possibly yes; probably not; certainly not; or not sure. The patient response to this question was coded to the Net Promoter Score using previously described methodology for the validated five-point response version of the Net Promoter Score;10 definitely yes (1), probably yes (2), unsure (3), probably not (4), definitely not (5). A score of 1 is classified as a promoter, 2 as passive and 3–5 as a detractor.17
Statistical analysis
Data were assessed with SPSS version 17 (IBM, Armonk, New York). Data were not normally distributed and therefore variables are presented as median and inter-quartile ranges (IQRs). Differences in PROMs by Net Promoter classification were assessed using the Kruskall–Wallis test. Where significant differences were found, post-hoc testing was undertaken using the Mann–Whitney U-test. In order to reduce the risk of a type I error, the alpha level was set at 0.01. Logistic regression analysis was performed in order to determine which factors could predict an outcome of ‘promoter’ and ‘detractor’ at one year post-surgery. Multivariate modelling, using stepwise conditional entry, was employed. The entry criteria were set at 0.01 and the removal criteria was set at 0.1.
Results
The overall Net Promoter Score for joint replacement was 60, individual scores for THR and TKR were 71 and 49 respectively (Table I) indicating that different procedures generate different subsequent recommendation responses. A significantly greater proportion of THR patients were classified as promoters (compared with TKR patients), and significantly more TKR patients classified as detractors compared with THR patients (Table II, p < 0.001). Patients classified as ‘promoter’ were more likely to be male (χ2 = 21.389, p < 0.001). The detractors reported an extra co-morbidity compared with the promoters (p < 0.001). The length of post-operative stay was statistically greater in the detractor group, though this reflected the large data volume, as the mean number of days was the same between promoters and detractors (Table II).
Table I
Net Promoter Scores for various product/service providers
| Service | Net Promoter Score |
|---|---|
| Total hip replacement | 71 |
| Apple iPhone (mobile phone) | 69 |
| First Direct (banking) | 61 |
| Total knee replacement | 49 |
| Sony (technology) | 44 |
| Samsung (technology) | 36 |
| Nationwide (banking) | 33 |
| AA (motor insurance) | 26 |
| Direct Line (motor insurance) | 20 |
| Blackberry (mobile phone) | 18 |
| Virgin media (internet provider) | 16 |
| Sky (internet provider) | 15 |
| BUPA (health Insurance) | 7 |
| Pruhealth (health insurance) | -9 |
-
Additional data from Satmetrix European Benchmarking Survey, 2012.17 Examples of best-performing companies in health insurance, mobile phone, banking, technology, motor insurance and internet provider sectors. Company name (specific sector in which the service/product score was achieved)
Table II
Descriptive data
| Variable | Overall | Promoter | Detractor | Passive | Significance |
|---|---|---|---|---|---|
| Age (mean) | 69.1 | 68.6 | 69.1 | 70.4 | < 0.001 |
| Gender | |||||
| Female, % | 57.9 | 56.4 | 59.0 | 63.8 | < 0.001 |
| Male, % | 42.1 | 43.6 | 41.0 | 36.1 | |
| Joint | |||||
| THR, % | 52.8 | 58.3 | 34.3 | 43.2 | < 0.001 |
| TKR, % | 47.2 | 41.7 | 65.7 | 56.8 | |
| Number of co-morbidities (median) | 2.0 (3.0) | 1.0 (3.0) | 2.0 (2.0) | 2.0 (2.0) | < 0.001 |
| Length of stay (days) | 5.0 (3.0) | 5.0 (2.0) | 5.0 (3.0) | 5.0 (2.0) | < 0.001 |
| Overall satisfaction median (IQR) | 1.0 (1.0) | 1.0 (0) | 3.0 (2.0) | 2.0 (1.0) | < 0.001 |
| Satisfaction with specific facets, median (IQR) | |||||
| Pain relief in affected joint | 2.0 (1.0) | 1.0 (1.0) | 4.0 (2.0) | 2.0 (1.0) | < 0.001 |
| Ability to perform activities | 2.0 (2.0) | 2.0 (1.0) | 5.0 (1.0) | 3.0 (2.0) | < 0.001 |
| Ability to perform heavy work or sports | 4.0 (3.0) | 3.0 (3.0) | 5.0 (0.0) | 5.0 (2.0) | < 0.001 |
| Meeting of expectations | 2.0 (2.0) | 1.0 (1.0) | 5.0 (1.0) | 3.0 (2.0) | < 0.001 |
| Rating of hospital experience | 2.0 (2.0) | 2.0 (1.0) | 3.0 (2.0) | 2.0 (1.0) | < 0.001 |
| PROM Questionnaires | |||||
| Pre-operative | |||||
| SF-12 PCS, median (IQR) | 28.5 (9.2) | 28.5 (9.7) | 27.9 (8.5) | 28.5 (8.4) | 0.286 |
| SF -12 MCS, median (IQR) | 49.9 (19.4) | 51.9 (18.9) | 42.9 (19.4) | 46.0 (18.9) | < 0.001 |
| Oxford Score, median (IQR) | 14 (12) | 14.0 (12.0) | 12.0 (11.0) | 14.0 (12.0) | < 0.001 |
| 6 months | |||||
| SF-12 PCS, median (IQR) | 39.6 (17.3) | 43.4 (17.1) | 30.7 (10.3) | 35.2 (13.1) | < 0.001 |
| SF -12 MCS, median (IQR) | 55.4 (15.5) | 57.1 (11.8) | 42.9 (19.6) | 50.7 (18.7) | < 0.001 |
| Oxford Score, median (IQR) | 33 (14) | 35.0 (11.0) | 20 .0 (15.0) | 27.0 (14.0) | < 0.001 |
| 12 months | |||||
| SF-12 PCS, median (IQR) | 41.3 (19.4) | 45.5 (18.0) | 30.0 (11.3) | 35.5 (14.5) | < 0.001 |
| SF -12 MCS, median (IQR) | 55.2 (15.6) | 56.9 (11.6) | 41.7 (19.1) | 50.5 (17.8) | < 0.001 |
| Oxford Score, median (IQR) | 34 .0 (15.0) | 37.0 (10.0) | 19.0 (15.0) | 28.0 (15.0) | < 0.001 |
Pre-operatively scores were similar between the groups, though the Oxford Scores and SF-12 MCS were significantly lower in the net detractor group. The Oxford Scores differed by a single point (less than the minimal clinically important difference of the measure)18 and the MCS scores were within a standard deviation of the population normative score,16 suggesting that there was little practical significance in these differences (Fig. 1). Post-operative patient outcome scores for all measures were significantly different between Net Promoter Score classifications. Post-hoc analysis showed that there were significant differences (p < 0.001) between promoter/passive, promoter/detractor and detractor/passive with the detractors reporting worse outcomes (p < 0.001).
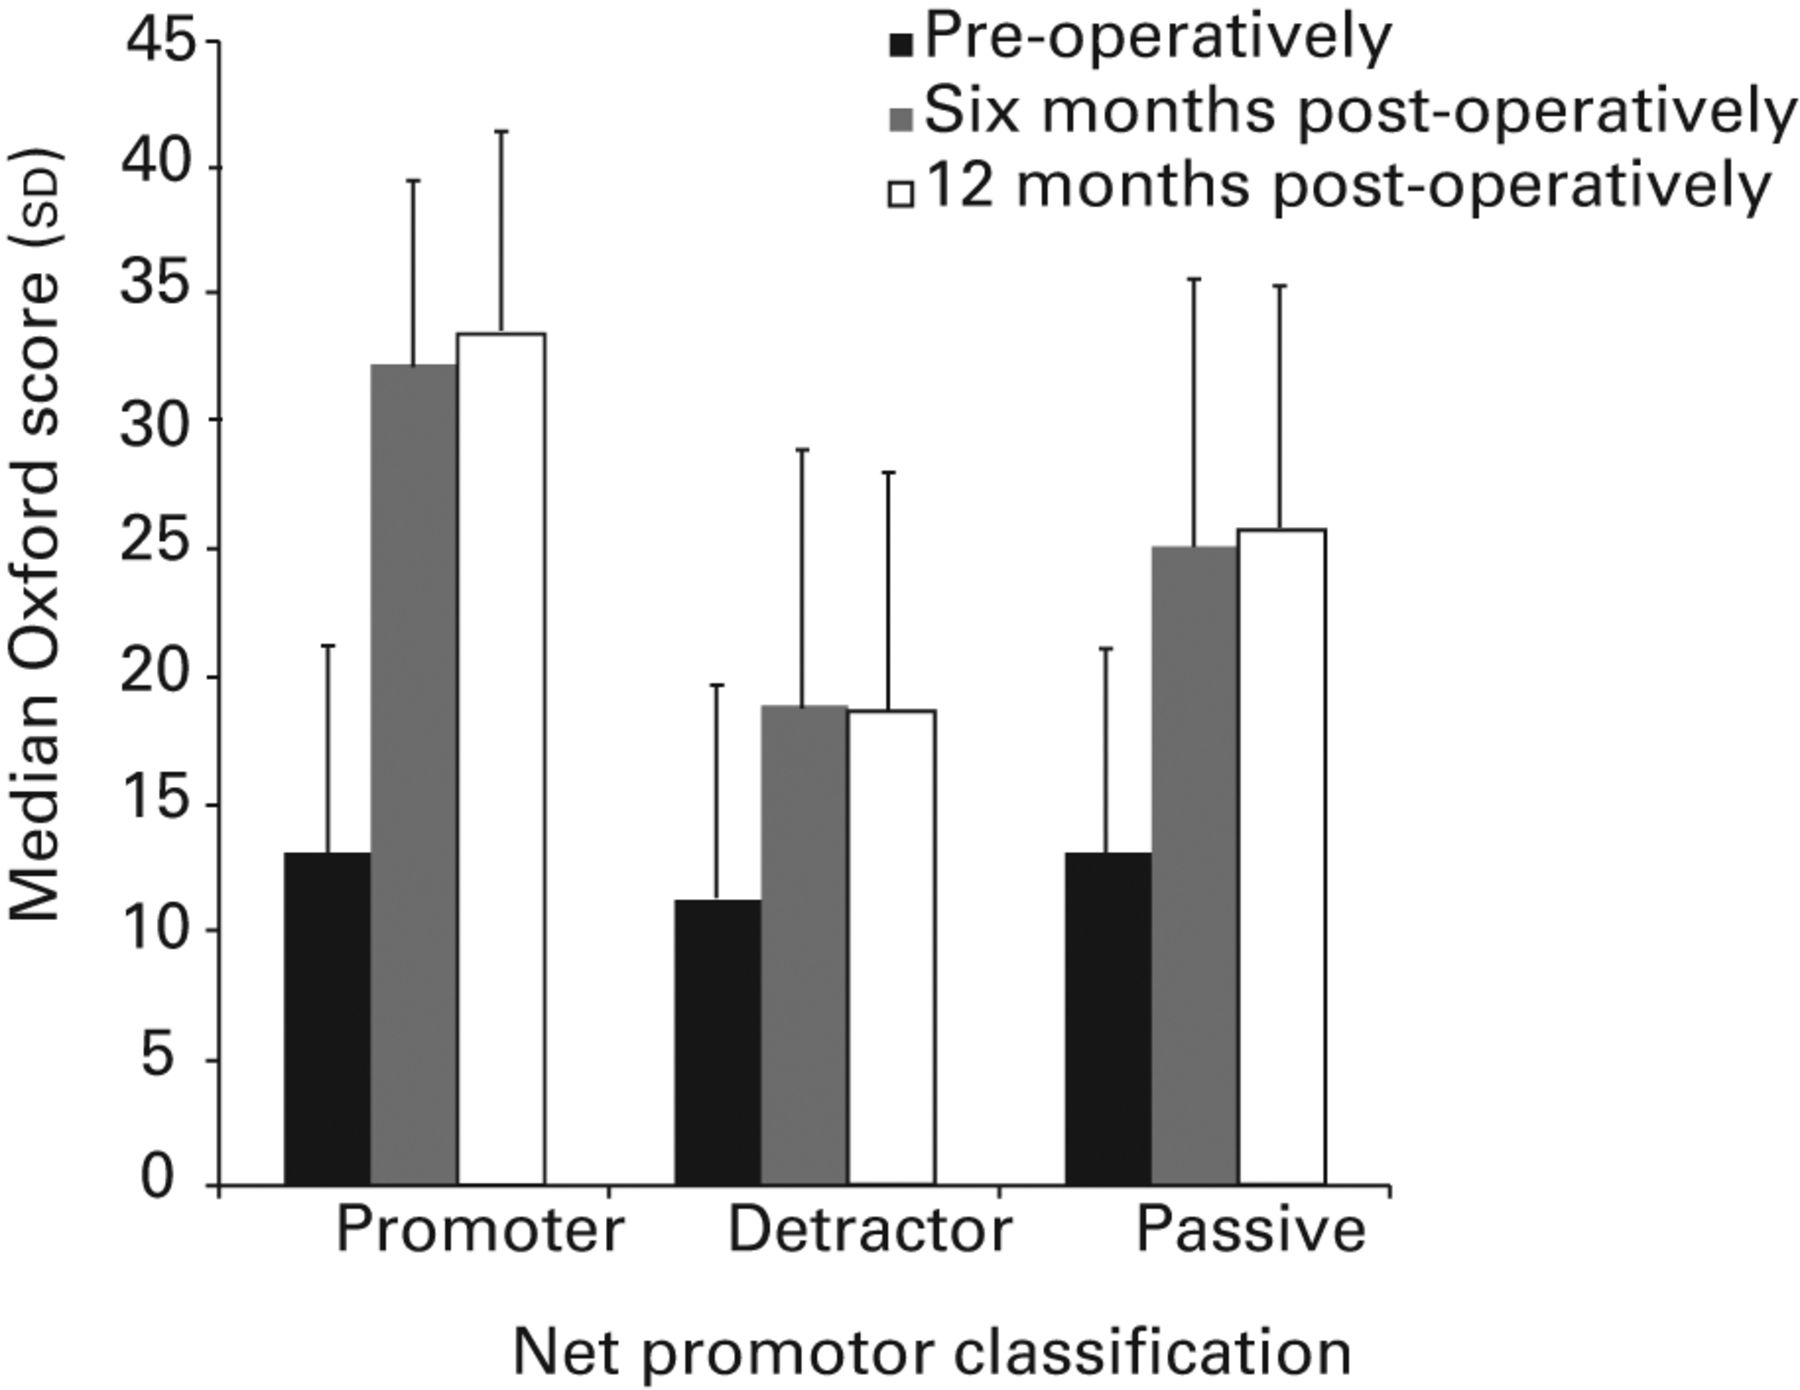
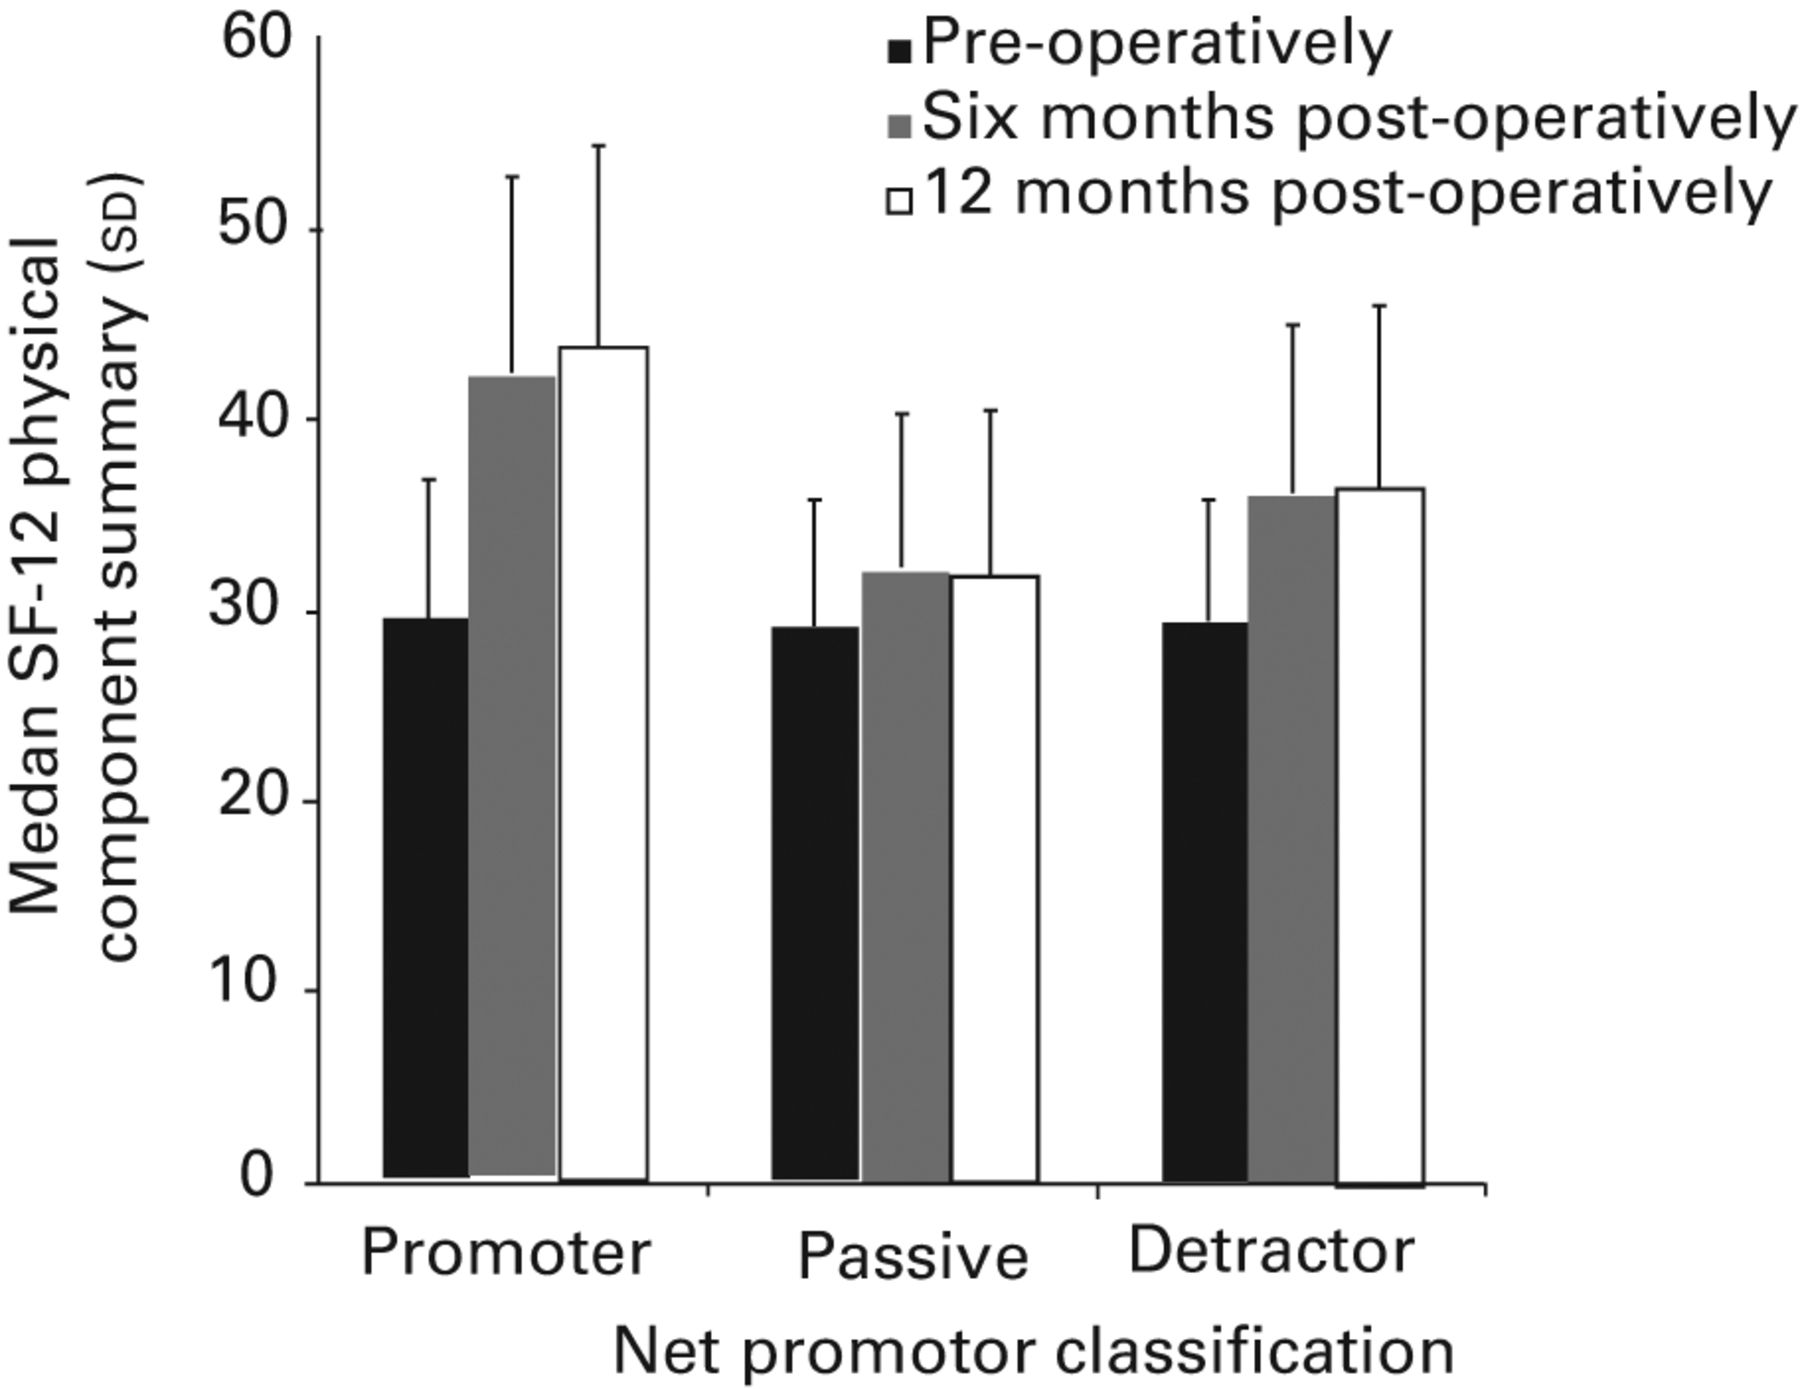
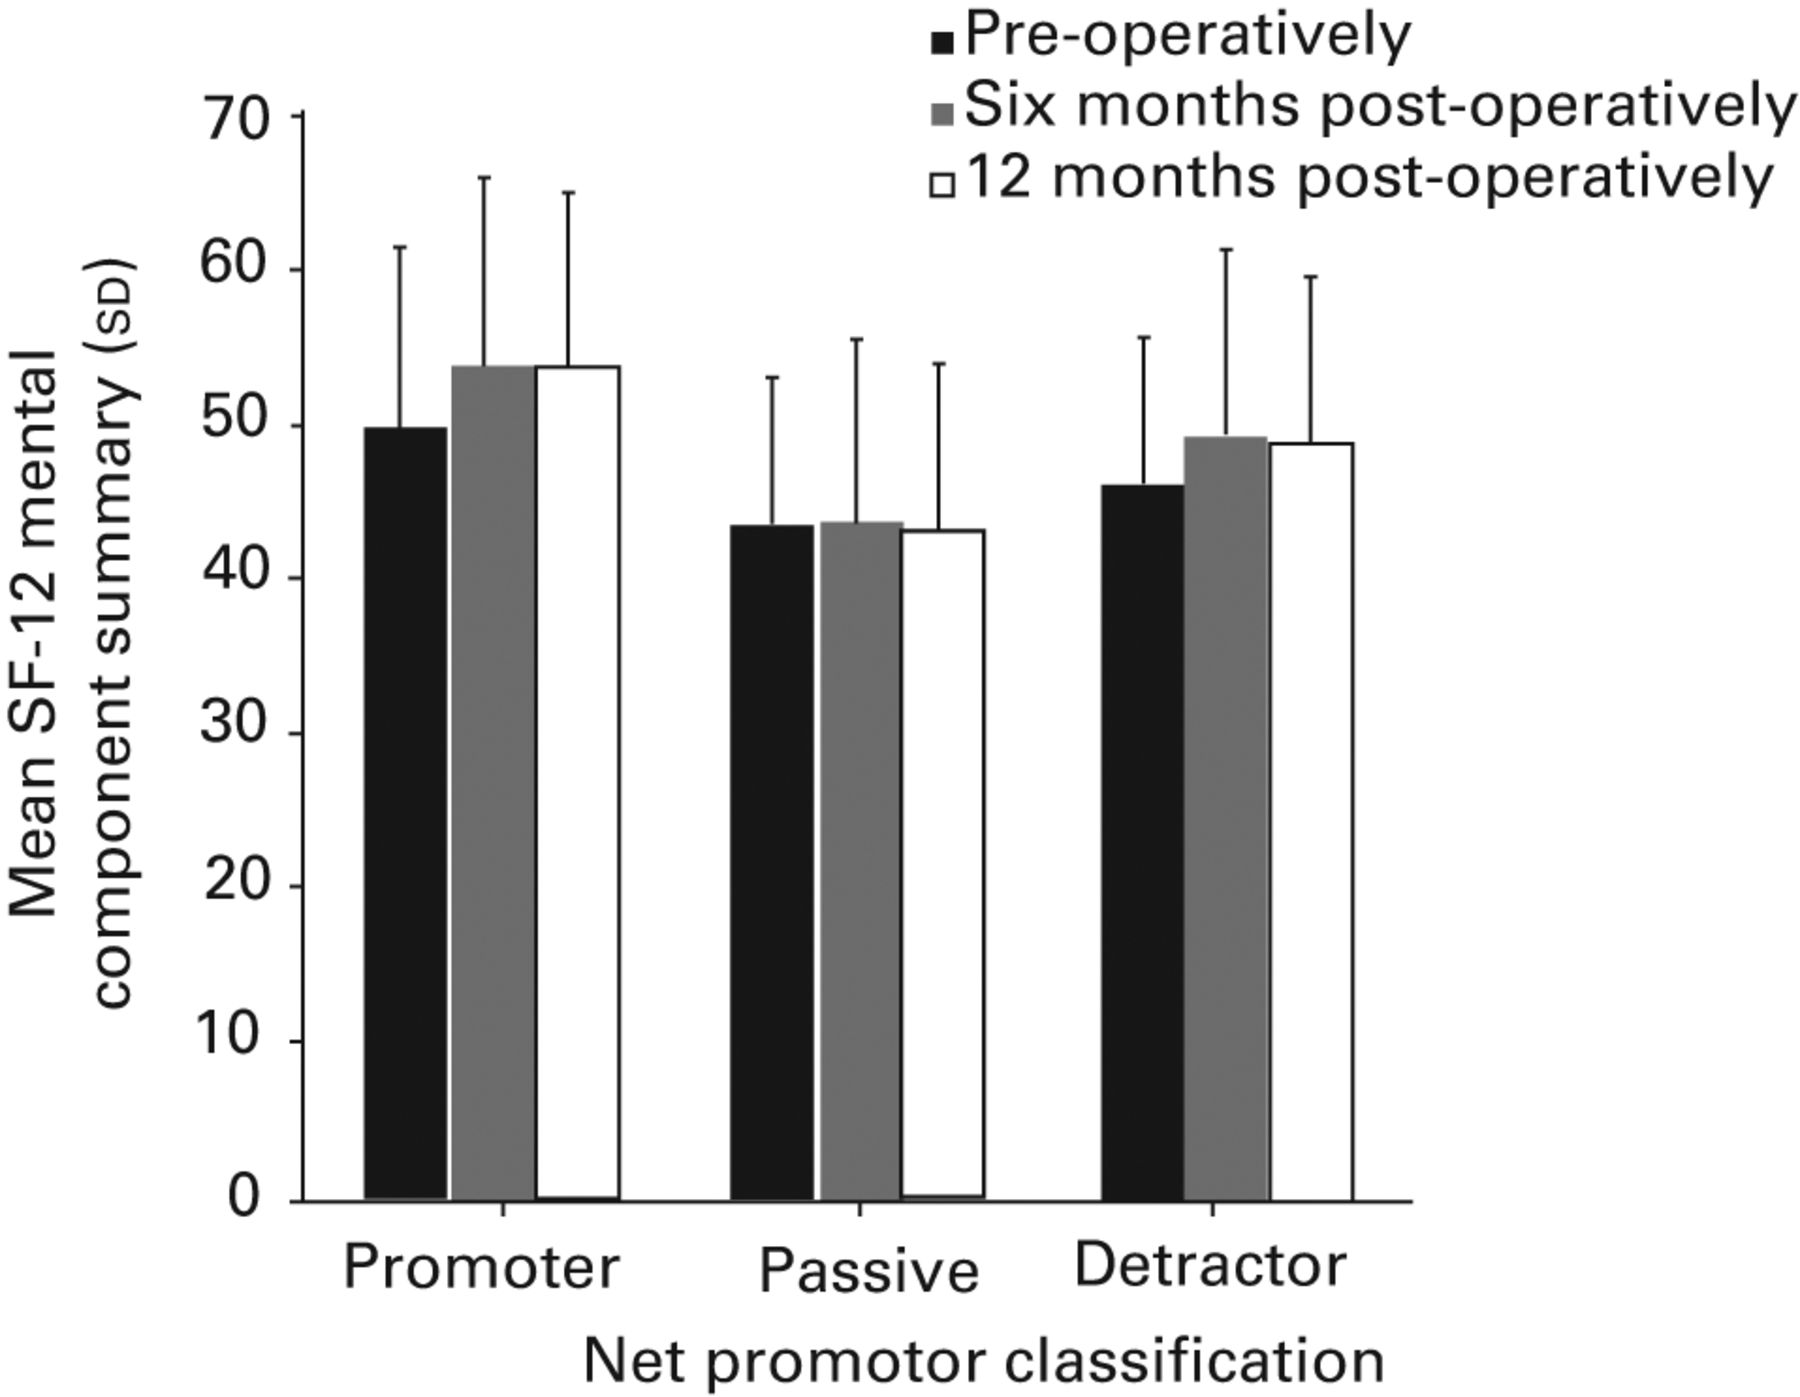
Figs. 1a - 1c
Histograms showing a) the Oxford Knee Score by Net Promoter Score, b) the SF-12 Physical Component Score, and c) the SF-12 Mental Component Score by Net Promoter Score.
Overall satisfaction varied significantly between Net Promoter Scores. Those who were classified as promoters reported a median satisfaction score of 1 (very satisfied), those classified as passive reported a median score of 2 (satisfied) and those who were classified as detractors reported a median score of 3 (uncertain). These differences were significant (Kruskall–Wallis, p < 0.001) (Table 2).
A strong correlation was seen between overall satisfaction and whether the patient would recommend the operation to another (rho = 0.637). This results in a correlation of determination (R2) of 0.406 between the two measures, suggesting that overall satisfaction response explains around 40% of the variation in Net Promoter Score and vice versa.
Variables that were shown to be significantly different between Net Promoter Scores in the univariate analysis were entered into stepwise logistic regression model using either promoter or detractor as the dependent variable (n = 4803). A model containing four variables was found to predict Net Promoter Score of detractor or promoter; whether the hip or knee joint was replaced, the satisfaction with pain relief, meeting of expectations, and the hospital experience (Table III). The model correctly predicted 95% of Net Promoter Score responses (98% for promoters and 72% for detractors). The Hosmer–Lemeshow goodness-of-fit test showed that there was no statistically significant difference between the observed probabilities and those predicted by the model (χ2 = 3.591, df = 7, p = 0.825). The model could therefore be considered as good fit. Patients who had undergone knee surgery were over twice as likely to be classified as detractors compared with hip surgery. A change of one point on the satisfaction scales relating to pain relief, expectations and hospital experience (where 1 = very satisfied and 4 = dissatisfied) meant that a patient was over twice as likely to be a detractor.
Table III
Regression model
| Variable | p-value | Odds ratio | 95% confidence interval for odds ratio |
|---|---|---|---|
| Joint (THR) | < 0.001 | 2.310 | 1.676 to 3.174 |
| Satisfaction with pain relief | < 0.001 | 2.132 | 1.825 to 2.490 |
| Satisfaction with having expectations met | < 0.001 | 2.574 | 2.235 to 2.965 |
| Satisfaction with hospital experience | < 0.001 | 2.329 | 2.025 to 2.677 |
We specifically assessed the volume of missing data in the satisfaction questionnaire response to determine if the ‘recommend to a friend’ question was poorly received by patients. In our post-operative survey, the ‘would you recommend this operation to someone else?’ question demonstrated a completion rate of 96.5%, and was the most consistently completed question in our satisfaction survey (Table IV).
Table IV
Missing data
| Satisfaction question | Missing n (%) |
|---|---|
| Overall satisfaction | 315 (5.1) |
| Recommend to another | 215 (3.5) |
| Increased ability | 322 (5.2) |
| Heavy work or sports | 506 (8.2) |
| Meeting expectations | 332 (5.4) |
| Hospital experience | 265 (4.3) |
Discussion
This study assesses the Net Promoter Score/friends and family test score in the context of orthopaedic services, focusing on joint replacement. Assessing patient outcome survey responses over a six-year period, we found high levels of patient satisfaction with total joint replacement and show that most patients who have had either a hip or knee replacement would be happy to recommend the procedure to someone else.
Perhaps surprisingly, the Net Promoter Scores achieved by joint replacement are comparable to the most popular and successful commercial organisations.19 Table I highlights the scores achieved by selected companies on the Satmetrix European benchmark performance index (2012). The scores presented are for the best-performing companies in their particular category (mobile phones, televisions, internet providers, insurance companies and utility providers). While this concept of comparing services is commonplace in business, it is new to the orthopaedic literature.
We report different Net Promoter Scores for hip and knee replacement, which suggests that different scores are likely to be identified for other, differing, procedures (such as back or hand surgery). This indicates that case-mix must be taken into account when comparing scores between hospitals and across various departments. This mirrors differences between different types of business and highlights why businesses are primarily concerned with competitor comparison within their particular sector.
The new ‘friends and family test’ is described as a measure of patient satisfaction. This is perhaps not completely accurate. We found a strong correlation between our patients response to the ‘overall satisfaction’ question and the ‘recommend to another’ question, however, only 40% of the variation in one response can be explained by the other; suggesting that although these concepts are clearly related, they are not the same. To try to better understand the Net Promoter Score/friends and family response, we carried out multivariate regression modeling using all available covariate data (age, gender, Oxford Score, etc.) in an attempt to predict better the promoters and detractors. Whether patients would recommend the procedure to another was determined by four factors, namely, meeting pre-operative expectations of surgery, achieving pain relief following surgery, the hospital experience and whether the hip or the knee joint was replaced. These factors drove a model that was able to explain 95% of the variation in the recommendation response.
The factors previously reported to influence clinical outcomes including patient age, gender, co-morbidities, length of post-operative stay and PROM scores, did not help explain the ‘recommendation’ response. This highlights that an overarching ‘recommendation’ metric as a single and generic concept is only in part related to clinical effectiveness or to specific aspects of surgery; the patients’ experience of the delivery of healthcare is just as pertinent to this outcome measure response. We have previously found similar predictor variables when modelling the factors that influenced overall patient satisfaction.20 This suggests a similarity between satisfaction and recommendation responses though the predictive association we report between these variables here suggests that promotion of joint replacement is indeed a separate metric. It may be that psychological and emotional factors are the key difference between these two responses, where patients may be broadly content and satisfied with what has happened to them, they would not necessarily suggest another person be put through the same procedure. The recommendation question may then be a more discerning metric in assessing the quality of the delivery of care than questions relating to personal satisfaction.
Pre-operative physical scores were the same in both promoter and detractor groups, though the detractors demonstrated statistically lower mental health scores prior to surgery. The actual MCS scores reported were within a standard deviation of the population normative mental health score16 and so the clinical relevance of this finding is difficult to interpret. Lower mental health scores have consistently been linked to worse outcomes,21,22 however, a definitive association is lacking. Broadly, those who report worse mental health pre-operatively are less satisfied post-operatively, yet this did not influence the predictive modelling of the ‘recommendation to another’ response.
PROM scores are useful tools for the assessment of clinical outcome, but they mainly depend on pain relief,23,24 and do not capture whether or not the patient is satisfied. This analysis highlights that while pain relief is very relevant to whether the patient would promote joint replacement, it is not the only factor. Baker et al25 suggest that failure to meet optimistic expectations is associated with dissatisfaction following joint replacement; our results support this assertion. We also found the hospital experience of healthcare delivery to be equally relevant to our predictive modelling, with similar odds ratios achieved for meeting expectations, clinical outcome (pain relief) and hospital experience. As all operations were carried out in the same hospital environment it is likely that the difference in promoter response between THR and TKR reflects the acknowledged differences in outcome between hip and knee replacement2and merely highlights that any ‘net promoter’ style metric should take into account what operation is being performed.
Strengths of this study include a large patient cohort from a single NHS orthopaedic centre with many surgeons treating a large regional population. We have used validated, reliable instruments for assessing change in health status and outcome of joint replacement, and our data has been collected prospectively with high rates of follow-up. Though probably reflective of other interventions, the wider generalisability of these findings to emergency settings and the breadth of medical services provided by the NHS is unknown. It seems likely that this model will be valid for most interventions, however, the relative importance of individual factors may vary with clinical outcomes and expectation from different treatments. Broadly, patients who report higher clinical outcome scores also report better levels of satisfaction,2,20,24 and are more likely to recommend joint replacement as a treatment. Studies in general medicine have also found conflicting associations between the patient’s experience of intervention and the technical quality of the care delivered as measured by other means.26,27
A recent study suggested that while a single question can be asked, patients found the recommendation concept difficult, which could manifest in limited response rates to surveys which assess this. Our experience in the field of joint replacement is in stark contrast to this, where 96.5% of our patients responded to this question over a five-year period, making it the most consistently reported item in our satisfaction questionnaire. The context of how the question is asked may be important. We would recommend, as a minimum, a relevant clinical outcome score and some form of experience measure both to set the question and to help analyse the results.
Achieving pain relief, the meeting of pre-operative expectation and the hospital experience are the key domains that explain whether a patient would recommend joint replacement services: each domain contributes a similar amount to the overall response. The difference between THR and TKR suggests that no overarching score for a department should be used without case-mix adjustment. THR and TKR each give Net Promoter Scores which compare favourably with the services from the most successful commercial organisations.
1 Timmins N . NHS goes to the PROMS. BMJ2008;336:1464–1465.CrossrefPubMed Google Scholar
2 Hamilton D , HendersonGR, GastonP, et al.Comparative outcomes of total hip and knee arthroplasty: a prospective cohort study. Postgrad Med J2012;88:627–631.CrossrefPubMed Google Scholar
3 Judge A , ArdenNK, PriceA, et al.Assessing patients for joint replacement: can pre-operative Oxford hip and knee scores be used to predict patient satisfaction following joint replacement surgery and to guide patient selection?J Bone Joint Surg [Br]2011;93-B:1660–1664.CrossrefPubMed Google Scholar
4 Mira JJ , TomásO, Virtudes-PérezM, NebotC, Rodríguez-MarínJ. Predictors of patient satisfaction in surgery. Surgery2009;145:536–541.CrossrefPubMed Google Scholar
5 Doyle C , LennoxL, BellD. A systematic review of evidence on the links between patient experience and clinical safety and effectiveness. BMJ Open2013;3(1).pii:001570.CrossrefPubMed Google Scholar
6 No authors listed. Gov.uk: ‘Friends and family’,test to expose poor care in NHS, 2013. http://www.number10.gov.uk/news/friends-and-family-test-nhs [date last accessed 20 February 2014] . Google Scholar
7 Reichheld FF . The one number you need to grow. Harv Bus Rev2003;81:46–54, 124.PubMed Google Scholar
8 Liyakasa K CRM Magazine: Customer Experience Is Critical in Net Promoter Benchmarks. Customer Relationship Management, 2012. http://www.destinationcrm.com/Articles/Columns-Departments/Insight/Customer-Experience-Is-Critical-in-Net-Promoter-Benchmarks-82569.aspx (date last accessed 20 February 2014). Google Scholar
9 No authors listed. Department of Health: Friends and Family Test: what it means for NHS, 2012. http://www.dh.gov.uk/health/2012/05/friends-family [date last accessed 20 February 2014] . Google Scholar
10 Reichheld FF . The microeconomics of customer retentionships. MIT Sloan management review2006;47:73–78. Google Scholar
11 Keiningham TL , CooilB, AndreassenTW, AksoyL. A longitudinal examination of net promoter and firm revenue growth. Journal of Marketing2007;71:39–51. Google Scholar
12 Graham C , MacCormickSNHS Surveys: Overarching questions for patient surveys: development report for the care quality commission (CQC) picker Institute Europe, 2012 http://www.nhssurveys.org/survey/1186 [date last accessed 20 February 2014]. Google Scholar
13 Knightly-Day T Health Service Journal: The magic number?, 2012. http://www.hsj.co.uk/resource-centre/best-practice/patient-involvement-resources/the-magic-number/5046939.article [date last accessed 20 February 2014] . Google Scholar
14 Dawson J , FitzpatrickR, CarrA, MurrayD. Questionnaire on the perceptions of patients about total hip replacement. J Bone Joint Surg [Br]1996;78-B:185–190.PubMed Google Scholar
15 Dawson J , FitzpatrickR, MurrayD, CarrA. Questionnaire on the perceptions of patients about total knee replacement. J Bone Joint Surg [Br]1998;80-B:63–69.CrossrefPubMed Google Scholar
16 Ware JE Jr , SherbourneCD. The MOS 36-item short-form health survey (SF-36). I. Conceptual framework and item selection. Med Care1992;30:473–483.PubMed Google Scholar
17 Keiningham TL , CooilB, AksoyL, AndreassenTW, WeinerJ. The value of different customer satisfaction and loyalty metrics in predicting customer retention, recommendation, and share-of-wallet. Managing Service Quality2007;17;361–384. Google Scholar
18 Murray DW , FitzpatrickR, RogersK, et al.The use of the Oxford hip and knee scores. J Bone Joint Surg [Br]2007;89-B:1010–1014. Google Scholar
19 No authors listed. Satmetrix Systems Inc. European Net Promoter Industry Benchmark Report 2012. Available to access from http://www.thewisemarketer.com (date last accessed 25 March 2014). Google Scholar
20 Hamilton DF , LaneJV, GastonP, et al.What determines patient satisfaction with surgery? A prospective cohort study of 4709 patients following total joint replacement. BMJ Open2013;3.pii:002525.CrossrefPubMed Google Scholar
21 Clement ND , MacDonaldD, BurnettR. Primary total knee replacement in patients with mental disability improves their mental health and knee function: a prospective study. Bone Joint J2013;95-B:360–366.CrossrefPubMed Google Scholar
22 Brander V , GondekS, MartinE, StulbergSD. Pain and depression influence outcome 5 years after knee replacement surgery. Clin Orthop Relat Res2007;464:21–26.CrossrefPubMed Google Scholar
23 Hamilton DF , GastonP, SimpsonAH. Is patient reporting of physical function accurate following total knee replacement?J Bone Joint Surg [Br]2012;94-B:1506–1510.CrossrefPubMed Google Scholar
24 Terwee CB , van der SlikkeRM, van LummelRC, et al.Self-reported physical functioning was more influenced by pain than performance-based physical functioning in knee-osteoarthritis patients. J Clin Epidemiol2006;59:724–731.CrossrefPubMed Google Scholar
25 Baker PN , van der MeulenJH, LewseyJ, GreggPJ, National Joint Registryfor England and Wales. The role of pain and function in determining patient satisfaction after total knee replacement. Data from the National Joint Registry for England and Wales. J Bone Joint Surg [Br]2007;89-B:893–900.CrossrefPubMed Google Scholar
26 Rao M , ClarkeA, SandersonC, HammersleyR. Patients' own assessments of quality of primary care compared with objective records based measures of technical quality of care: cross sectional study. BMJ2006;333:19.CrossrefPubMed Google Scholar
27 Chang JT , HaysRD, ShekellePG, et al.Patients' global ratings of their health care are not associated with the technical quality of their care. Ann Intern Med2006;144:665–672. Google Scholar
No benefits in any form have been received or will be received from a commercial party related directly or indirectly to the subject of this article.
This article was primary edited by A. Ross and first proof edited by D. Rowley.
