


Abstract
Aims
The lateral centre-edge angle (LCEA) is a plain radiological measure of superolateral cover of the femoral head. This study aims to establish the correlation between 2D radiological and 3D CT measurements of acetabular morphology, and to describe the relationship between LCEA and femoral head cover (FHC).
Methods
This retrospective study included 353 periacetabular osteotomies (PAOs) performed between January 2014 and December 2017. Overall, 97 hips in 75 patients had 3D analysis by Clinical Graphics, giving measurements for LCEA, acetabular index (AI), and FHC. Roentgenographical LCEA, AI, posterior wall index (PWI), and anterior wall index (AWI) were measured from supine AP pelvis radiographs. The correlation between CT and roentgenographical measurements was calculated. Sequential multiple linear regression was performed to determine the relationship between roentgenographical measurements and CT FHC.
Results
CT-measured LCEA and AI correlated strongly with roentgenographical LCEA (r = 0.92; p < 0.001) and AI (r = 0.83; p < 0.001). Radiological LCEA correlated very strongly with CT FHC (r = 0.92; p < 0.001). The sum of AWI and PWI also correlated strongly with CTFHC (r = 0.73; p < 0.001). CT measurements of LCEA and AI were 3.4° less and 2.3° greater than radiological LCEA and AI measures. There was a linear relation between radiological LCEA and CT FHC. The linear regression model statistically significantly predicted FHC from LCEA, F(1,96) = 545.1 (p < 0.001), adjusted R2 = 85.0%, with the prediction equation: CT FHC(%) = 42.1 + 0.77(XRLCEA)
Conclusion
CT and roentgenographical measurement of acetabular parameters are comparable. Currently, a radiological LCEA greater than 25° is considered normal. This study demonstrates that those with hip pain and normal radiological acetabular parameters may still have deficiencies in FHC. More sophisticated imaging techniques such as 3D CT should be considered for those with hip pain to identify deficiencies in FHC.
Cite this article: Bone Jt Open 2022;3(1):12–19.
Take home message
A lateral centre-edge angle over 20° can still represent a deficiency in femoral head coverage (FHC).
It is worth considering an onward referral to a specialist with an interest in young adult hip pathology for patients with hip pain and borderline or normal acetabular parameters.
3DCT is helpful to quantify FHC.
Introduction
Patients with acetabular dysplasia (AD) present with pain as a consequence of the abnormal joint mechanics and stresses associated with a lack of femoral head cover (FHC). Wiberg1 described the lateral centre-edge angle (LCEA) in 1939, reporting an angle greater than 25° in an adult as normal, and an angle less than 20° as dysplastic.
While the LCEA is measured on a standard pelvic radiograph, the use of cross-sectional imaging and 3D reconstructions is increasing.2 3D CT can give a measure of global FHC.3-5 FHC can be described as the percentage of the femoral head that is covered by the acetabulum. The 3D CT techniques described by Dandachli et al,3 Cheng et al,4 and Klaue et al6 describe normal FHC as approximately 70%. However, most young patients presenting to musculoskeletal services with hip pain do not routinely undergo a CT scan. Furthermore, deriving FHC measurements from CT requires further image processing, which can be labour-intensive.
Few studies have related CT-derived measurements of acetabular parameters with roentgenographic-derived measurements. Monazzam et al7 and Chadayammuri et al8 compared roentgenographical measures of LCEA with CT-derived measures but no study has demonstrated an association between roentgenographic derived LCEA and FHC.
The aim of this study is to assess how closely plain radiological parameters match 3D CT-derived parameters, and whether anteroposterior (AP) pelvic radiograph parameters can be used to estimate 3D CT-derived FHC.
Methods
Patients
This was a governance board registered retrospective study, and no ethical approval was required. A total of 353 consecutive PAOs performed by the senior author (JW) between January 2014 and December 2017 were included. Cases were excluded if there was inadequate preoperative CT imaging and/or plain radiographs (255), and previous pelvic/hip surgery or aspherical femoral head (2). The remaining 97 hips in 75 patients were included in the study. Overall, 11 were male and 64 were female. Mean age for the group was 28.4 years (16 to 52). Of the 22 patients in whom both hips were included in the study, three were operated upon bilaterally. In total, 19 hips in the study were asymptomatic but were included to reduce confirmation and selection bias.
Plain radiographs
Supine pelvic radiographs centred over the pubic symphysis, with the hips in neutral abduction/adduction and feet rotated slightly inwards. A consultant musculoskeletal radiologist (MHC), and at least one other author (SS, GG and/or SB), made the following measurements using AGFA Impax Client measurement tools (Figure 1):
LCEA: angle subtended between a line drawn from the centre of the femoral head to the lateral edge of the weightbearing acetabular sourcil, and a vertical line perpendicular to the inter-teardrop line.
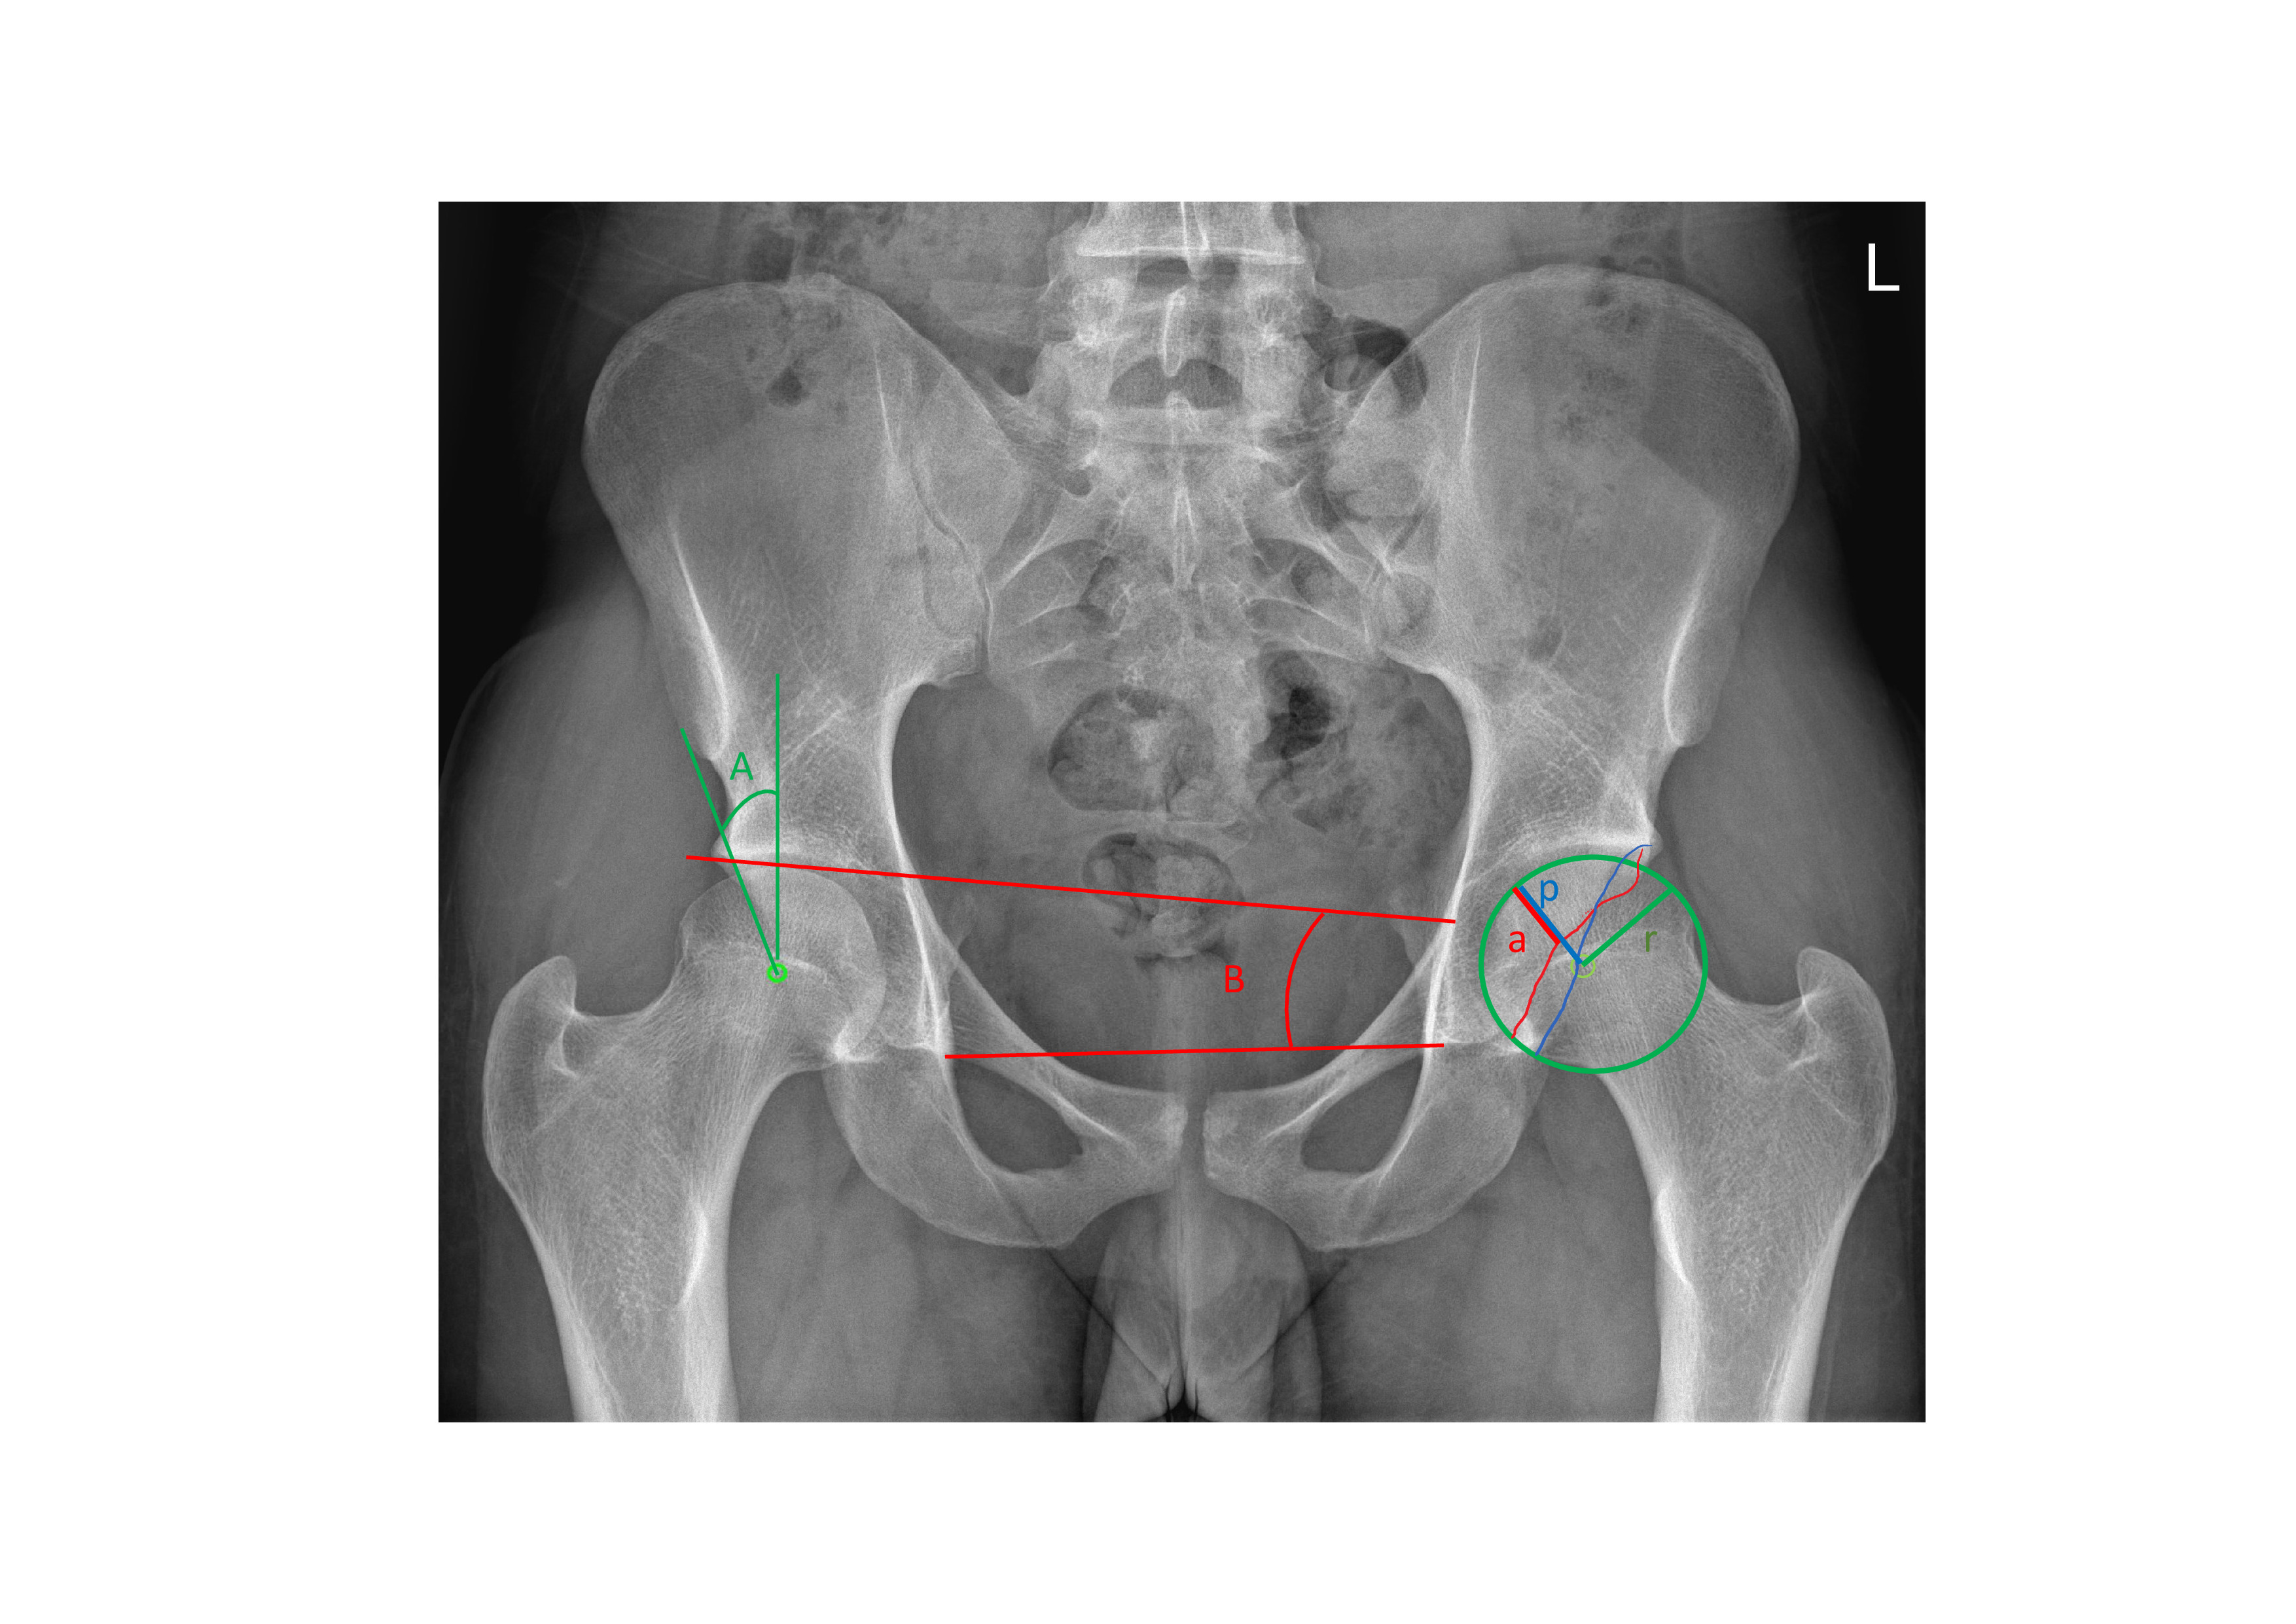
Fig. 1
Anonymized anteroposterior pelvic radiograph showing lateral centre-edge angle (A), acetabular index (B), anterior wall index (a/r), and posterior wall index (p/r).
Acetabular index (AI): angle subtended between lines connecting the most medial and most lateral part of the weightbearing acetabular sourcil, and the inter-teardrop line.
Anterior wall index (AWI): the ratio of the distance from the border of the anterior wall to the medial edge of the femoral head as measured along a line extended along the axis of the femoral neck through the centre of the femoral head, to the femoral head radius.
Posterior wall index (PWI): the ratio of the distance from the border of the posterior wall to the medial edge of the femoral head, as measured along a line extended along the axis of the femoral neck through the centre of the femoral head, to the femoral head radius.
Sum of AWI and PWI (WALLSUM): the sum of AWI and PWI.
3D CT measurements
Adequate CT scans were defined as those that included the pelvis from the anterior superior iliac spines to the lesser trochanters, with concurrent slices through the femoral condyles at the knee, with a maximum slice depth of 1 mm. Patient positioning was standardized with hips in neutral abduction/adduction and patellae facing anteriorly. 3D CT measurements based upon this imaging was provided by Clinical Graphics (Zimmer Biomet), in the form of a PDF file (Figure 2). A sample can be downloaded from https://wwwclinicalgraphicscom/en/professionals/services. The calculations have been previously described and validated,3 but briefly are as follows: a 3D reconstruction of the pelvis is rotated in the sagittal plane so that the anterior pelvic plane angle is zero (anterior superior iliac spines and pubic tubercles in vertical alignment). The acetabular rim is equated to a clockface so that 0900 is the posterior acetabular margin at the level of the midpoint between the superior border and inferior extent of the acetabulum. LCEA was obtained at 1100, 1200, and 1300 (always anterior, (Figure 2a)). AI was obtained at the 1200 position (Figure 2d). Acetabular version was obtained at two planes on the coronal reconstruction: at the midpoint of the acetabulum from superior to inferior, and at a point midway between the midpoint and the superior margin (Figure 2c).
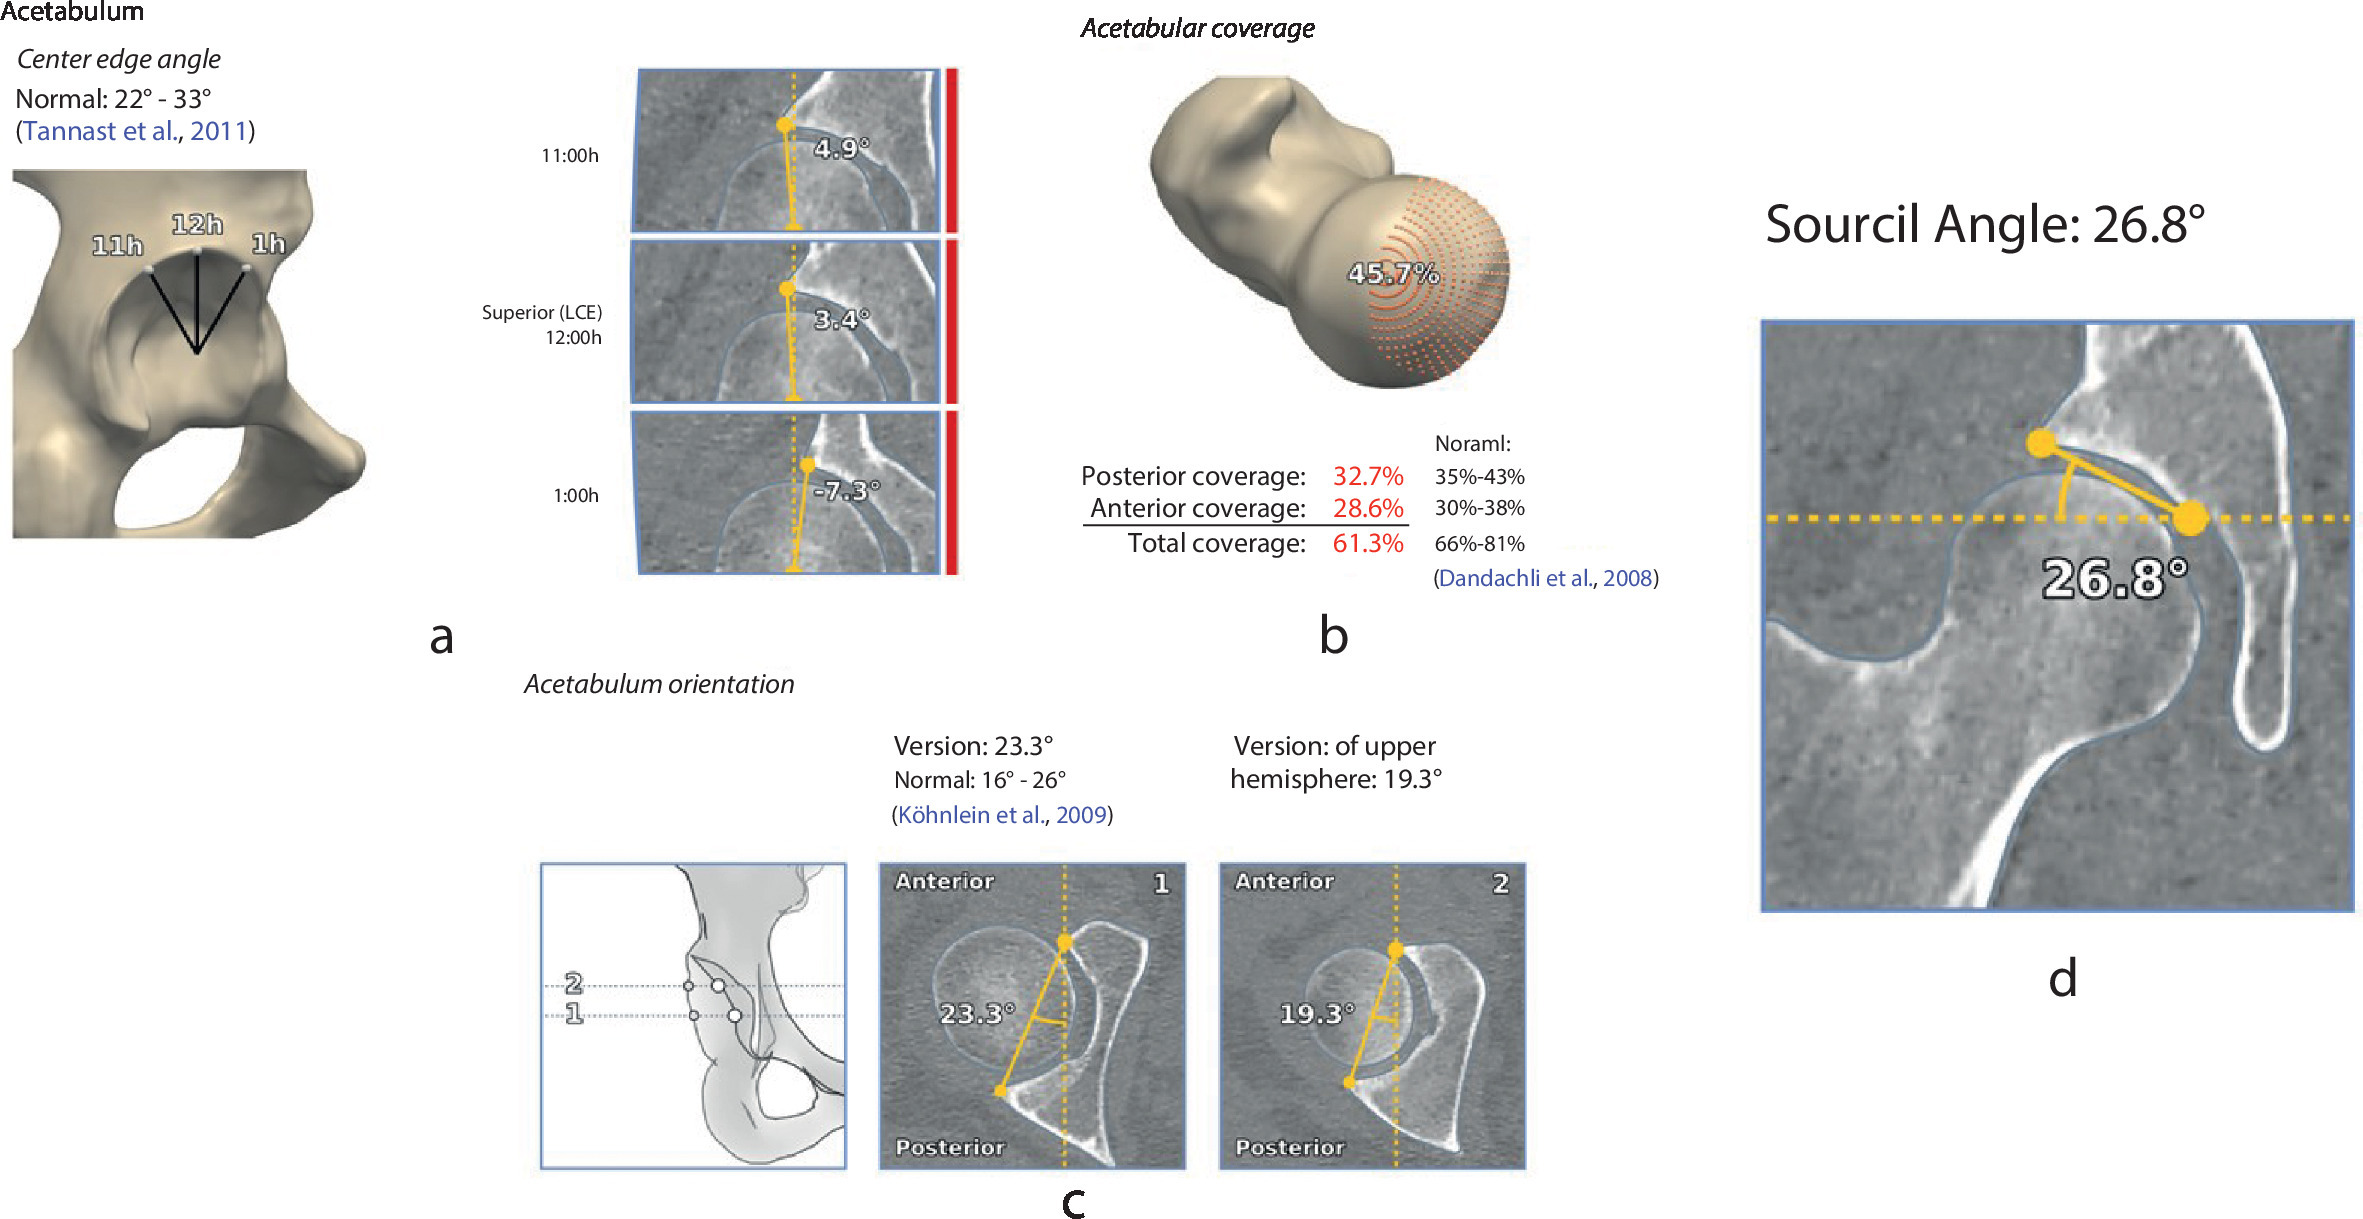
Fig. 2
Sample of 3D CT measurements depicting a) lateral centre edge angle at 11:00, 12:00, and 1:00 (referred to as 13:00 in this article), b) femoral head cover, c) acetabular version, and d) acetabular index (referred to as sourcil angle by the Clinical Graphics analysis).
To calculate FHC, points are plotted along the acetabular rim, and a sphere of best fit is applied to the femoral head so that the femoral head centre can be plotted. A craniocaudal projection is then generated, such that the points of the acetabular margin are superimposed upon a circle depicting the femoral head, formed by an upward projection of the femoral head from its equator. A topographical representation of the femoral head, with the cover afforded by the acetabulum superimposed, is generated, and FHC is presented as a percentage (Figure 2b).
Measurement reliability
Measurements were performed by at least two readers (SS, GG, SB, MHC) and one reader (SS) repeated measures at a three-month interval. Interclass correlation coefficient (ICC) was excellent for LCEA (0.917), and very good for AI (0.727), AWI (0.681), and PWI (0.645).9,10
Statistical analysis
Data were normally distributed as determined by a combination of visual inspection of Q-Q plots and histograms. Pearson’s correlation coefficient (r) was calculated to assess radiological and CT-derived measures. A sequential multiple regression model was run to assess the relationship between CT FHC and radiologically measured parameters (LCEA, WALLSUM, and AI). There was homoscedasticity and normality of the residuals. R2 and adjusted R2 values are presented. Agreements were rated as excellent (> 0.8), good (> 0.6 to 0.8), moderate (> 0.4 to 0.6), fair (> 0.2 to 0.4), and poor (0 to 0.2).10 Statistical analysis was performed in SPSS v.20 (IBM, USA).
Results
Table I displays the baseline acetabular characteristics as described by both radiographs and 3D CT.
Table I.
Descriptive measures for all hips (n = 97) of the 75 patients in the study. All figures are angles in degrees unless stated otherwise.
| Variable | Value |
|---|---|
| Mean age, yrs (SD) | 28.4 (7.7) |
| Mean total coverage, % (SD) | 59.9 (8.6) |
| Mean CT LCEA 1100 (SD) | 16.1 (8.2) |
| Mean CT LCEA 1200 (SD) | 19.7 (10.1) |
| Mean CT LCEA 1300 (SD) | 12.2 (11.6) |
| Mean CT AI (SD) | 10.7 (9.5) |
| Mean CT acetabular version mid (SD) | 20.7 (6.6) |
| Mean CT acetabular version upper (SD) | 15.8 (9.0) |
| Mean radiological LCEA (SD) | 23.1 (10.4) |
| Mean radiological AWI (SD) | 0.4 (0.2) |
| Mean radiological PWI (SD) | 0.8 (0.2) |
| Mean radiological AI (SD) | 13.0 (8.1) |
-
AI, acetabular index; AWI, anterior wall index; LCEA, lateral centre-edge angle; PWI, posterior wall index; SD, standard deviation.
Radiological LCEA correlated very strongly at 1200 (r = 0.92; p < 0.001), and strongly at 1100 (r = 0.73; p < 0.001), and 1300 (r = 0.84; p < 0.001) with CT LCEA. Radiological AI also correlated strongly with CT AI (r = 0.83; p < 0.001). Radiological LCEA measures 3.4° (95% CI 2.5° to 4.3°) greater than the CT LCEA at 1200 (Figure 3). Radiological AI measures 2.3° (95% CI 1.3° to 3.4°) greater than CT (Figure 4). These differences were statistically significant (Table II).
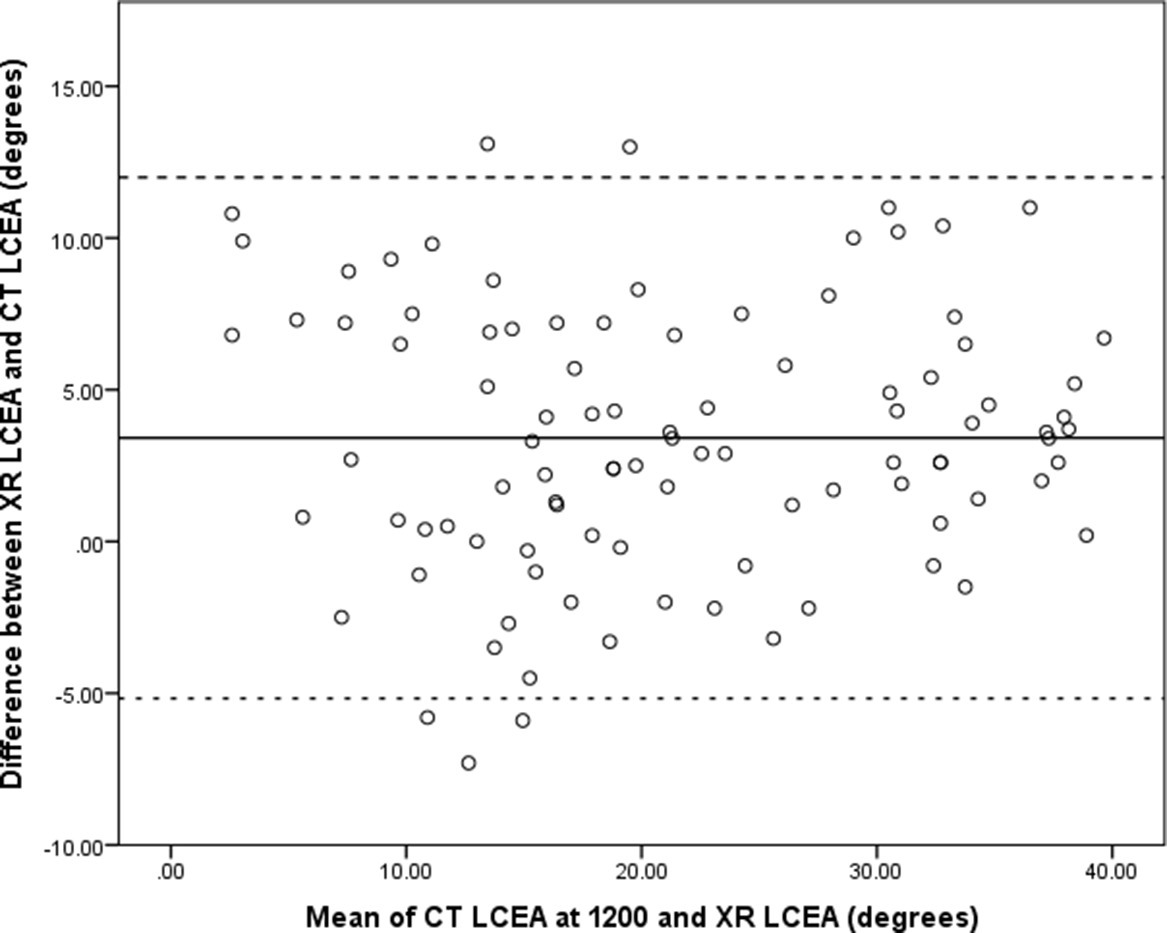
Fig. 3
Bland Altman plot of radiological lateral centre-edge angle (LCEA) and CT LCEA at 1200. Solid line represents the mean difference and dashed lines represent 95% confidence intervals. XR, x-ray.
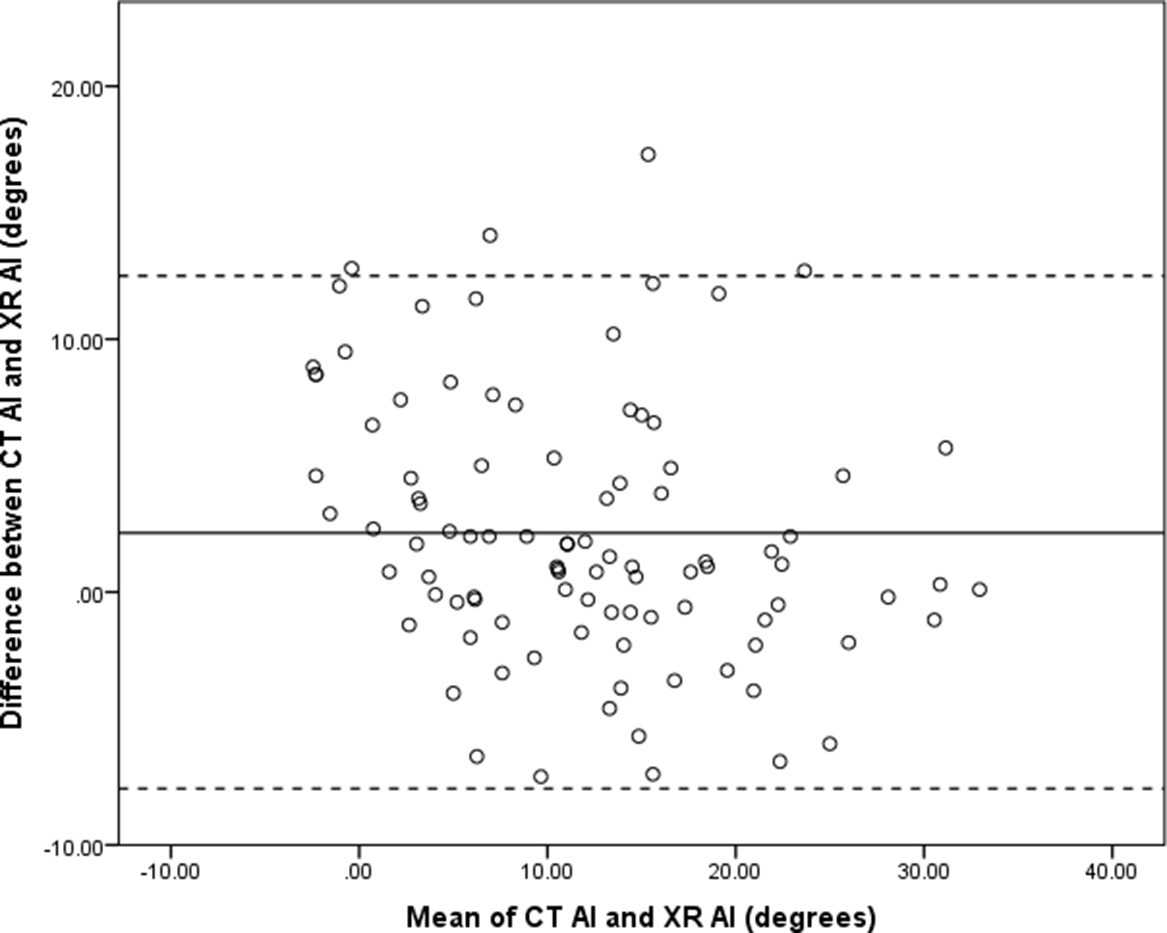
Fig. 4
Bland Altman plot of X-ray (XR) acetabular index (AI) and CT AI. Solid line represents the mean difference and the dashed lines represent the 95% confidence intervals.
Table II.
CT and radiological measures of lateral centre-edge angle and acetabular index.
| Difference | Mean paired difference (SD; 95% CI) | p-value* |
|---|---|---|
| CT LCEA 1100 - radiological LCEA | -7.02 (7.28; -8.5 to -5.6) | < 0.001 |
| CT LCEA 1200 - radiological LCEA | -3.41 (4.38; -4.3 to -2.5) | < 0.001 |
| CT LCEA 1300 - radiological LCEA | -10.96 (6.04; -12.2 to -9.7) | < 0.001 |
| CT AI - XR AI | -2.34 (5.16; -3.4 to -1.3) | < 0.001 |
-
*
Paired t-test.
-
AI, acetabular index; CI, confidence interval; LCEA, lateral centre-edge angle; SD, standard deviation.
CT FHC correlated most strongly with LCEA (r = 0.92; p < 0.001), although strong correlations were also seen with the WALLSUM (r = 0.73; p < 0.001), and a strong inverse relationship with radiological AI (r = -0.77; p < 0.001).
A sequential multiple regression model was run to assess the relationship between CT FHC and radiologically measured parameters (LCEA, AI, and WALLSUM). Scatter plots confirmed linear relationships between the radiological parameters and CT FHC. However, multicollinearity existed because of the strong correlations between AI, LCEA, and WALLSUM.
Therefore, a simple linear regression model was run to compare CT FHC and radiological LCEA. There was homoscedasticity and normality of the residuals. Linearity was confirmed by visual inspection of the scatter plot of CT FHC versus radiological LCEA (Figure 5). Radiological LCEA accounted for 85.2% of the variation in CT FHC in the sample, with an adjusted R2 = 85.0%. The prediction equation was:
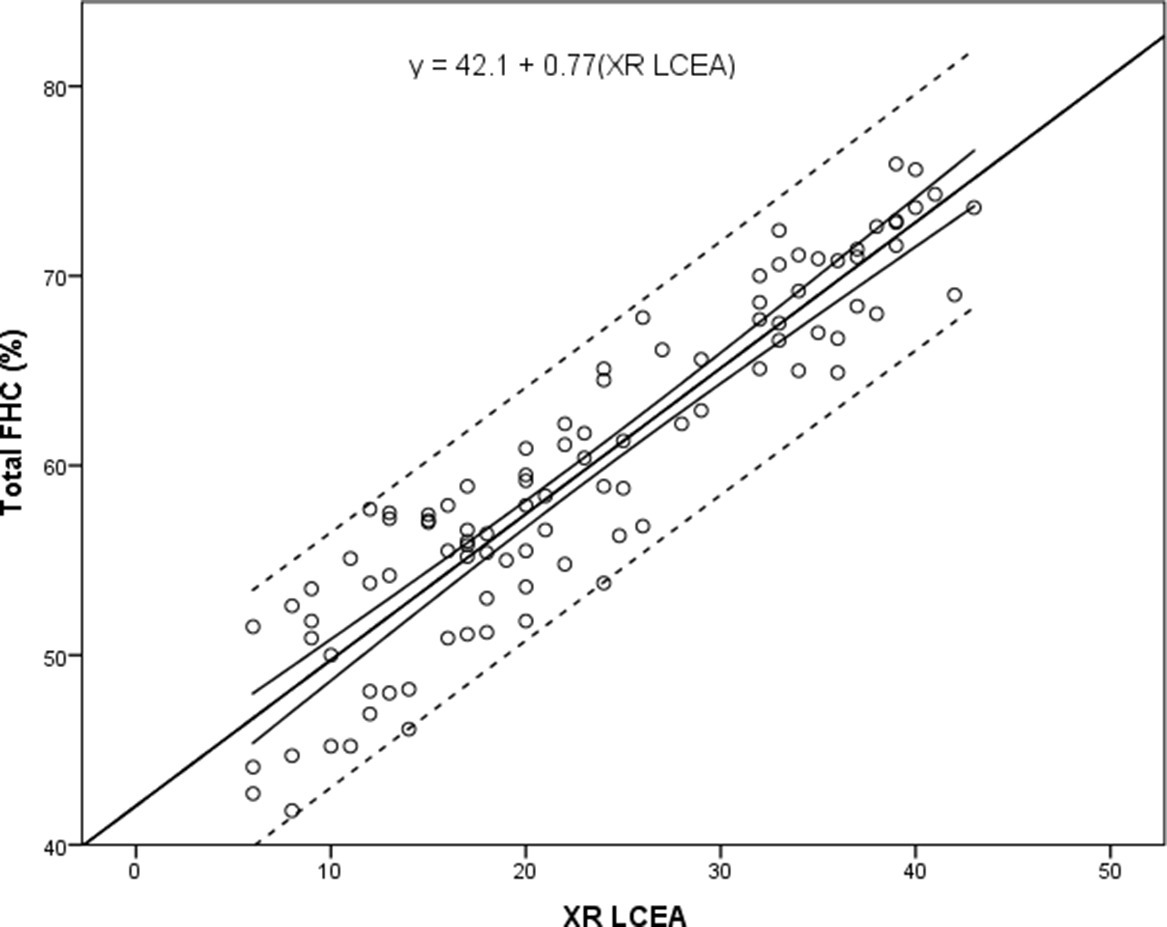
Fig. 5
Scatter plot of X-ray (XR) lateral centre-edge angle (LCEA) (°) against total CT femoral head cover (FHC) (%). Regression line and 95% confidence intervals (solid lines), and prediction intervals (dotted line) shown.
95% CI for the intercept is 40.0° to 43.7° (p < 0.001), and for the coefficient 0.70 to 0.84 (p < 0.001). Radiological LCEA statistically significantly predicted CT FHC, F(1,96) = 545.1 (p < 0.001).
When this linear regression model was used to predict FHC, a radiological LCEA of 25° predicted FHC of 61.3% (95% CI 60.6 to 62.0; p < 0.001). Other predicted values are summarized in Table III. Figure 6 highlights the findings that hips with a LCEA of ≥ 30° had CT FHC that fell within a range of values considered normal from previous data,3,4 but hips with LCEAs < 30° did not all fall into the ‘dysplastic’ range.
Table III.
Predicted femoral head cover for different radiological lateral centre-edge angle according to simple linear regression model.
| Radiological LCEA, ° | Predicted FHC, % (95% CI) | p-value |
|---|---|---|
| 17.5 | 55.5 (54.8 to 56.3) | < 0.001 |
| 20 | 57.4 (56.7 to 58.1) | < 0.001 |
| 22.5 | 59.4 (58.7 to 60.0) | < 0.001 |
| 25 | 61.3 (60.6 to 62.0) | < 0.001 |
| 27.5 | 63.2 (62.5 to 63.9) | < 0.001 |
| 30 | 65.1 (64.3 to 65.9) | < 0.001 |
| 32.5 | 67.1 (66.1 to 68.0) | < 0.001 |
| 35 | 69.0 (68.0 to 70.0) | < 0.001 |
-
CI, confidence interval; FHC, femoral head cover; LCEA, lateral centre-edge angle.
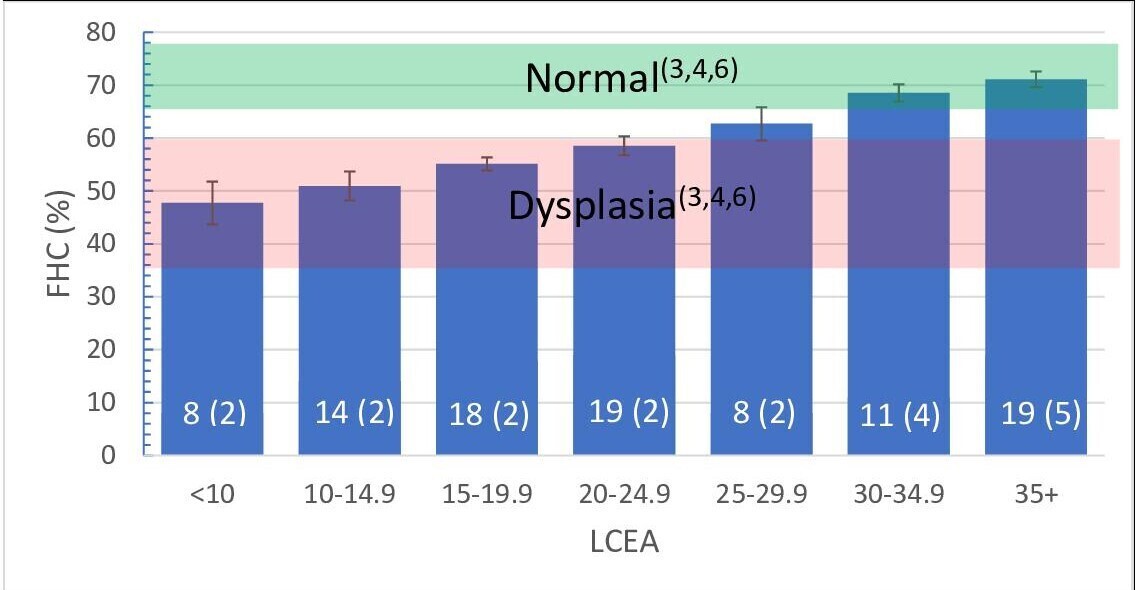
Fig. 6
Bar chart showing mean CT femoral head cover (FHC) (%, error bars denote 95% confidence intervals (CIs)) for ranges of lateral centre-edge angle (LCEA). Number in each group is shown with the number of unoperated hips in brackets. Green shaded area represents the 95% CI for FHC in ‘normal’ or ‘control’ patients, and the red bar denotes 95% CIs for dysplastic patients obtained from previous studies.3,4,6
Discussion
The LCEA is one of the radiological measures used to assess acetabular coverage of the hip. The development of CT imaging has led to attempts to quantify FHC as a percentage of the area of the femoral head covered by the acetabulum.3,4,11,12 Different methods of calculation will give different percentages for the same hip. In this study, normal FHC is around 70%.3 Other CT methods using a topographical representation or ‘bird’s eye’ view of the femoral head to calculate cover give similar values for FHC (Table IV). Two studies give much lower ‘normal’ values. Both Larson et al13 and Hansen et al14 use a larger surface area of the femoral head as the denominator in calculating FHC, compared to the topographical methods, which tend to use only the upper part of the femoral head above its equator.
Table IV.
Summary of studies investigating femoral head cover using CT techniques.
| Study | FHC normal or asymptomatic group (number of hips) | FHC patient group (number of hips) |
|---|---|---|
| Topographical methods | ||
| Cheng et al 20154 | 70.1%, SD 5.7 (40) | 44.7%, SD 10.1 (42) |
| Dandachli et al 200915 | 71%, SD 4.6 (40) | 72%, SD 5.0 (24)* |
| Dandachli et al 20083 | 73%, 95% CI 71 to 74 (36) | 54%, 95% CI 38 to 64 (39) |
| Klaue et al 19886 | 70% (21) | 33% to 55% (25) |
| Liu et al 201512 | Not studied | 52.6, 2.6 (4) |
| Other methods | ||
| Larson et al 201513 | 40%, 2 (409) | Not studied |
| Hansen et al 201214 | 58%, 4.8 (18) | 50%, 4.4 (16) |
-
*
Patient group retroversion.
Many CT-based techniques assume the femoral head is spherical. We made the same assumption in this study, hence the exclusion of two cases. The assumption of a spherical femoral head also negates the effect of femoral version on hip biomechanics and symptomatology. Other limitations of this study include its retrospective nature, cohort bias, and the absence of a control arm. Although the mean FHC for the 19 asymptomatic hips was greater than the symptomatic, operated hips, it was not statistically significant. The asymptomatic hips were all the opposite hip to an operated, symptomatic hip, and therefore cannot be considered ‘normal’.
Radiological LCEA and AI were reliably measured in this study with inter- and intraclass coefficients > 0.9, consistent with previous studies.8,16,17 AWI and PWI were less reliably measured with inter- and intraobserver reliability lower than previous work,18,19 but greater than what has been accepted previously for reproducibility of measures for acetabular parameters.5,7,14 This may reflect the ease with which AWI and PWI measurements are made – in particular, identification of the anterior and posterior walls.
There is disagreement surrounding whether radiological findings alone can be used to make a mechanically based diagnosis,20-22 and whether radiological and CT findings correlate.5,13,14,23,24 This study has demonstrated a very strong correlation between radiologically measured LCEA and AI with CT measured LCEA and AI. In addition, this study demonstrates a very strong relationship between radiologically measured LCEA and CT-measured FHC. Although these correlations are strong, it should be noted that radiological LCEA measured on average 3.4° more than CT LCEA at 1200, and conversely XR AI measured 2.3° greater than CT AI. Both differences were statistically significant and could potentially be clinically relevant. However, it could be argued that these differences compensate for each other in the calculation of FHC, given that lower LCEA and higher AI represent a less covered hip. This may explain the strong correlation between XR LCEA and the CT FHC.
The difference between radiological LCEA and CT LCEA is similar to one previous study,25 but in contrast to others.8,24 This might be attributable to slight methodological differences in the measurement of LCEA from a coronal CT slice through the centre of the femoral head,8 or a CT slice in which the femoral head is at its greatest diameter,24 compared to measurement from the femoral head centre as calculated from a best fit sphere as in this study. No previous studies have reported correlation values for CT-measured AI and radiologically measured AI, although good correlation between radiological AI and CT-derived digitally reconstructed radiographs has been reported.25
This study demonstrates a very strong linear relationship between radiological LCEA and CT FHC, and a strong linear relationship between WALLSUM and CT FHC. Few studies have looked at the relationship between radiological parameters and CT-derived FHC,3,5,14,15 and these have concentrated on acetabular retroversion. None have described the relationships displayed in this work. Assessments of FHC describing the angular relationships between the femoral head centre and the acetabular rim at different points (subtended angles) have been described.11,16 Although this gives a more precise description of the cover at a particular point, the topographical methods (such as those used here) give a simpler representation of global cover, which is easier to understand and compare within a population.5,13,14,26-28
Biplanar radiography can be used to calculate FHC,4,17,23,29,30 but this is not universally available and high-resolution 3D reconstruction to assess femoral head morphology is not possible using this technique. Estimations of FHC can also be made from a single AP radiograph.21,31,32 Values for ‘normal’ FHC are 75% to 83%.21,32 This figure bears greater resemblance to the topographical CT methods, like those used in this study (albeit slightly higher), than other CT methods of coverage assessment where a larger portion of the femoral head sphere is used as a denominator.13,14
Furthermore, the relationship between FHC and LCEA is so strong that incorporating other radiological parameters made the model more complicated, with little increase in accuracy, and therefore it is not as clinically useful. This supports the use of LCEA as a 2D measure of lateral FHC. Patients in this study with a radiological LCEA < 20° had low FHC, as described by previous work summarized in Table IV.
Of the 38 patients with a normal LCEA (> 25°), nine patients had FHC that was abnormal (< 66%.3 Although these patients had a lower AWI, PWI, and WALLSUM than the other 29 patients with a LCEA > 25° and normal FHC (> 66%), these differences were not significant. This could represent a type II error or represent the poorer inter- and intraobserver reliability of making the AWI and PWI measurements.
It should be stressed that not all patients with low FHC will have symptoms, and not all patients with symptoms have low FHC. Abnormalities of femoral version, combined abnormalities of acetabular and femoral version, and connective tissue disorders such as hypermobility can all contribute to mechanical abnormalities of hip function and hip symptoms. Although there is a trend towards lower FHC with higher femoral neck anteversion, numbers are too small to draw meaningful conclusions. PAO can be indicated in conditions with normal or excessive FHC, such as femoroacetabular impingement, and acetabular retroversion.33-36
In summary, CT and radiological measures of LCEA and AI correlate strongly. Although radiological LCEA measures slightly greater than CT LCEA there is a strong relationship between radiological LCEA and CT FHC that can be used to predict CT FHC from radiological LCEA. It should be recognized that young patients with hip pain and radiological indices within the existing boundaries of normality may still have significant deficiency of FHC. We advocate the use of more sophisticated imaging techniques, such as 3D CT, to more accurately quantify this as part of the diagnostic process and to help formulate a logical treatment plan.
References
1. Wiberg G . Studies on Dysplastic Acetabula and Congenital Subluxation of the Hip Joint with Special Reference to the Complication of Osteoarthritis . Stockholm : Exp, Norstedt . 1939 . Google Scholar
2. Heyworth BE , Dolan MM , Nguyen JT , Chen NC , Kelly BT . Preoperative Three-dimensional CT Predicts Intraoperative Findings in Hip Arthroscopy . Clin Orthop Relat Res . 2012 ; 470 ( 7 ): 1950 – 1957 . Crossref PubMed Google Scholar
3. Dandachli W , Kannan V , Richards R , Shah Z , Hall-Craggs M , Witt J . Analysis of cover of the femoral head in normal and dysplastic hips: new CT-based technique . J Bone Joint Surg Br . 2008 ; 90-B ( 11 ): 1428 – 1434 . Crossref PubMed Google Scholar
4. Cheng H , Liu L , Yu W , Zhang H , Luo D , Zheng G . Comparison of 2.5D and 3D quantification of femoral head coverage in normal control subjects and patients with hip dquantification of femoral head coverage in normal control subjects and patients with hip dysplasia . PLoS One . 2015 ; 10 ( 11 ): e0143498 . Google Scholar
5. Stubbs AJ , Anz AW , Frino J , Lang JE , Weaver AA , Stitzel JD . Classic measures of hip dysplasia do not correlate with three-dimensional computer tomographic measures and indices . Hip Int . 2011 ; 21 ( 5 ): 549 – 558 . Google Scholar
6. Klaue K , Wallin A , Ganz R . CT evaluation of coverage and congruency of the hip prior to osteotomy . Clin Orthop . 1988 ; 232 : 15 – 25 . PubMed Google Scholar
7. Monazzam S , Bomar JD , Cidambi K , Kruk P , Hosalkar H . Lateral center-edge angle on conventional radiography and computed tomography . Clin Orthop . 2013 ; 471 ( 7 ): 2233 – 2237 . Crossref PubMed Google Scholar
8. Chadayammuri V , Garabekyan T , Jesse M. K , Pascual-Garrido C , Strickland C , Milligan K . Measurement of lateral acetabular coverage: a comparison between CT and plain radiography . J Hip Preserv Surg . 2015 ; 2 ( 4 ): 392 – 400 . Crossref PubMed Google Scholar
9. Fleiss JL . Measuring nominal scale agreement among many raters . Psychol Bull . 1971 ; 76 ( 5 ): 378 . Google Scholar
10. Landis JR , Koch GG . The measurement of observer agreement for categorical data . Biometrics . 1977 ; 33 ( 1 ): 159 – 174 . PubMed Google Scholar
11. Haddad FS , Garbuz DS , Duncan CP , Janzen DL , Munk PL . CT evaluation of periacetabular osteotomies . J Bone Joint Surg Br . 2000 ; 82-B ( 4 ): 526 – 531 . Crossref PubMed Google Scholar
12. Liu L , Ecker T , Xie L , Schumann S , Siebenrock K , Zheng G . Biomechanical validation of computer assisted planning of periacetabular osteotomy: A preliminary study based on finite element analysis . Med Eng Phys . 2015 ; 37 ( 12 ): 1169 – 1173 . Crossref PubMed Google Scholar
13. Larson CM , Moreau-Gaudry A , Kelly BT , Thomas Byrd JW , Tonetti J , Lavallee S . Are normal hips being labeled as pathologic? A CT-based method for defining normal acetabular coverage . Clin Orthop Relat Res . 2015 ; 473 ( 4 ): 1247 – 1254 . Crossref PubMed Google Scholar
14. Hansen BJ , Harris MD , Anderson LA , Peters CL , Weiss JA , Anderson AE . Correlation between radiographic measures of acetabular morphology with 3D femoral head coverage in patients with acetabular retroversion . Acta Orthop . 2012 ; 83 ( 3 ): 233 – 239 . Crossref PubMed Google Scholar
15. Dandachli W , Islam SU , Liu M , Richards R , Hall-Craggs M , Witt J . Three-dimensional CT analysis to determine acetabular retroversion and the implications for the management of femoro-acetabular impingement . J Bone Joint Surg Br . 2009 ; 91 ( 8 ): 1031 – 1036 . Crossref PubMed Google Scholar
16. Grammatopoulos G , Speirs AD , KCG N , Riviere C , Rakhra KS , Lamontagne M . Acetabular and spino-pelvic morphologies are different in subjects with symptomatic cam femoro-acetabular impingement . J Orthop Res . 2018 ; 36 ( 7 ): 1840 – 1848 . Crossref PubMed Google Scholar
17. Fritz B , Agten CA , Boldt FK , Zingg PO , Pfirrmann CW , Sutter R . Acetabular coverage differs between standing and supine positions: model-based assessment of low-dose biplanar radiographs and comparison with CT . Eur Radiol . 2019 ; 29 ( 10 ): 5691 – 5699 . Crossref PubMed Google Scholar
18. Anderson LA , Anderson MB , Erickson JA , Chrastil J , Peters CL . Acetabular wall indices help to distinguish acetabular coverage in asymptomatic adults with varying morphologies . Clin Orthop . 2017 ; 475 ( 4 ): 1027 – 1033 . Crossref PubMed Google Scholar
19. Siebenrock KA , Kistler L , Schwab JM , Büchler L , Tannast M . The acetabular wall index for assessing anteroposterior femoral head coverage in symptomatic patients . Clin Orthop . 2012 ; 470 ( 12 ): 3355 – 3360 . Crossref PubMed Google Scholar
20. Jacobsen S , Sonne-Holm S , Søballe K , Gebuhr P , Lund B . Hip dysplasia and osteoarthrosis: a survey of 4151 subjects from the osteoarthrosis substudy of the copenhagen city heart study . Acta Orthop . 2005 ; 76 ( 2 ): 149 – 158 . Crossref PubMed Google Scholar
21. Kojima A , Nakagawa T , Tohkura A . Simulation of acetabular coverage of femoral head using anteroposterior pelvic radiographs . Arch Orthop Trauma Surg . 1998 ; 117 ( 6–7 ): 330 – 336 . Crossref PubMed Google Scholar
22. Clohisy JC , Carlisle JC , Trousdale R , Kim Y. J , Beaule PE , Morgan P . Radiographic evaluation of the hip has limited reliability . Clin Orthop . 2009 ; 467 ( 3 ): 666 – 675 . Crossref PubMed Google Scholar
23. Humbert L , Carlioz H , Baudoin A , Skalli W , Mitton D . 3d evaluation of the acetabular coverage assessed by biplanar x-rays or single anteroposterior x-ray compared with ct-scan . Comput Methods Biomech Biomed Engin . 2008 ; 11 ( 3 ): 257 – 262 . Crossref PubMed Google Scholar
24. Rivière C , Lazennec J. Y , Van Der Straeten C , Auvinet E , Cobb J , Muirhead-Allwood S . The influence of spine-hip relations on total hip replacement: A systematic review . Orthop Traumatol Surg Res . 2017 ; 103 ( 4 ): 559 – 568 . Crossref PubMed Google Scholar
25. Wylie JD , Kapron AL , Peters CL , Aoki SK , Maak TG . Relationship between the lateral center-edge angle and 3-dimensional acetabular coverage . Orthop J Sports Med . 2017 ; 5 ( 4 ): 2325967117700589 . Crossref PubMed Google Scholar
26. Wassilew GI , Heller MO , Janz V , Perka C , Müller M , Renner L . High prevalence of acetabular retroversion in asymptomatic adults: a 3D CT-based study . Bone Joint J . 2017 ; 99-B ( 12 ): 1584 – 1589 . Crossref PubMed Google Scholar
27. Wassilew GI , Heller MO , Diederichs G , Janz V , Wenzl M , Perka C . Standardized AP radiographs do not provide reliable diagnostic measures for the assessment of acetabular retroversion . J Orthop Res . 2012 ; 30 ( 9 ): 1369 – 1376 . Google Scholar
28. Wenzl MP , Heller M , Janz V , Perka C , Wassilew GI . Validation of CT image-based software for three-dimensional measurement of acetabular coverage profile . Technol Health Care Off J Eur Soc Eng Med . 2017 ; 25 ( 5 ): 989 – 1004 . Crossref PubMed Google Scholar
29. Tannast M , Hanke MS , Zheng G , Steppacher SD , Siebenrock KA . What Are the Radiographic Reference Values for Acetabular Under- and Overcoverage . Clin Orthop . 2015 ; 473 ( 4 ): 1234 – 1246 . Crossref PubMed Google Scholar
30. Janssen MMA , Drevelle X , Humbert L , Skalli W , Castelein RM . Differences in male and female spino-pelvic alignment in asymptomatic young adults: a three-dimensional analysis using upright low-dose digital biplanar X-rays . Spine . 2009 ; 34 ( 23 ): E826 . Crossref PubMed Google Scholar
31. Zheng G , Tannast M , Anderegg C , Siebenrock K-. A , Langlotz F . Hip2Norm: an object-oriented cross-platform program for 3D analysis of hip joint morphology using 2D pelvic radiographs . Comput Methods Programs Biomed . 2007 ; 87 ( 1 ): 36 – 45 . Crossref PubMed Google Scholar
32. Konishi N , Mieno T . Determination of acetabular coverage of the femoral head with use of a single anteroposterior radiograph. A new computerized technique . J Bone Joint Surg Am . 1993 ; 75-A ( 9 ): 1318 – 1333 . Crossref PubMed Google Scholar
33. Morris WZ , Kim Y-. J , Millis MB , Novais EN . The Reverse Periacetabular Osteotomy: Indications and Surgical Technique . Oper Tech Orthop . 2020 ; 30 ( 1 ). Google Scholar
34. Parry JA , Swann RP , Erickson JA , Peters CL , Trousdale RT , Sierra RJ . Midterm Outcomes of Reverse (Anteverting) Periacetabular Osteotomy in Patients With Hip Impingement Secondary to Acetabular Retroversion . Am J Sports Med . 2016 ; 44 ( 3 ): 672 – 676 . Crossref PubMed Google Scholar
35. Wyatt MC , Smith C , Zavareh A , Pfluger D , Bankes MJ . Functional acetabular retroversion syndrome: description of a specific sub-type of FAI and results of treatment with minimally invasive PAO . Hip Int J Clin Exp Res Hip Pathol Ther . 2019 ; 1120700019855240–1120700019855240 . Crossref PubMed Google Scholar
36. Levy D , Hellman MD , Haughom B , Stover M , Nho SJ . Techniques and results for open hip preservation . Front Surg Frontiers Media SA . 2016 ; 2 : 64 . Crossref PubMed Google Scholar
Author contributions
S. Salih: Conceptualization, Investigation, Formal analysis, Writing – original draft, Writing – review & editing.
G. Grammatopoulos: Conceptualization, Methodology, Writing – review & editing.
S. Burns: Investigation, Validation, Formal analysis, Writing – original draft.
M Hall-Craggs: data analysis, manuscript review
J Witt: Senior author, data collection, performed all surgery, manuscript drafting and editing
Funding statement
No benefits in any form have been received or will be received from a commercial party related directly or indirectly to the subject of this article.
ICMJE COI statement
J. Witt reports payment for lectures from JRI, unrelated to the study. S. Salih reports payment from Sheffield Orthopaedics Ltd, unrelated to this study. G. Grammatopoulos reports institutional grants from CIHR, TOHAMO, and Stryker, unrelated to the study, and a patent from Formulabs, also unrelated to the study.
Follow S. Salih @nomapod
Open access funding
The authors confirm that the open access fee for this article was self-funded.
© 2021 Author(s) et al. This is an open-access article distributed under the terms of the Creative Commons Attribution Non-Commercial No Derivatives (CC BY-NC-ND 4.0) licence, which permits the copying and redistribution of the work only, and provided the original author and source are credited. See https://creativecommons.org/licenses/by-nc-nd/4.0/.
