


Abstract
Aims
The aim of this study was to assess medium-term improvements following total hip arthroplasty (THA), and to evaluate what effect different preoperative Oxford Hip Score (OHS) thresholds for treatment may have on patients’ access to THA and outcomes.
Methods
Patients undergoing primary THA at our institution with an OHS both preoperatively and at least four years postoperatively were included. Rationing thresholds were explored to identify possible deprivation of OHS improvement.
Results
Overall, 2,341 patients were included. Mean OHS was 19.7 (SD 8.2) preoperatively and 39.7 (SD 9.8) at latest follow-up. An improvement of at least eight-points, the minimally important change (MIC), was seen in 2,072 patients (88.5%). The mean improvement was 20.0 points (SD 10.5). If a rationing threshold of OHS of 20 points had been enforced, 90.8% of those treated would have achieved the MIC, but only 54.3% of our cohort would have had access to surgery; increasing this threshold to 32 would have enabled 89.5% of those treated to achieve the MIC while only depriving 6.5% of our cohort. The ‘rationed’ group of OHS > 20 had significantly better OHS at latest follow-up (42.6 vs 37.3; p < 0.001), while extending the rationing threshold above 32 showed postoperative scores were more significantly affected by the ceiling effect of the OHS.
Conclusion
The OHS was not designed as a tool to ration healthcare, but if it had been used at our institution for this cohort, applying an OHS threshold of 20 to routine THA access would have excluded nearly half of patients from having a THA; a group in which over 85% had a significant improvement in OHS. Where its use for rationing is deemed necessary, use of a higher threshold may be more appropriate to ensure a better balance between patient access to treatment and chances of achieving good to excellent outcomes.
Cite this article: Bone Jt Open 2022;3(3):196–204.
Take home message
This study supports that total hip arthroplasty (THA) remains an extremely successful operation; over 85% of patients attain the minimally important change in Oxford Hip Score (OHS) following THA, with 25% achieving a maximum score of 48.
A treatment threshold OHS of 20 would exclude nearly 50% of patients who would benefit from a THA.
Using OHS alone is not supported for thresholding purposes.
Surgeons need to be aware of the impact of different rationing strategies should commissioning bodies insist their use.
Introduction
Total hip arthroplasty (THA) is one of the most common elective operations worldwide, with around 100,000 performed annually in the UK (UK).1 For the vast majority of people THA provides lasting relief from intrusive disability, while analysis of a multiattribute general health questionnaire (EuroQol five-dimension (EQ-5D) scores) suggests that nearly 20% of patients awaiting a THA in the UK score less than zero, defined as a health-state “worse than death” (WTD).2 This situation has been exacerbated by the current COVID-19 pandemic, with widespread cancellation of elective surgery, which has meant the number of patients on the waiting list in a state WTD has almost doubled.3 As elective surgery restarts, commissioners and healthcare providers need to consider which patients to prioritize for surgery in view of waiting lists, which were already at their worst in over a decade prior to COVID-19.4-6
In the past, commissioners and providers have focused on various metrics including patient-reported outcome measures (PROMs) and quality-adjusted life years (QALYs) to limit access to arthroplasty; however, thresholds relating to these have often been set with minimal evidence-base.7-10 With increasing numbers of patients awaiting surgery, combined with the likelihood of decreased capacity,11 providers of healthcare must do their best to select patients in a fair, transparent way with the fundamental reassurance that thresholds are evidence-based.
For patients with hip arthritis, the Oxford Hip Score (OHS) is a 48-point validated PROM shown to be reliable when assessing outcome following THA.12,13 Minimally important change (MIC), the smallest change in score perceived as important to an individual patient, and which would indicate a change in management, has been reported as eight points.13,14 However, the OHS was not designed as a tool to threshold for surgery and using it as a sole indicator for this purpose is contentious.
Previous studies have been unable to identify any predictive accuracy of preoperative OHS with regards to postoperative scores or satisfaction using a variety of statistical techniques,14-18 with concerns regarding ceiling effects, minimum clinically important differences (MCID) and change scores. Improvement following surgery is an extremely complex and multifactorial issue, most likely concerning factors that are not known or routinely collected. A large study by Price et al,14 using NHS Hospital Episode Statistics (HES) data on 209,761 hips, recommended that patients with an OHS above 40 should not be routinely referred to secondary care for possible arthroplasty. However, this recommendation leads to no significant reduction in referral numbers so has limited value for commissioning bodies for rationing purposes and is most likely connected to the ceiling effect of the OHS and the inability of patients with these scores to achieve a minimum important change of eight points.
In our catchment area, the Clinical Commissioning Group (CCG) responsible for referral of patients from primary care, has set an arbitrary OHS threshold of 20 for routine referral to secondary care for consideration of THA, matching a trend from other commissioners in the UK and globally to use OHS to ration access to arthroplasty,19,20 despite there being no evidence to support this.
This study aimed to analyze prospectively collected OHS data in the longest, large-scale follow-up using PROMs following THA, and to examine benefit, as well as deprivation, on this cohort from rationing thresholds at varying levels.
Methods
Patients receiving a primary THA for all indications between December 1996 and October 2012 at our institution, with an OHS recorded both preoperatively and at least four years postoperatively, were included in this study. These dates allowed for appropriate analysis prior to implementation in our region of the OHS threshold for referral for THA. With their consent, all patients who undergo THA at our institution have their data added to our database, including patient demographics, surgical details, and prospectively collected OHS. As all data is collected as part of routine ongoing review, specific ethics approval was not required for this study.
All surgeries were performed using a posterior approach with a cemented Exeter V40 stem (Stryker Orthopaedics, USA) and either a cemented or uncemented acetabular component. Routine review was undertaken at one- and five-years postoperatively. Any revision surgery or complications were recorded. Logistically, patients were often seen just prior to the exact five-year anniversary of surgery and hence the decision to analyze scores at a minimum four-year post-surgery.
Follow-up was undertaken either in person by the surgical team or virtually via a patient questionnaire (including questions about complications and revision surgery) and OHS assessment. This was prospectively added to our database. Our hospital episodes database was further checked to corroborate complications recorded locally.
Various thresholds of rationing were explored to identify the impact each strategy would have on patients, including the effect of potential threshold implementation on deprivation of outcomes post THA.
Statistical analysis
Statistical analysis was undertaken using SPSS version 25 (IBM, USA) and NCSS version 10 (NCSS, USA). Frequencies, mean, and standard deviation (SD) are presented. Hypothesis testing was performed using parametric or non-parametric tests, as appropriate.
Results
There were 9,083 primary THAs performed in the timeframe specified, of which 2,341 had both preoperative and minimum four-year postoperative OHS. The mean time to latest score was 4.97 years (SD 0.33; 4.0 to 5.5).
The mean age at surgery was 63.8 years (17 to 92), with 983 patients (42.0%) being male. The mean OHS was 19.7 (SD 8.2) preoperatively and 39.7 (SD 9.8) at latest follow-up. The majority of patients (95.8%) improved their OHS (Table I). Less than 1% had the same score four years postoperatively, and 3.5% reported worse OHS than before surgery. While 7.2% improved between one to seven points, 88.5% had an improvement in OHS of at least eight points reflecting improvement beyond the OHS MIC, and there was a mean improvement of 20 points (SD 10.5) (Figure 1). There were 571 patients (24.4%) with a latest OHS of 48, the maximum possible.
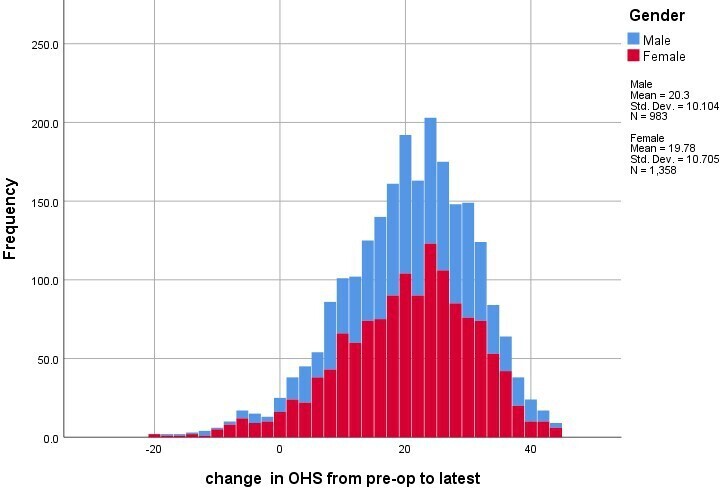
Fig. 1
Histogram of change in Oxford Hip Score by sex.
Table I.
Numbers of patients changing scores from preoperative to latest score.
| Change in score | Frequency, n (%) |
|---|---|
| Worse than preoperative | 82 (3.5) |
| Same as preoperative | 17 (0.7) |
| Improved from preoperative 1 to 4 pts | 83 (3.5) |
| Improved from preoperative 5 to 7 pts | 87 (3.7) |
| Improved from preoperative ≥ 8 pts | 2,072 (88.5) |
| Total | 2,341 (100) |
Using the currently imposed CCG threshold of 20 points, the impact of this rationing strategy on the historical cohort was modelled; almost half (1,069/2,341; 45.7%) of cases would have been denied surgery (Table II). This ‘rationed’ group improved an average of 15.6 points (SD 8.3), almost twice the MIC of eight points. There were 917 of these 1,069 cases that improved at least the MIC of eight points (85.8%). In addition, the ‘rationed’ group had a significantly better OHS at latest follow-up (42.6 vs 37.3; p < 0.001, independent-samples t-test for unequal variances).
Table II.
Impact of various rationing models on the patient cohort of 2,341 cases.
| Model | Justification | Non-‘rationed’ group allowed surgery | ‘Rationed’ group denied surgery | ||||
|---|---|---|---|---|---|---|---|
| Justification | n (%) | Improvement, mean (SD) | Patients allowed surgery achieving MIC, n (%) | n (%) | Improvement, mean (SD) | Patients prevented from achieving MIC, n (%) | |
| ≤ 20 points | Current CCG threshold | 1,272 (54.3) | 23.7 (10.6) | 1,155/1,272 (90.8) | 1,069 (45.7) | 15.6 (8.3) | 917/1,069 (85.8) |
| ≤ 24 points | Half maximum possible score | 1,668 (71.3) | 22.6 (10.3) | 1,508/1,668 (90.4) | 673 (28.7) | 13.5 (7.6) | 564/673 (83.8) |
| ≤ 30 points | Alternative proposed cut-off | 2,099 (89.7) | 21.2 (10.2) | 1,890/2,099 (90.0) | 242 (10.3) | 9.8 (6.2) | 182/242 (75.2) |
| ≤ 32 points | 2/3 maximum possible score | 2,189 (93.5) | 20.8(10.3) | 1,960/2,189 (89.5) | 152 (6.5) | 9.2 (5.1) | 112/152 (73.7) |
| ≤ 41 | Proposed by Price et al14 | 2,333 (99.7) | 20.1 (10.4) | 2,072/2,333 (88.8) | 8 (0.3) | 3.8 (3.8) | 0/8 (0.0) |
-
CCG, Clinical Commissioning Group; MIC, minimally important change; SD, standard deviation.
When different potential OHS thresholds were applied (Table II, Figure 2), a threshold of 32 tended towards optimizing patient outcome and ensuring that the maximum number of people (89%) achieved the MIC of eight points (mean change in OHS 20.8 (SD 10.3)). Setting a threshold of 32 would have deprived 152 patients (6.5%) of surgery, 112 (73.7%) of which would have been prevented from achieving the MIC and hence making a significant improvement to their quality of life.
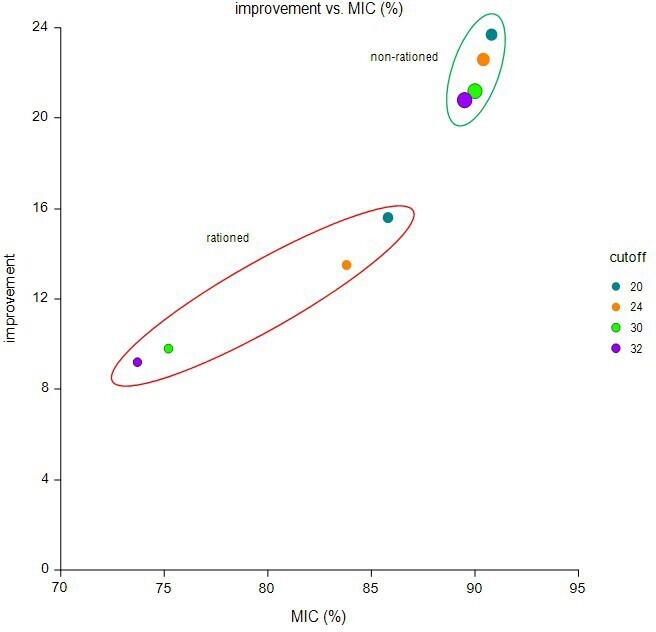
Fig. 2
Scatterplot indicating the improvement in Oxford Hip Score versus the percentage of patients achieving the minimally important change (MIC) of eight points by theoretical rationing cut-offs; size of the dots are indicative of sample size in each band.
Splitting the cohort to preoperative bands of eight points (the MIC) to represent the variation within the cohort, demonstrated that the majority of patients (34.1%) were in the 17 to 24-point bracket, with 93.5% of patients having a score of 32 or below (Table III). The change in score and banding of each of these categories is also shown graphically in Figure 3.
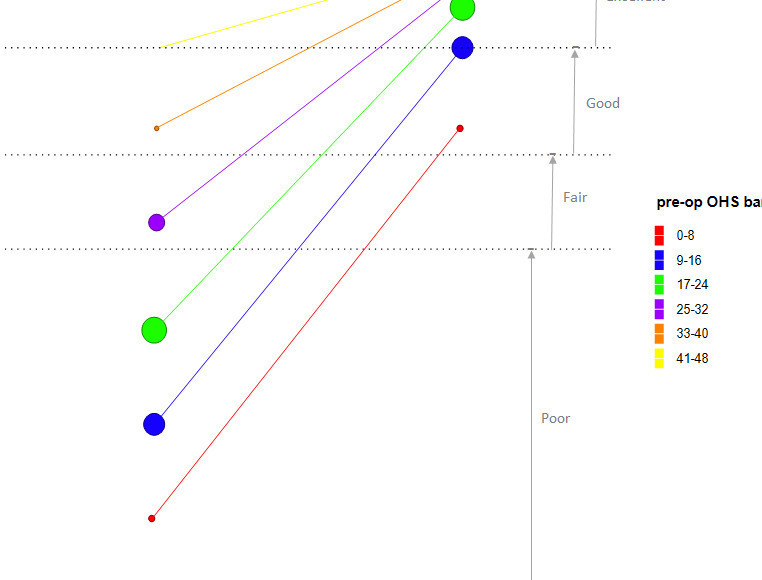
Table III.
Frequencies of patients in preoperative Oxford Hip Score (OHS) bands with improvement in OHS.
| Preoperative OHS band | Frequency, n (%) | Cumulative, % | Improvement in OHS, mean (SD) |
|---|---|---|---|
| 0 to 8 | 201 (8.6) | 8.6 | 27.0 (11.5) |
| 9 to 16 | 668 (28.5) | 37.1 | 24.2 (10.7) |
| 17 to 24 | 799 (34.1) | 71.3 | 20.2 (8.9) |
| 25 to 32 | 521 (22.3) | 93.5 | 14.8 (7.8) |
| 33 to 40 | 144 (6.2) | 99.7 | 9.5 (5.0) |
| 41 to 48 | 8 (0.3) | 100.0 | 3.8 (3.8) |
| Total | 2,341 (100) |
-
SD, standard deviation.
Lower preoperative OHS (Figure 3, Table III), resulted in larger improvement in latest OHS (r = −0.472; 95% confidence interval (CI) -0.503 to -0.440; p < 0.001, test of significance). This improvement was greater in the groups with preoperative OHS of 32 or below. However, patients with a preoperative OHS of greater than 32 were limited by the ceiling effect of the OHS. Categories of excellent (> 41), good (34 to 41), fair/satisfactory (27 to 33), and poor (< 27) are also highlighted.12,21 Starting in one of the higher OHS bands increases the chances of achieving an excellent outcome compared to those starting with a lower preoperative OHS band (Table IV, Spearman correlation = 0.312; p < 0.001, test of significance). The ceiling effect is clearly visible in a scatterplot of pre-op and latest OHS (Figure 4).
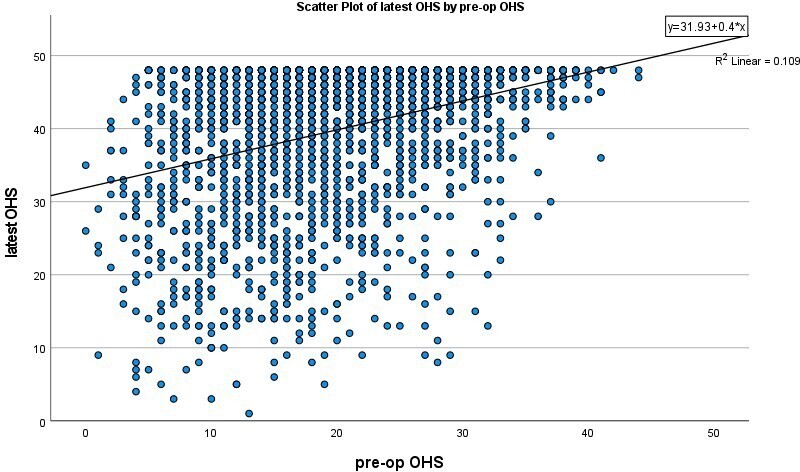
Fig. 4
Scatterplot of preoperative and latest Oxford Hip Score.
Table IV.
| Latest follow-up OHS category n (%) | |||||
|---|---|---|---|---|---|
| Preoperative OHS band | Poor | Fair | Good | Excellent | Total, n |
| 0 to 8 | 59 (29.4) | 39 (19.4) | 46 (22.9) | 57 (28.4) | 201 |
| 9 to 16 | 129 (19.3) | 80 (12.0) | 146 (21.9) | 313 (46.9) | 668 |
| 17 to 24 | 74 (9.3) | 81 (10.1) | 145 (18.1) | 499 (62.5) | 799 |
| 25 to 32 | 25 (4.8) | 25 (4.8) | 96 (18.4) | 375 (72.0) | 521 |
| 33 to 40 | 2 (1.4) | 6 (4.2) | 14 (9.7) | 122 (84.7) | 144 |
| 41 to 48 | 0 | 0 | 1 (12.5) | 7 (87.5) | 8 |
| Total | 289 | 231 | 448 | 1,373 | 2,341 |
Discussion
Our data supports the literature confirming that a vast majority of patients undergoing THA gain significant benefit, with over 95% in our study improving on their preoperative OHS. Approximately 88% attained the MIC of at least eight points following THA, while almost a quarter achieved the maximum possible score of 48 at four years postoperatively. While much of the literature cover PROMs up to six months postoperatively, our study confirms that medium-term PROMs remain excellent for a large majority of people undergoing THA for any indication.
Retrospectively modelling the OHS threshold of 20 currently mandated by our healthcare commissioners demonstrated that it would have excluded approximately 45% of patients from receiving a THA at our institution. An OHS of less than 27 points is categorized as ‘poor function’, meaning a proportion of these patients would be denied surgery under the current threshold.12,21 If these 45% of patients who had been referred for THA were in fact prevented from having surgery by our CCGs threshold of 20, it would have denied a meaningful clinical improvement or MIC OHS to over 85% of them (917 patients in this cohort). Increasing this threshold above a score of 20 would have reduced the number of patients that were denied a meaningful improvement in OHS.
Other publications have shown that preoperative OHS has minimal ability to predict postoperative OHS at four to five years,14-18 and so its use as a screening tool for surgery needs to be carefully considered. In the UK, it has been found by a Royal College of Surgeons of England report that over 30% (16/52) CCGs set arbitrary thresholds based on the OHS, ranging from scores of 20 to 25.10
The Arthroplasty Candidacy Help Engine (ACHE) tool was a National Institute for Health Research (NIHR)-funded project with two aims: first, to assess whether PROMs can be used to set a threshold for hip or knee arthroplasty, and second, to see how threshold variation affects cost-effectiveness.22 They evaluated various PROMs and concluded that the OHS was the best instrument for THA and recommended a threshold of 40, which was also later reiterated by a subset of the same authors in an additional publication.14 With the maximum score of the OHS being 48, this high threshold may be related to the ceiling effect of the OHS given that a preoperative score of 40 means the patient must score a maximum score of 48 postoperatively to meet the MIC of eight. Using the thresholding recommended by Price et al,14,22 in both these publications on the cohort of patients presented in this study would only have denied THA to eight patients and so has limited effect in reducing numbers being referred for arthroplasty surgery, resulting in limited relevance to healthcare commissioners.
The cost-effectiveness analysis in the ACHE study revealed that using an OHS threshold of 20 is equivalent to using a quality-adjusted life-year (QALY) of approximately £1000, far below the National Institute for Health and Care Excellence (NICE) recommended threshold between £20,000 and £30,000,23 and that actually THA remained cost-effective for an average aged patient up to a preoperative OHS of 42. The vast majority of PROMs data used in the ACHE study was derived from NHS PROMs collected at six months post-operation, and only approximately 1% (1,179/102,404) of data used to analyze changes in OHS being derived from two year postoperative PROMs from the Exeter Primary Outcome Study (EPOS). Our study, by contrast, analyzed outcomes from PROMs at least four years postoperatively, with nearly double the number of patients evaluated in the EPOS cohort.
The EPOS study recruited from 1999 to 2002 across seven centres in the UK.16 Their published results concluded that while most patients benefit greatly from THA at one-year post-operation, there was no significant change in PROMs from one to five years postoperatively. In contrast to our study, the EPOS found that at one-year postoperatively, 2.3% of patients had a worse OHS but this had dropped to 1.2% by five years, likely indicating there was ongoing improvement during this time. They created a model to predict the postoperative OHS; however, they found that preoperative OHS only accounted for 10.3% of the variability.
A group from New Zealand examined changes in OHS out to one year for 713 THAs, with a mean improvement in OHS of 26.8 and supported its use to inform decisions regarding rationing, but noted that delaying surgery until the preoperative score was low was correlated with a lower postoperative score, denying these patients better outcomes.18 They found that age was a significant non-linear predictor of outcome in terms of OHS, with the improvement being greatest in those aged over 60 years. They also noted that although some evidence suggests cost-effectiveness at OHS > 35,17 there is in fact a more limited gain in HRQoL scores.
The OHS was developed for use in clinical trials, not as a score for commissioning healthcare.24 Concern exists regarding its use in rationing; for example, there is an obvious potential for patients/assessors to attempt to adjust their answers to the questionnaire such that they fall within a target threshold.18 Concerns have also been expressed about the fact that preoperative OHS may not predict postoperative satisfaction.15 There are many other factors that should be considered, including age, comorbidities, radiological severity, and speed of decline. Delaying surgery until OHS has declined may also have increased healthcare costs in terms of supported living and social care packages; such indirect costs are difficult to assess and poorly considered in the literature. There is also evidence that delaying THA surgery can negatively affect outcomes one-year post-THA.25
Although the OHS itself has been validated for assessing outcome following THA by some studies12,13 there have been concerns in the literature regarding ‘floor and ceiling’ effects, where patients scoring at the extremes of the scale may have significant changes that are unable to be detected by the score.26-28 Some literature estimates the OHS to have a ceiling effect of over 20% in both the pain and function subscales, with a global ceiling effect of 13.4%, while in our cohort it was 24.4%.29
Despite these concerns, the OHS is already, and increasingly, being used by commissioning bodies as a tool for thresholding purposes in an arbitrary way. It is therefore vital that surgeons engage with this process and work alongside healthcare commissioners to ensure patients are treated in the most appropriate manner; prioritising the patient while considering the reduced resources available. This can be more appropriately done by identifying more suitable thresholds, and with an understanding of the impact they will yield and to ensure some evidence is used for these thresholds rather than arbitrary figures, as we have experienced in our Trust (Royal Devon & Exeter NHS Foundation Trust).
If the OHS is to be used for setting a threshold, our data supports using an OHS of 32 as a more appropriate score in arthroplasty, to reduce the risk of depriving patients of a significant health gain. Although the OHS was not designed to guide thresholding, some evidence exists to supports its use in this regard. A study by Neufeld et al30 reviewed OHS and correlated it with whether the surgeon was to offer THA at the first consultation. They found that Oxford scores were better in non-surgical cohorts, correlated with the surgical decision and that the ROC area under the curve was excellent at 0.87 (95% CI 0.84 to 0.91). They derived a conservative surgical threshold of OHS > 34 as a threshold, finding in their cohort a sensitivity 0.997 with negative predictive value of 0.978, although the report that lowering this by a small amount would only have a minor effect on excluding possible surgical candidates while removing a large number of non-surgical candidates from review by the surgeon. Interestingly, they proposed that the reason some studies are unable to confirm that preoperative OHS is linked with satisfaction postoperatively is that satisfaction following THA is so high. They also supported the use of the threshold to guide whether the patient was first reviewed by the surgeon (if below threshold) or allied health professional (if above), thereby removing the requirement for all patients to go through the ‘screening’ process in an allied health professional clinic, as is the system in some parts of the UK. This use of the OHS to threshold whether surgical review was required has also been suggested by a study in New Zealand.18 Considering an OHS threshold to guide commission (the ACHE study supports an OHS threshold of 40), this would only exclude 0.3% of the patients who had a THA in our cohort. The vast majority of patients referred have an OHS less than this so we suggest that an OHS of 40 is not a practical tool for CCGs to use as a threshold to proceed to surgery. The ACHE study also calculated cost-effectiveness and related preoperative OHS to cost per QALY; at our threshold, the cost per QALY would be less than £3,000, making it extremely cost-effective. The cost per QALY of an average patient with a preoperative OHS of 20 is just over £1,000; however, at a preoperative score of 40, it is close to £7,000, showing this higher threshold is less cost-effective.
We acknowledge the concern regarding reduced healthcare budgets, especially magnified due to the COVID-19 pandemic, which has led to healthcare commissioners wanting to streamline patients undergoing surgery. Our results seem to suggest that a preoperative OHS threshold of 32 would offer a good compromise of ensuring patients do not suffer as a result of overenthusiastic thresholding while ensuring that surgery is offered to those in most need. We do not believe that an OHS threshold should be enforced as a strict policy since it is clear that in certain circumstances, patients above 32 should still be considered for surgery, especially in view of findings that an isolated OHS is a poor predictor of postoperative outcome.
Limitations of our study include the cohort nature of the study. While it represents our local catchment area, it may not be applicable to all regions and referral burdens and systems have geographical variation. Four-year OHS were obtained in 25.8% of our patients. However, this compares favourably with other studies in this field16 and the prospective nature of data capture along with a minimum four-year postoperative score ensure this is the largest cohort follow-up study.
In conclusion, due to limited budgets, commissioners of healthcare are likely to seek to restrict access of patients for THA. Using an OHS of 20 alone for thresholding can lead to significant healthcare deprivation and in our study, 45.7% of patients who significantly benefited from THA would have been denied the opportunity for surgery. Although we do not agree with the methods currently used for rationing access to arthroplasty, we do acknowledge that access needs to be prioritized and that this should be done with full knowledge of the impact this will have on patients’ lives, and to minimize denying surgery to those who would significantly benefit from it. While the OHS was not designed to be used for rationing THA, we suggest that a more appropriate patient and finance-centred rationing threshold of an OHS of 32, where deemed necessary and appropriate, which is less likely to lead to healthcare inequality while ensuring that patients are treated in an appropriate fashion.
References
1. The NJR Centre . National Joint Registry for England, Wales, Northern Ireland and Isle of Man. 17th Annual Report . 2020 . https://reports.njrcentre.org.uk/downloads ( date last accessed 7 February 2022 ). Google Scholar
2. Scott CEH , MacDonald DJ , Howie CR . “Worse than death” and waiting for a joint arthroplasty . Bone Joint J . 2019 ; 101-B ( 8 ): 941 – 950 . Crossref Google Scholar
3. Clement ND , Scott CEH , Murray JRD , Howie CR , Deehan DJ , IMPACT-Restart Collaboration . The number of patients “worse than death” while waiting for a hip or knee arthroplasty has nearly doubled during the COVID-19 pandemic . Bone Joint J . 2021 ; 103-B ( 4 ): 672 – 680 . Crossref Google Scholar
4. NHS England and NHS Improvement . Second phase of NHS response to COVID-19: letter from Sir Simon Stevens and Amanda Pritchard . 2020 . https://www.england.nhs.uk/coronavirus/publication/second-phase-of-nhs-response-to-covid-19-letter-from-simon-stevens-and-amanda-pritchard/ ( date last accessed 7 February 2022 ). Google Scholar
5. Baker C . NHS Key Statsitics: England, February 2020 . 2020 . https://commonslibrary.parliament.uk/research-briefings/cbp-7281/ ( date last accessed 7 February 2022 ). Google Scholar
6. British Orthopaedic Association . Joint Statement from the BOA and Versus Arthritis on April Waiting Times . 2020 . https://www.boa.ac.uk/resources/press-releases-and-statements/joint-statement-from-the-boa-and-versus-arthritis-on-april-waiting-times.html ( date last accessed 7 February 2022 ). Google Scholar
7. Gwynne-Jones DP , Iosua EE , Stout KM . Rationing for total hip and knee arthroplasty using the new zealand orthopaedic association score: effectiveness and comparison with patient-reported scores . J Arthroplasty . 2016 ; 31 ( 5 ): 957 – 962 . Crossref PubMed Google Scholar
8. Royal College of Surgeons of England . Many CCGs are ignoring clinical evidence in their surgical commissioning policies . 2014 . https://www.rcseng.ac.uk/news-and-events/media-centre/press-releases/many-ccgs-are-ignoring-clinical-evidence-in-their-surgical-commissioning-policies/ ( date last accessed 7 February 2022 ). Google Scholar
9. Dakin H , Gray A , Fitzpatrick R , Maclennan G , Murray D , KAT Trial Group . Rationing of total knee replacement: a cost-effectiveness analysis on a large trial data set . BMJ Open . 2012 ; 2 ( 1 ): e000332 . Crossref PubMed Google Scholar
10. Royal College of Surgeons of England . Is access to surgery a postcode lottery? 2014 . https://www.rcseng.ac.uk/-/media/files/rcs/news-and-events/media-centre/is-access-to-surgery-a-postcode-lottery.pdf ( date last accessed 7 February 2022 ). Google Scholar
11. Findlay R . Health Service Journal , ; 2020 . https://www.hsj.co.uk/free-for-non-subscribers/the-state-of-elective-waiting-times-before-covid-19/7027377.article ( date last accessed 7 February 2022 ). Google Scholar
12. Murray DW , Fitzpatrick R , Rogers K , et al. The use of the Oxford hip and knee scores . J Bone Joint Surg Br . 2007 ; 89-B ( 8 ): 1010 – 1014 . Crossref Google Scholar
13. Beard DJ , Harris K , Dawson J , et al. Meaningful changes for the Oxford hip and knee scores after joint replacement surgery . J Clin Epidemiol . 2015 ; 68 ( 1 ): 73 – 79 . Crossref PubMed Google Scholar
14. Price AJ , Kang S , Cook JA , et al. The use of patient-reported outcome measures to guide referral for hip and knee arthroplasty. part 1: the development of an evidence-based model linking preoperative score to the probability of gaining benefit from surgery . Bone Joint J . 2020 ; 102 ( 7 ): 941 – 949 . Google Scholar
15. Judge A , Arden NK , Price A , et al. Assessing patients for joint replacement: can pre-operative Oxford hip and knee scores be used to predict patient satisfaction following joint replacement surgery and to guide patient selection? J Bone Joint Surg Br . 2011 ; 93-B ( 12 ): 1660 – 1664 . Crossref PubMed Google Scholar
16. Judge A , Arden NK , Batra RN , et al. The association of patient characteristics and surgical variables on symptoms of pain and function over 5 years following primary hip-replacement surgery: a prospective cohort study . BMJ Open . 2013 ; 3 ( 3 ): e002453 . Crossref PubMed Google Scholar
17. Eibich P , Dakin HA , Price AJ , Beard D , Arden NK , Gray AM . Associations between preoperative Oxford hip and knee scores and costs and quality of life of patients undergoing primary total joint replacement in the NHS England: an observational study . BMJ Open . 2018 ; 8 ( 4 ): e019477 . Crossref PubMed Google Scholar
18. Gwynne-Jones DP , Sullivan T , Wilson R , Abbott JH . The relationship between preoperative oxford hip and knee score and change in health-related quality of life after total hip and total knee arthroplasty: can it help inform rationing decisions? Arthroplast Today . 2020 ; 6 ( 3 ): 585 – 589 . Crossref PubMed Google Scholar
19. Royal College of Surgeons of England . RCS responds to CCGs’ plans to ration hip and knee surgery using Oxford score . 2017 . https://www.rcseng.ac.uk/news-and-events/media-centre/press-releases/oxford-score-rationing/ ( date last accessed 7 February 2022 ). Google Scholar
20. Scarborough and Ryedale Clinical Commissioning Group . General commissioning policy: hHip replacement - referral to secondary careGeneral Commissioning Policy: Hip replacement - referral to secondary care . 2016 . https://www.scarboroughryedaleccg.nhs.uk/wp-content/uploads/2019/02/hip-replacement-policy_october-2016.pdf ( date last accessed 7 February 2022 ). Google Scholar
21. Kennedy JA , Mohammad HR , Mellon SJ , Dodd CAF , Murray DW . Age stratified, matched comparison of unicompartmental and total knee replacement . Knee . 2020 ; 27 ( 5 ): 1332 – 1342 . Crossref PubMed Google Scholar
22. Price A , Smith J , Dakin H , et al. THe arthroplasty candidacy help engine tool to select candidates for hip and knee replacement surgery: development and economic modelling . Health Technol Assess . 2019 ; 23 ( 32 ): 1 – 216 . Crossref PubMed Google Scholar
23. National Institute for Health and Care Excellence (NICE) . NICE Process & methods [PMG9]: Guide to the methods of technology appraisal . 2013 . https://www.nice.org.uk/process/pmg9/chapter/foreword ( date last accessed 7 February 2022 ). Google Scholar
24. Dawson J , Fitzpatrick R , Carr A , Murray D . Questionnaire on the perceptions of patients about total hip replacement . J Bone Joint Surg Br . 1996 ; 78-B ( 2 ): 185 – 190 . Crossref PubMed Google Scholar
25. Hajat S , Fitzpatrick R , Morris R , et al. Does waiting for total hip replacement matter? prospective cohort study . J Health Serv Res Policy . 2002 ; 7 ( 1 ): 19 – 25 . Crossref PubMed Google Scholar
26. Marx RG , Jones EC , Atwan NC , Closkey RF , Salvati EA , Sculco TP . Measuring improvement following total hip and knee arthroplasty using patient-based measures of outcome . J Bone Joint Surg Am . 2005 ; 87 ( 9 ): 1999 – 2005 . Crossref PubMed Google Scholar
27. Lim CR , Harris K , Dawson J , Beard DJ , Fitzpatrick R , Price AJ . Floor and ceiling effects in the OHS: an analysis of the NHS PROMs data set . BMJ Open . 2015 ; 5 ( 7 ): e007765 . Crossref PubMed Google Scholar
28. Vajapey SP , Morris J , Spitzer AI , Glassman AH , Greco NJ , Li M . Outcome reporting patterns in total knee arthroplasty: a systematic review . J Clin Orthop Trauma . 2020 ; 11 ( Suppl 4 ): S464 – S471 . Crossref PubMed Google Scholar
29. Garbuz DS , Xu M , Sayre EC . Patients’ outcome after total hip arthroplasty: a comparison between the Western Ontario and McMaster Universities index and the Oxford 12-item hip score . J Arthroplasty . 2006 ; 21 ( 7 ): 998 – 1004 . Crossref Google Scholar
30. Neufeld ME , Masri BA . Can the oxford knee and hip score identify patients who do not require total knee or hip arthroplasty? Bone Joint J . 2019 ; 101-B ( 6_Supple_B ): 23 – 30 . Crossref Google Scholar
Author contributions
R. W. Walker: Investigation, writing – original draft, writing – review and editing.
S. L. Whitehouse: Data curation, Formal analysis, Methodology, Writing – review and editing.
J. R. Howell: Writing – review and editing.
M. J. W. Hubble: Writing – review and editing.
A. J. Timperley: Writing – review and editing.
M. Wilson: Writing – review and editing.
A. Kassam: Conceptualization, Project administration, Supervision, Writing – review and editing.
Funding statement
There is an institutional contract between Styker and the Royal Devon & Exeter NHS Foundation Trust, which covers research projects; however, this project received no specific funding.
ICMJE COI statement
The authors report an an institutional contract between Royal Devon and Exeter Hospital, UK, and Stryker to provide education courses, a long-term database, and research projects, all of which is unrelated to this work. M. Hubble declares royalties from Stryker, while A. Kassam and A. J. Timperley declare consultancy for Stryker, all of which is unrelated. M. J. Wilson reports royalties, support for attending meetings and/or travel, and patents (planned, issued or pending) from Stryker; and being honorary secretary for the British Hip Society, all of which is also unrelated to this work.
Acknowledgements
The authors would like to thank the Exeter Hip Research Team, past and present, for their fastidious efforts to ensure 100% follow-up of patients in Exeter, led by Sandy Wraight, Exeter Hip Research Manager.
Ethical review statement
The work is part of ongoing routine review of patients and so is exempt from IRB approval.
Open access funding
The authors report that the open access funding for this manuscript was self-funded.
Follow S. L Whitehouse @saz_whit
Follow J. R Howell @Exetersurgeon
Follow A. John Timperley @aJohnTimperley
Follow M. J Wilson @ExeterHipUnit
Follow A. M Kassam @alakas99
© 2022 Author(s) et al. This is an open-access article distributed under the terms of the Creative Commons Attribution Non-Commercial No Derivatives (CC BY-NC-ND 4.0) licence, which permits the copying and redistribution of the work only, and provided the original author and source are credited. See https://creativecommons.org/licenses/by-nc-nd/4.0/
