


Abstract
Aims
Describe a statistical and economic analysis plan for the Distal Radius Acute Fracture Fixation Trial 2 (DRAFFT2) randomized controlled trial.
Methods
DRAFFT2 is a multicentre, parallel, two-arm randomized controlled trial. It compares surgical fixation with K-wires versus plaster cast in adult patients who have sustained a dorsally displaced fracture of the distal radius. The primary outcome measure is the Patient-Rated Wrist Evaluation (PRWE, a validated assessment of wrist function and pain) at 12 months post-randomization. Secondary outcomes are measured at three, six, and 12 months after randomization and include the PWRE, EuroQoL EQ-5D-5L index and EQ-VAS (visual analogue scale), complication rate, and cost-effectiveness of the treatment.
Results
This paper describes the full details of the planned methods of analysis and descriptive statistics. The DRAFFT2 study protocol has been published previously.
Conclusion
The planned analysis strategy described records our intent to conduct statistical and within-trial cost-utility analyses.
Cite this article: Bone Joint Open 2020;1-6:245–252.
Introduction
Distal radius fracture is one of the most common reasons for emergency department attendance.1 ‘Manipulation’ of the bone fragments is usually recommended if there is displacement of a dorsally angulated fracture. The manipulation is intended to restore the normal anatomy, i.e. to move the bone fragments back into their normal alignment. After manipulation, the bone fragments may fall back out of normal alignment hence clinicians will apply support to the bone fragments while they heals. This trial will compare two techniques for holding the position of the bone fragments – plaster casting and surgical fixation using Kirschner wires (K-wires).
Plaster casting involves the application of a plaster cast from below the elbow to just above the metacarpal-phalangeal joints. The cast is moulded over the skin to hold the bone fragments in place. It is simple, inexpensive and has few complications but is susceptible to re-displacement especially when the swelling starts to settle a few days after the surgery. Surgical fixation with K-wires involves inserting smooth metal wires with a sharp point through the skin across the fracture site to hold the bone fragments directly in place while they heal. However, there are small risks of complications (e.g. infection and damage to nerves or blood vessels around the wrist) and K-wire fixation costs more and takes longer to apply than plaster cast.
Methods
Trial design
The DRAFFT2 trial is a randomized, multicentre, superiority trial with two parallel arms performing comparison between surgical fixation with K-wires and plaster casting in patients who have sustained a dorsally displaced fracture of the distal radius. Eligible patients are randomized in a 1:1 ratio to the two treatment groups. Randomization is stratified by centre, intra-articular extension of the fracture and age of the patient ( ≥ 50 or < 50 years of age). The trial is not blinded. It is registered in the International Standard Randomized Controlled Trials database (ISRCTN11980540). Further details of the trial design and procedures, including full eligibility criteria, are found in the DRAFFT2 study protocol.2
Outcomes
Primary outcome
The primary outcome measure is the Patient Reported Wrist Evaluation3 (PRWE) 12 months post-randomization. PRWE4 is a validated, self-reported 15-item questionnaire, that rates wrist function using a range of questions in two (equally weighted) sections concerning the patient’s experience of pain and disability. The score is out of 100 (best score = 0 and worst score = 100).
Secondary outcomes
Secondary outcome measures are: PRWE three and six months post-randomization, PRWE area under the curve (AUC), EuroQol five-dimension five-level (EQ-5D-5L) index at three, six, and 12 months, EQ-5D-5L index area under the curve (AUC), EuroQol visual analogue scale (EQ-VAS) at three, six, and 12 months, EQ-VAS AUC, complications and cost-effectiveness. To calculate EQ-5D-5L index scores we will use the Crosswalk Index Value Calculator mapping the 5 L descriptive system data onto the 3 L dataset using the mapping function5 as, at the time of writing, there is still debate about the appropriate value set for the 5 L. The data collection is summarized in Table I.
Table I.
Summary of outcomes and data collection schedule.
| Time point | Data collection |
|---|---|
| Baseline | PRWE and EQ-5D-5L pre-injury and contemporary, routine radiographs of the wrist |
| 6 weeks | Complication records, routine radiographs of the wrist, operative record |
| 3 months | PRWE, EQ-5D-5L, record of complications/rehabilitation or other interventions and healthcare resource use questionnaire |
| 6 months | PRWE, EQ-5D-5L, record of complications/rehabilitation or other interventions and healthcare resource use questionnaire |
| 12 months | PRWE, EQ-5D-5L, record of complications/rehabilitation or other interventions and healthcare resource use questionnaire |
-
PRWE, Patient Reported Wrist Evaluation; EQ-5D-5L, EuroQol five-dimension five-level.
Sample sizest
In the DRAFFT trial,6 which recruited from the same patient population, the standard deviation (SD) of the PRWE at 12 months was 16. However, other studies of patients with fractures of the distal radius showed a SD for the PRWE which ranged between 16 and 23 points.7 Therefore, we chose a conservative estimate of the SD of 18 points.
A six-point mean difference between groups equates to a standardized effect size of 0.33, assuming a SD of 18 points. We believe the target difference (six points) would be important on both an individual patient and a population level, and could lead to a change in clinical practice in the UK.
The total number of patients required to obtain 90% power to detect a six-point difference between groups for the PRWE will be 380; i.e. 190 patients in each treatment group. With an allowance for a 20% loss to follow-up, we would plan to recruit 476 patients in total.
Statistical analysis
General analysis principles
Final analysis will occur after the final has patient has been followed up for the final time, the data has been cleaning and locked. All outcomes will be assessed at this time.
The significance level used will be two-sided 5% level with corresponding 95% confidence intervals (CIs) calculated whenever possible. Any analyses not pre-specified will be labelled as “exploratory”.
Two analysis populations will be used in the statistical analysis. Intention-to-treat (ITT): inclusion of all available randomized participants who will be analyzed in the groups to which they were randomly allocated irrespective of non-compliance. If a participant has observed data on any of the time points, they will be included in the analysis. Per protocol (PP): eligible participants who received the treatment they were randomized to. Participants did not receive their allocated intervention will not be included in this population. This population will be finalized prior to the conducting the analyses of outcomes.
Details on data checks and reliability can be found in the Supplementary Material (online supplementary appendix 1).
Supplemental MaterialNo formal interim analysis is planned for this study.
Descriptive analysis
The flow of participants through each stage of the trial, including the number of individuals screened, eligible, randomized to each arm, receiving allocated treatment, and included in the primary analysis will be summarized using a CONSORT flowchart (Figure 1). Reasons for ineligibility, loss to follow-up and exclusion from the primary analysis will be summarized.
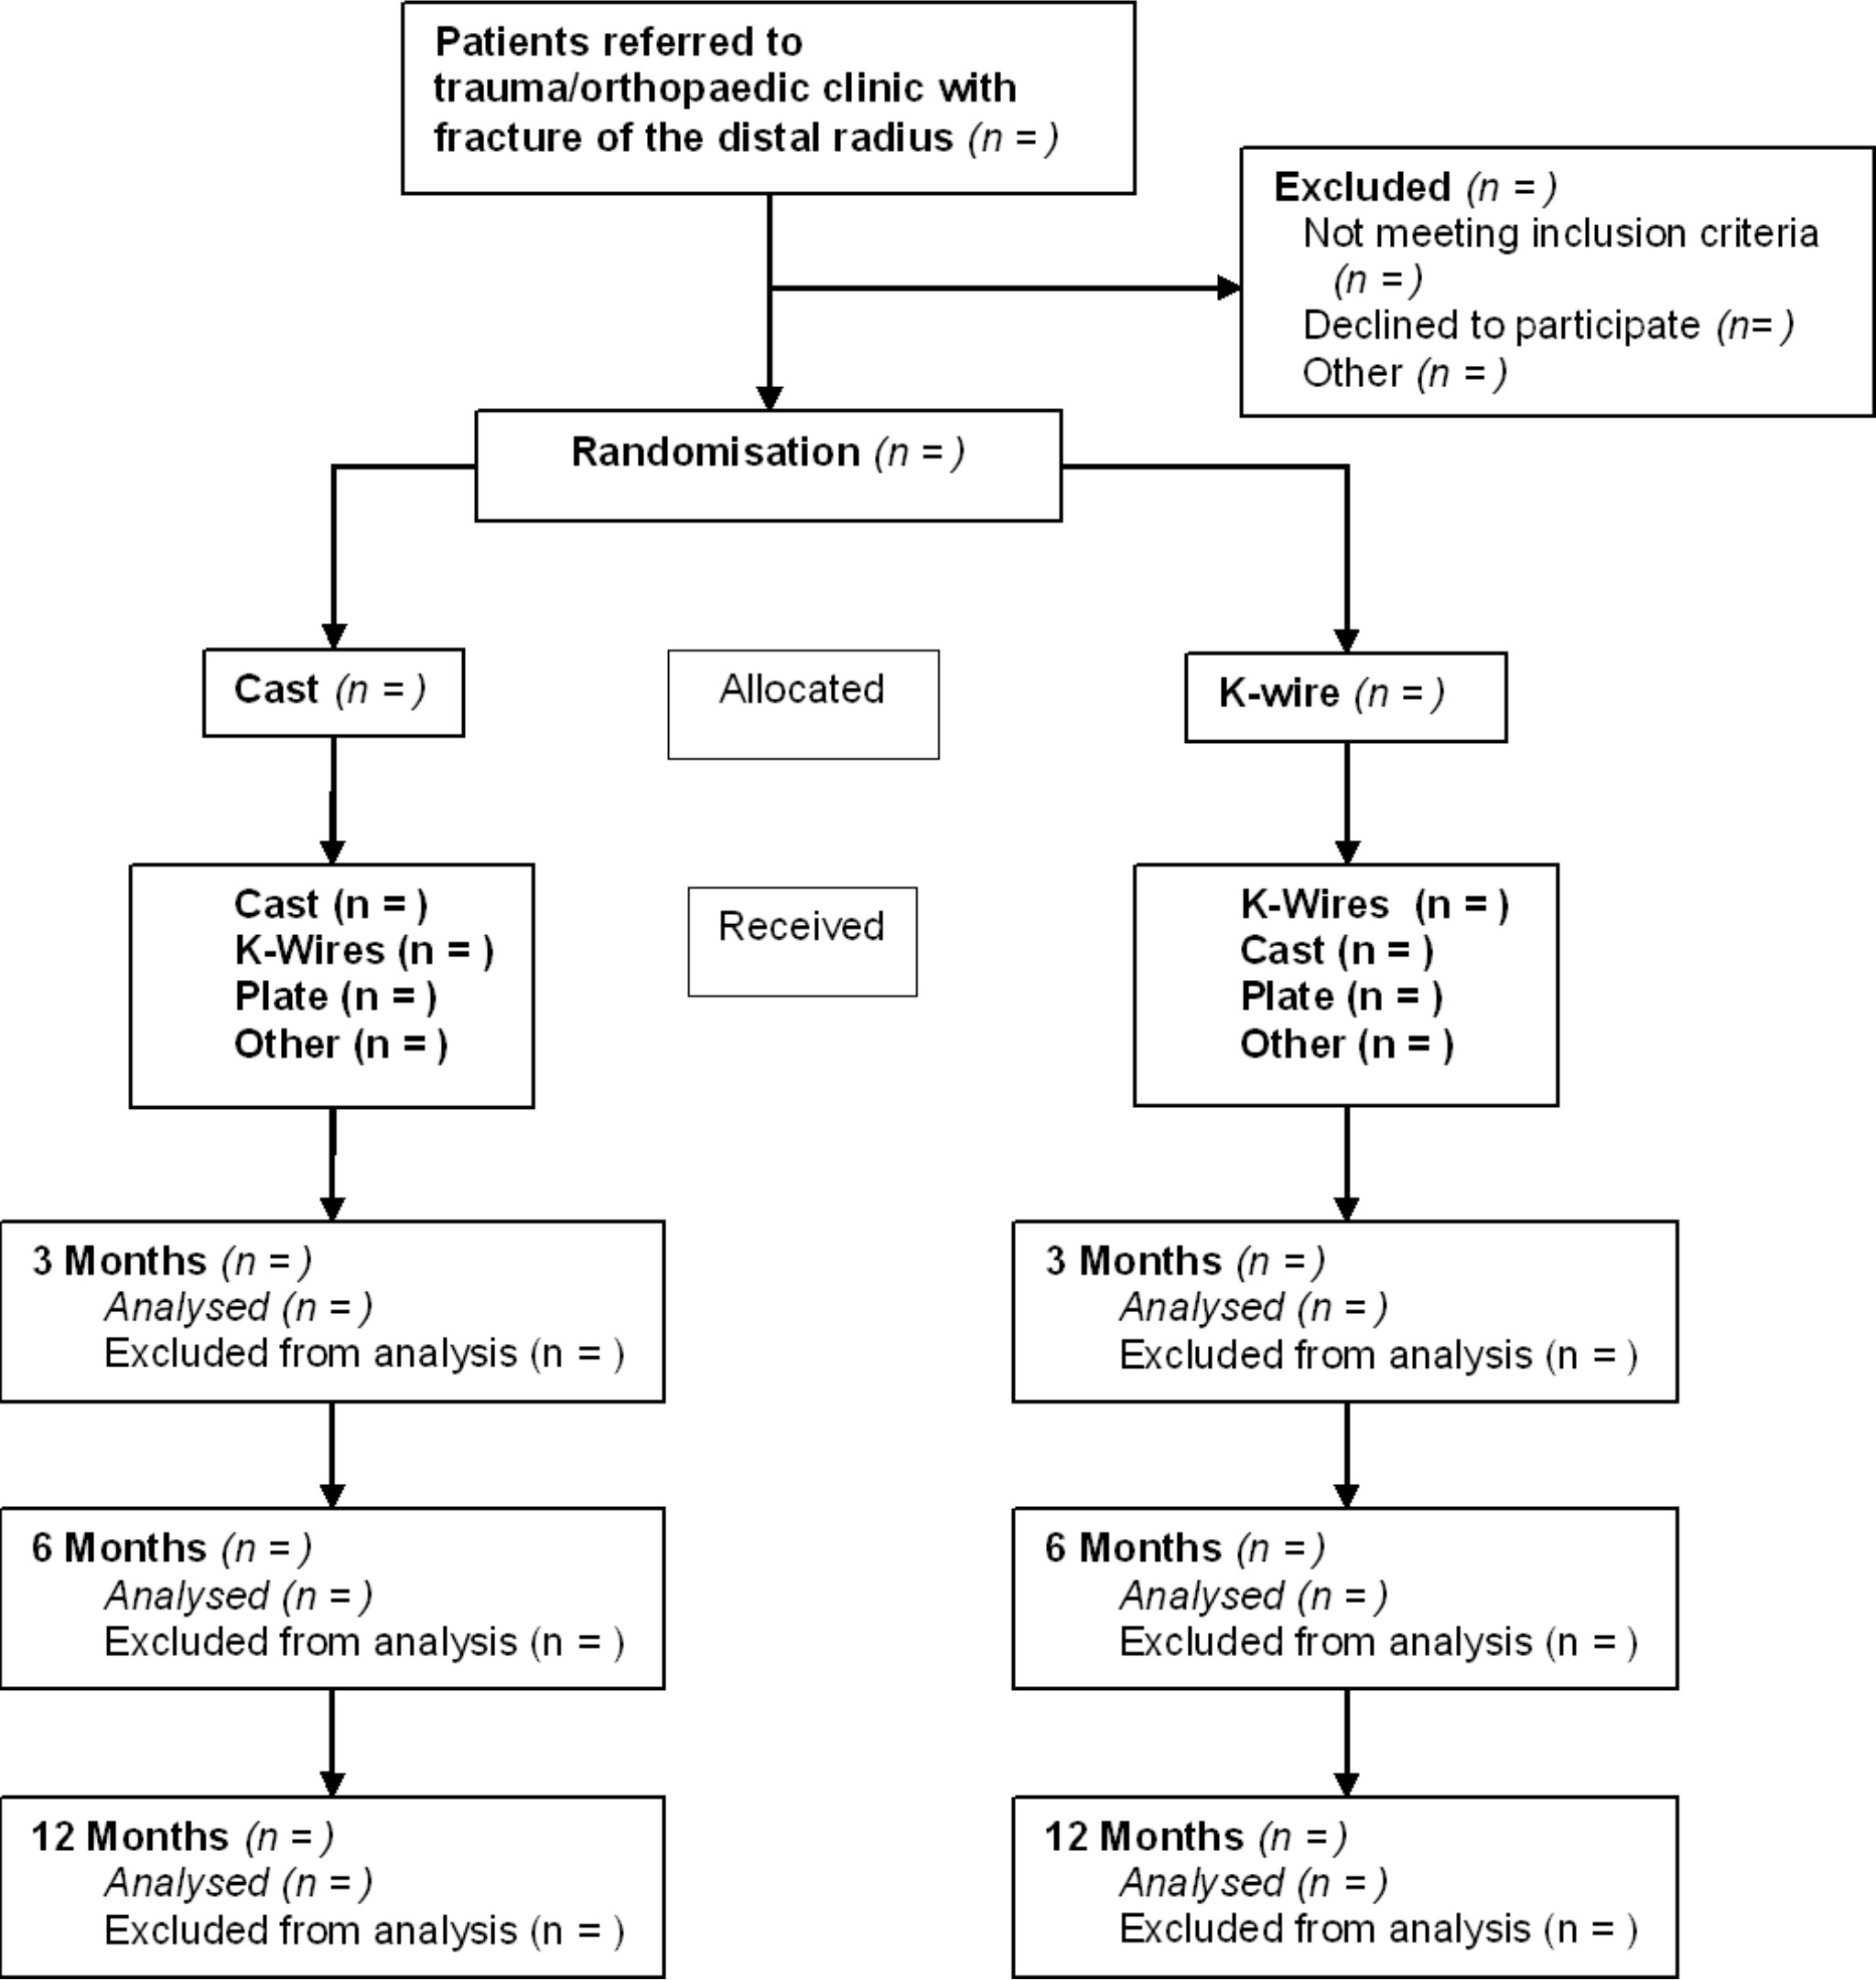
Fig. 1
CONSORT flowchart.
Baseline characteristics are reported by treatment group, including the stratification factors and important prognostic, demographic and clinical covariates.
Numbers (with percentages) for binary and categorical variables and means (and standard deviations), or medians (with lower and upper quartiles) for continuous variables will be presented; there will be no tests of statistical significance nor CIs for differences between randomized groups on baseline variables.
Compliance
The compliance with treatment will be reported by treatment group. Non-compliance is defined as not receiving the treatment the participant was randomized to for any reason, for example, surgeon’s choice or a need to perform an open reduction internal fixation.
Analysis of the primary outcome
The primary outcome measure, PRWE score at 12 months post-randomisation, will be modelled using a mixed effects model. This model will account for centre (random effect), baseline (post-injury) values, other time points, articular extension of the fracture (intra and extra), and age ( ≥ 50 or < 50 years of age) (fixed effects). Treatment by timepoint interactions will also be included to allow time-specific treatment effects to be calculated including the primary outcome time point. This is a different approach from that initially suggested in the DRAFFT2 protocol2 (linear regression with cluster-robust option to control for site), but is in keeping the principle outlined there (allowing for adjustment for clustering by site as well as the other stratification variables as fixed effects).
The main comparison will be performed on an intention-to-treat basis and results presented with adjusted mean difference and the corresponding 95% CI.
Analysis of the secondary outcomes
The same mixed effects model, intention-to-treat basis and results presentation as the primary outcome will also be used to assess the secondary PRWE three and six months outcomes. The same modelling approach will be used for the EQ-5D-5L index and EQ-VAS secondary outcomes at three, six, and 12 months. The distribution of the five domains will be reported in tabular and graphical form by treatment.
The secondary outcome of complications, including those needing further surgery at one-year post-randomisation, will be analyzed as follows. Further surgery, including those in the cast arm who receive any surgery, will be analyzed by calculating the odds ratio and 95% CI using logistic regression. Other generic, non-surgical, complications: complex regional pain syndrome, deep vein thrombosis/pulmonary embolus (pooled together) will be analyzed using the same method. Other individual complications will be summarized by treatment arm, but not analyzed, and reported in tabular form.
An AUC analysis will be performed for the PRWE and EQ-5D (both EQ-5D-5L index and EQ-VAS). The estimates obtained in the mixed model for each time point used in the analysis will be used to calculate the AUC. These adjusted estimates rather than raw, unadjusted, estimates results in less bias estimates of the AUC when missing data is present.8
Missing data
Where possible the reasons for missing data will be ascertained. Withdrawals/loss to follow-up together with reasons will be reported by intervention arm. Any deaths (and their causes) will be reported separately.
The mechanism for missing items required for definition of outcomes will be investigated. Missing data will be reported and summarized by treatment arm. An ITT analysis strategy to assess assumptions about departures from randomization policies and handling of missing data will be carried out to examine the robustness of the primary results. Varying scores of the PRWE (for instance 40th, 50th, 60th percentiles) will be imputed by treatment group for data missing and these “complete” datasets will be reanalysed, using the same model used in the primary analysis. Their adjusted mean differences and 95% CIs plotted.
While there is a mechanism to deal with missing data in the PRWE (a missing item may be with the mean score of the subscale for that individual), there is no limit to how many items can be replaced in a subscale. We will explore the way missing values in the PRWE subscales are treated effect the outcome if there is substantial number of responses with individual items missing as opposed to the all of the respective PWRE subscale.
For the economic analysis, multiple imputation analysis will be used to impute missing cost and health utilities. This will be done using chained regression equations predicting missing values from the observed covariates (observed responses of participant) and creating sets of multiple datasets containing possible values for missing observations.9 Pooled estimates were then calculated using Rubin’s rules10 to obtain an overall mean estimate of the costs or quality-adjusted life years (QALYs).
Sensitivity analyses
Sensitivity analyses of the primary outcome and secondary PRWE outcomes only will be carried out on a per-protocol basis to examine robustness of conclusions to assumptions about departures from randomization.
A second sensitivity analysis will use a three level model with participant within surgeon within centre to examine the potential surgeon (random) effects. This model will formally incorporate terms that allow for possible heterogeneity in responses for patients due to the recruiting centre and the surgeon, and the fixed effects of the treatment groups, and stratification factors.
Pre-specified subgroup analysis
Subgroup analyses of the two clinical stratifying variables (age and intra-articular extension) on the primary outcome are planned. These analyses will use a model to formally test the interaction between each stratifying variable and the treatment factor; appropriate 95% CIs will be reported for the interaction effects in addition to p-values. These analyses will be labelled as exploratory and results from them will be interpreted and reported as such; in line with recommendations for subgroup analysis.11 The results will be presented in a forest plot.
Additional analysis
Bayesian re-analyses of the main analysis of the primary outcome (PRWE) at 12 months are planned. Further details can be found in Supplementary Material (online supplementary appendix 1).
Health economic analysis
A within-trial cost-effectiveness analysis (CEA) will be undertaken using the multiple imputed trial dataset to assess the cost effectiveness of K-wires versus plaster cast from the UK NHS and Personal Social Services perspective in the base case (or primary) analysis.12
Measurement of resource use
Resource use for the surgical fixation will be collected during the trial from information gathered via the trial case report forms (CRFs) by the research team, while resource use due to the wrist fracture during follow-up will be collected via trial questionnaires given to participants at three, ssix, and 12 months after randomization. The questionnaires will capture information such as: the number and duration of admissions to inpatient wards (classified as orthopaedics (wrist/arm), orthopaedics (any bones), rehabilitation unit); number of diagnostic tests; use of outpatient services (classified as orthopaedics, physiotherapy, pathology and radiology); and frequency of use of community-based health and social care services and social care services. Patients will also be asked to record direct medical costs (e.g. medications), direct nonmedical costs (e.g. aids and adaptations, help with housework/childcare and travel) and indirect costs (i.e. lost productivity) attributable to patient’s health state.
Valuation of health outcomes
Unless a validated and accepted UK valuation set for EQ-5D-5L is available at the time of analysis, the current NICE recommended method of computing the utility values will be followed: the 5 L descriptive system data will be mapped onto the 3 L valuation set via the mapping function5 and valued using the UK EQ-5D time trade-off tariff.13 Utilities will be set to zero from the date of death for deceased participants.14 QALYs will be calculated as the area under the baseline regression adjusted utility curve of EQ-5D utility scores from baseline, three, six, and 12 months' data using the trapezoidal rule.15
Valuation of costs
It is not feasible to collect unit cost data for every operative consumable used in the fixation of fractures of the distal radius from all the trauma centres participating in the trial so only the ones that would differ in terms of utilization rate between the treatment arms will be obtained (Table II). The operative costs for both plaster cast and K-wire fixation consumables will be obtained from the latest NHS Supply Chain catalogue.16 Participants in both treatment groups will receive surgery from surgeons of different grades (i.e. consultant, staff grade etc.). Unit costs for each grade of surgeons will be sourced using the latest version of the Personal Social Services Research Unit’s (PSSRU) unit costs of Health and Social Care.17 The average operating time will be obtained from the participant CRF. Other staff that might participate in the surgery include anaesthetists, technicians/operating department personnel, nurses and radiographers, but the number and type of these staff is expected to be the same in both trial arms and for that reason, this information is not being collected. The unit cost of the initial distal radius surgery fracture fixation will be assessed using NHS reference costs and the HRG code (HT45Z) for “Minor Hand Procedures for Trauma” and assigned to both trial groups. Day case costs or overnight admission costs will also be obtained from the latest NHS Reference Cost.18 If a patient reported a length of stay longer than the trim point specified in the NHS Reference Cost, the inpatient excess day cost from the NHS Reference Cost will be used where applicable.
Table II.
Unit costs of health resource items.
| Resource item | Unit | Source |
|---|---|---|
| Fixation surgery | ||
| Full cast | each | NHS Supply Chain Catalogue16 |
| Non-sterile gloves | each | NHS Supply Chain Catalogue16 |
| Surface wipes | each | NHS Supply Chain Catalogue16 |
| Black bag | each | NHS Supply Chain Catalogue16 |
| Yellow bag | each | NHS Supply Chain Catalogue16 |
| Polythene bag for extras | each | NHS Supply Chain Catalogue16 |
| Inco pad | each | NHS Supply Chain Catalogue16 |
| Fixation surgery: K-wire only | ||
| K-wire | each | NHS Supply Chain Catalogue16 |
| Reinforced gown XL | each | NHS Supply Chain Catalogue16 |
| Surgical visor masks | each | NHS Supply Chain Catalogue16 |
| Theatre masks | each | NHS Supply Chain Catalogue16 |
| Biogel gloves | each | NHS Supply Chain Catalogue16 |
| Image intensifier cover | each | NHS Supply Chain Catalogue16 |
| Laceration pack | each | DRAFFT19 |
| Sterilisation of drill | each | DRAFFT19 |
| Sterile dressing gauze | each | NHS Supply Chain Catalogue16 |
| Initial hospital stay | ||
| Intensive care unit | per admission | NHS Reference Costs18 |
| Acute trauma ward | per day | NHS Reference Costs18 |
| Rehabilitation ward | per admission | NHS Reference Costs18 |
| Treatment after index surgery | per day | NHS Reference Costs18 |
| Inpatient care | ||
| Orthopaedics: wrist/arm | per day | NHS Reference Costs18 |
| Orthopaedics: other bones | per day | NHS Reference Costs18 |
| Other non-surgery | per day | NHS Reference Costs18 |
| Day case | per day | NHS Reference Costs18 |
| Rehabilitation Unit | per session | NHS Reference Costs18 |
| Outpatient care | ||
| Orthopaedics/Fracture clinic | per consultation | NHS Reference Costs18 |
| Physiotherapist (NHS) | per session | PSSRU20 |
| Physiotherapist (private) | per hour | The Physiotherapy Centre21 |
| Pathology (blood tests) | per hour | NHS Reference Costs18 |
| Radiology | per test | NHS Reference Costs18 |
| Emergency department: wrist | per attendance | NHS Reference Costs18 |
| Emergency department: others | per attendance | NHS Reference Costs18 |
| Calls to NHS 111 | per call | Financial Times22 |
| Primary and community care | ||
| General Practitioner (surgery visit) | per minute | PSSRU23 |
| General Practitioner (home visit) | per minute | PSSRU24 |
| General Practitioner (phone contact) | per minute | PSSRU20 |
| Practice nurse (surgery visit) | per hour | PSSRU23 |
| Practice nurse (home visit) | per hour | PSSRU24 |
| Practice nurse (phone contact) | per hour | PSSRU24 |
| District nurse (surgery visit) | per hour | PSSRU20 |
| District nurse (home visit) | per hour | PSSRU24 |
| Physiotherapist (surgery visit) | per hour | PSSRU25 |
| Physiotherapist (home visit) | per hour | PSSRU25 |
| Occupational therapist (surgery visit) | per hour | PSSRU23 |
| Occupational therapist (home visit) | per visit | PSSRU24 |
| Medications | BNF26, NHS Electronic Drug Tariff27 | |
| Aids and adaptations | ||
| Wrist support (e.g. brace/splint) | each | NHS Supply Chain Catalogue16 |
| Grab rail | each | PSSRU23 |
| Dressing aids | each | NHS Supply Chain Catalogue16 |
| Long handled aids (e.g. shoe horn) | each | NHS Supply Chain Catalogue16 |
| Bathing aids | each | NHS Supply Chain Catalogue16 |
| Kitchen aids (e.g. jar openers) | each | NHS Supply Chain Catalogue16 |
| Personal social services | ||
| Frozen meals-on-wheels | per meal | Meals on Wheels (LBM)28 |
| Hot meals-on-wheels | per meal | PSSRU25 |
| Laundry services | per load | North Yorkshire County Council29 |
| Social worker | per hour | PSSRU23 |
| Care worker/ help at home | per hour | PSSRU23 |
| Lost productivity | ||
| Median wage | per week | Office for National Statistics30 |
-
BNF: British National Formulary, PSSRU: Personal Social Service Research Unit
Unit cost of direct medical costs that are not part of the trial such as the inpatient care, outpatient care and community care will be sourced from the latest available NHS Reference Cost and PSSRU unit cost. The unit cost of medication related to surgical fixation will be sourced using the latest available British National Formulary26 or the NHS Electronic Drug Tariff.27
Collection of unit cost for direct nonmedical cost items such as help with housework/childcare and travel incurred by participant’s carer will be not be relevant because the cost per patient will be obtained from the questionnaire. Unit cost of aids and adaptations will be obtained from the latest NHS Supply Chain Catalogue;16 the median wage that will be used in the computation of participant’s lost productivity will be obtained from the Office for National Statistics.30
Cost of health resource use per participant will be calculated by multiplying the frequency of health resource utilization reported by the proxy with the unit cost of each resource item and adding on direct nonmedical cost, which will be obtained directly from the questionnaire. The base currency of all costs will be the year in which the data analysis was performed and in UK pounds. The medication cost taken over the study period will be calculated using the cost per dose for each product and the mean quantity taken per day during the reported number of days. All medications are assumed to be in tablets unless stated otherwise. Cost of lost productivity will be calculated using the human capital approach: the daily median wage will be multiplied by the number of days the participant had to take time off work due to participant’s injury.
Data analysis
Resource use items will be summarized by randomized group and follow-up period and differences between groups will be analyzed using t-tests for continuous variables and Pearson chi-squared (χ2) test for categorical variables. Means and standard deviations for values of each cost category will be estimated by treatment allocation and follow-up period. Differences in mean costs will assessed using t-tests and the bootstrap 95% CI will be calculated based on 1,000 replications. There will be no discounting for costs and QALYs because the time horizon is one year.
The base case analysis will adopt an intention-to-treat (“as-randomized” with imputation of missing data) perspective and an incremental cost-effectiveness ratio (ICER) will be calculated as the difference in mean costs divided by the difference in mean QALYs between the treatments. The National Institute for Health and Care Excellence31 cost effectiveness threshold of £20,000 to £30,000 per additional QALY will be used to determine the cost effectiveness of K-wire versus plaster cast after facture of the distal radius. The more effective treatment will be considered cost-effective if it has an ICER below the £20,000 per QALY threshold.
The net monetary benefit of K-wire versus plaster cast will be calculated across different cost-effectiveness thresholds. The economic evaluation will be repeated for subgroups defined by the two clinical stratifying variables (age and intra-articular extension). One-way sensitivity analyses will be performed to explore the effects of extending the study perspective (i.e. societal perspective) and assessing the impact of missing data on the ICERs (i.e. using complete case analysis). Non-parametric bootstrapping will also be performed to assess the uncertainty on the ICERs and varying levels of willingness-to-pay for an additional QALY and presented in cost-effectiveness acceptability curves.
Findings of this economic evaluation will be reported in accordance with the Consolidated Health Economic Evaluation Reporting Standards (CHEERS) statement for the reporting of health economic evaluations.32
Statistical packages
All analysis will be carried out using STATA33 or R34 statistical software. The package and version number used for analysis will be recorded and reported.
Discussion
This paper provides details of the planned statistical and health economic analyses for the DRAFFT2 trial35 to reduce the risks of reporting bias. Any changes or deviations from the analysis outlined in this paper will be described and justified fully in the final report.
References
1. MacIntyre NJ , Dewan N . Epidemiology of distal radius fractures and factors predicting risk and prognosis . J Hand Ther . 2016 ; 29 ( 2 ): 136 – 145 . Crossref PubMed Google Scholar
2. Achten J , Sones W , Dias J , et al. Surgical fixation with K-wires versus plaster casting in the treatment of dorsally displaced distal radius fractures: protocol for distal radius acute fracture fixation trial 2 (DRAFFT 2) . BMJ Open . 2019 ; 9 ( 3 ): e028474 . Crossref PubMed Google Scholar
3. MacDermid JC , Turgeon T , Richards RS , Beadle M , Roth JH . Patient rating of wrist pain and disability: a reliable and valid measurement tool . J Orthop Trauma . 1998 ; 12 ( 8 ): 577 – 586 . Crossref PubMed Google Scholar
4. MacDermid JC , Richards RS , Donner A , Bellamy N , Roth JH . Responsiveness of the short form-36, disability of the arm, shoulder, and hand questionnaire, patient-rated wrist evaluation, and physical impairment measurements in evaluating recovery after a distal radius fracture . J Hand Surg Am . 2000 ; 25 ( 2 ): 330 – 340 . Crossref PubMed Google Scholar
5. van Hout B , Janssen MF , Feng Y-S , et al. Interim scoring for the EQ-5D-5L: mapping the EQ-5D-5L to EQ-5D-3L value sets . Value Health . 2012 ; 15 ( 5 ): 708 – 715 . Crossref PubMed Google Scholar
6. Costa ML , Achten J , Parsons NR , et al. Percutaneous fixation with Kirschner wires versus volar locking plate fixation in adults with dorsally displaced fracture of distal radius: randomised controlled trial . BMJ . 2014 ; 349 : g4807 . Crossref PubMed Google Scholar
7. MacDermid JC , Roth JH , Richards RS . Pain and disability reported in the year following a distal radius fracture: a cohort study . BMC Musculoskelet Disord . 2003 ; 4 ( 1 ): 1 – 13 . Crossref PubMed Google Scholar
8. Bell ML , King MT , Fairclough DL . Bias in area under the curve for longitudinal clinical trials with missing patient reported outcome data: summary measures versus summary statistics . SAGE Open . 2014 ; 4 ( 2 ): 2158244014534858 . Google Scholar
9. Rubin D . Multiple imputation for nonresponse in surveys . New York : John Wiley & Sons, Ltd , 1987 . Google Scholar
10. Faria R , Gomes M , Epstein D , White IR . A guide to handling missing data in cost-effectiveness analysis conducted within randomised controlled trials . Pharmacoeconomics . 2014 ; 32 ( 12 ): 1157 – 1170 . Crossref PubMed Google Scholar
11. Brookes ST , Whitley E , Peters TJ , et al. Subgroup analyses in randomised controlled trials: quantifying the risks of false-positives and false-negatives . Health Technol Assess . 2001 ; 5 ( 33 ): 1 – 56 . Crossref PubMed Google Scholar
12. National Institute for Health and Care Excellence . Guide to the methods of technology appraisal 2013 . https://www.nice.org.uk/process/pmg9/resources/guide-to-the-methods-of-technology-appraisal-2013-pdf-2007975843781 (date last accessed 3 October 2019 ). Google Scholar
13. Dolan P . Modeling Valuations for EuroQol health states . Med Care . 1997 ; 35 ( 11 ): 1095 – 1108 . Crossref PubMed Google Scholar
14. Parsons N , Griffin XL , Achten J , et al. Modelling and estimation of health-related quality of life after hip fracture: a Re-analysis of data from a prospective cohort study . Bone Joint Res . 2018 ; 7 ( 1 ): 1 – 5 . Crossref PubMed Google Scholar
15. Drummond MF , Sculpher MJ , Torrance GW . Methods for the economic evaluation of health care programmes . Oxford University Press . 2005 . Google Scholar
16. NHS Business Services Authority . Nhs supply chain Catalogue 2018/19 . London , 2018 . Google Scholar
17. Curtis L , Burns A . Unit costs of health and social care 2018 . Canterbury , 2018 . Google Scholar
18. National Health Service . Reference costs . https://improvement.nhs.uk/resources/reference-costs/ (date last accessed 1 July 2018 ). Google Scholar
19. Tubeuf S , Yu G , Achten J , et al. Cost effectiveness of treatment with percutaneous Kirschner wires versus volar locking plate for adult patients with a dorsally displaced fracture of the distal radius: analysis from the DRAFFT trial . Bone Joint J . 2015 ; 97-B ( 8 ): 1082 – 1089 . Crossref PubMed Google Scholar
20. Curtis L , Burns A . Unit costs of health and social care 2015 . Canterbury , 2015 . Google Scholar
21. The Physiotherapy Centre . Prices . https://www.thephysiocentre.co.uk/how-much/ (date last accessed 24 March 2020 ). Crossref PubMed Google Scholar
22. Murgia M . Nhs to trial artificial intelligence APP in place of 111 helpline . Financ Times . 2017 . Google Scholar
23. Curtis L , Burns A . Unit costs of health and social care 2019 . Canterbury , 2019 . Google Scholar
24. Curtis L . Unit costs of health and social care 2010 . Canterbury , 2010 . Google Scholar
25. Curtis L . Unit costs of health and social care 2014 . Canterbury , 2014 . Google Scholar
26. Joint Formulary Committee . British National Formulary (online). London BMJ Gr. Pharm. Press . http://www.medicinescomplete.com (date last accessed 1 July 2019 ). Google Scholar
27. National Health Service . Nhs electronic drug tariff . http://www.drugtariff.nhsbsa.nhs.uk/#/00770298-DC/DC00770293/Home (date last accessed 9 January 2020 ). Google Scholar
28. Merton Voluntary Service Council . Group Details - Meals On Wheels (LBM) . https://www.mvsc.co.uk/civicrm/profile/view?reset=1&id=94191&gid=1/ (date last accessed 24 March 2020 ). Google Scholar
29. North Yorkshire County Council . Paying for care at home . https://www.northyorks.gov.uk/paying-care-home (date last accessed 24 March 2020 ). Google Scholar
30. Office for National Statistics . Labour market overview, UK Statistical bulletins . https://www.ons.gov.uk/employmentandlabourmarket/peopleinwork/employmentandemployeetypes/bulletins/uklabourmarket/previousReleases (date last accessed 19 November 2019 ). Google Scholar
31. National Institute for Health and Care Excellence . Judging whether public health interventions offer value for money . https://www.nice.org.uk/advice/lgb10/chapter/judging-the-cost-effectiveness-of-public-health-activities (date last accessed 1 July 2018 ). Google Scholar
32. Husereau D , Drummond M , Petrou S , et al. Consolidated Health Economic Evaluation Reporting Standards (CHEERS)--explanation and elaboration: a report of the ISPOR Health Economic Evaluation Publication Guidelines Good Reporting Practices Task Force . Value Health . 2013 ; 16 ( 2 ): 231 – 250 . Crossref PubMed Google Scholar
33. StataCorp . Stata statistical software: release 15 . College Station, TX : StatCorp LLC , 2017 . Google Scholar
34. R core team . R: a language and environment for statistical computing . Vienna, Austria : R foundation for statistical computing , 2019 . Google Scholar
35. Finfer S , Bellomo R . Why publish statistical analysis plans? Crit Care Resusc . 2009 ; 11 ( 1 ): 5 – 6 . PubMed Google Scholar
Author contributions
A. G. Ooms: Developed the statistical analysis plan, Wrote the manuscript, Reviewed and approved the final manuscript.
M. E. Png: Developed the health economic analysis plan, Wrote the manuscript, Reviewed and approved the final manuscript.
J. Cook: Developed the statistical analysis plan, Wrote the manuscript, Obtained grant funding, Reviewed and approved the final manuscript.
M. Dritsaki: Obtained grant funding, Reviewed and approved the final manuscript.
H. Dakin: Obtained grant funding, Reviewed and approved the final manuscript.
M. Costa: Obtained grant funding, Reviewed and approved the final manuscript.
Funding statement
This project was funded by the UK NIHR HTA Programme (project number 15/27/01) and was supported by NIHR Oxford Biomedical Research Centre. Although none of the authors has received or will receive benefits for personal or professional use from a commercial party related directly or indirectly to the subject of this article, benefits have been or will be received but will be directed solely to a research fund, foundation, educational institution, or other non- profit organization with which one or more of the authors are associated.
Acknowledgements
The trial is supported by the NIHR Oxford Biomedical Research Centre. We would like to thank the Trial Steering Committee: Michael Whitehouse (chair), Grey Giddins, and Penelope Harris and Data and Safety Monitoring Committee: Lee Shepstone (Chair), Jean Craig, and Simon Donnell for overseeing the study.
Ethical review statement
The National Research Ethic Committee approved this study on 6 October 2016 (16/SC/0462).
Supplementary material
Details on data checks, reliability and additional analysis
© 2020 Author(s) et al. This is an open-access article distributed under the terms of the Creative Commons Attributions licence (CC-BY-NC-ND), which permits unrestricted use, distribution, and reproduction in any medium, but not for commercial gain, provided the original author and source are credited.
