


Abstract
This is the second of a series of reviews of registries. This review looks specifically at worldwide registry data that have been collected on knee arthroplasty, what we have learned from their reports, and what the limitations are as to what we currently know.
Introduction
Orthopaedic registries were introduced as a way of collecting information on joint replacements at a population (often national) level. They allow for a combination of monitoring both clinician and implant performance. Initially they only included failure rates, but more recently data collected on patient-reported outcome measures (PROMs) have provided a further insight into the success rates and outcomes following knee arthroplasty.
There are now 31 members of the International Society of Arthroplasty Registers (ISAR) that collect data on patients undergoing knee arthroplasty.1
The majority of these are national registries (such as the Swedish Registry that first started collecting data in 1975), although in the United States there are a number of regional or privately funded registries also collecting data (ten in total). There is very little standardisation between registries; not all require compulsory entry, not all collect outcome data other than failure rates (such as PROMs), and not all produce public reports. Before any data from registries are analysed, it is important to understand the registry design and methodology behind the process of data collection for each one (for instance the compliance rate, data entry time and entry clerk varies significantly between individual registries). Many registries collect data at a population level and despite the inclusive nature and huge volume of data collected, they are still subject to possible bias as previously described in our first registry review.3Table I and table II describe what features make a good registry, and what their main purposes are.
| Good registries |
|---|
| Ownership - with clinician involvement |
| Data quality and reliability |
| Availability and delivery - with regular, publicly published reports |
| Integration |
| Collaboration |
Table II. What is the purpose of registries?
| There is no doubt that registries are developed with the best possible intentions. Registries can be privately funded (by hospitals, individuals or societies), publicly funded (by government), or more often by a combination of industry (implant companies), private institutions and government. It is interesting to consider what each of these groups seeks to prove through registry data. Implant companies would like to provide independent evidence to prove that their implant is safe, or possibly infer better survival than with its competitors. Surgeons seek information to make an evidence-based decision on the implant they use, or to prove that the implant that they use is safe. It is likely that the national governments have different intentions, seeking to demonstrate that they are regulating the health services in their country to ensure that quality remains high and that services are evenly distributed. This has been demonstrated by the recent public publishing of surgeon-level mortality data after joint replacement in the UK. |
Each registry collects their data and analyses it in a particular way. This article aims to provide the reader with unbiased information from registry data that is freely available on knee arthroplasty replacement in published annual reports or articles in peer-reviewed journals. We have referred predominantly to reports from the larger, more established registries with high compliance rates. Table III demonstrates the differences between the registries providing source information referred to in this article. Information on all registries that collect data on knee arthroplasty that are not included in Table III are presented in Supplementary table a (available online).
Table III. Worldwide registries collecting data on knee arthroplasty.Summary of other registries registered with ISAR can be seen online with this article in Supplementary table a.
| England, Wales and Northern Ireland (NJR)10 | Australia 6 | Sweden 5 | Canada 11 | Holland Arthroplasty Register26 | New Zealand9 | Denmark 8 | Norway 7 | American Joint Registry (AAOS) 27 | Finnish Arthroplasty Register (no reference or website) | |
|---|---|---|---|---|---|---|---|---|---|---|
| National/Regional | National | National | National | National | National | National | National | National | National | National |
| Year started | 2003 | 1999 | 1975 | 2003 | 2007 | 1999 | 1997 | 1994 | 2010 | 1980 |
| Total no. knee implants registered | 589,028 | 429,228 | 188,093 | 147,328 | 140,420 | 64,799 | 60,049 | 41,567 | 14,016 | N/A |
| Percentage compliance | 91% | Not Available (N/A) | 97% | 43% | 92% | N/A | > 90% | N/A | < 50% | N/A |
| Most recent published review | 2013 | 2012 | 2011 | 2011 | 2012 | 2012 | 2010 | 2009 | 2013 | N/A |
| PROMS data | EQ5D, OKS, satisfaction Pre-op, 6 months post-op | No | Pilot study. EQ5D, KOOS, SatisfactionPre-op, 1 year post-op | No | Starting 2014 | Selected Oxford-12 (20% response)6-months, 5-years,10-years | Satisfaction, American Knee Society ScorePre-op6-18 months post-op | No | No | N/A |
| Follow-up to date | 9 years | 12 years | 38 years | 10 years | 5 years | 13 years | 16 years | 19 years | 3 years | N/A |
What are the differences between knee arthroplasty practices worldwide and how have these changed over time?
As one would expect, the most common primary knee arthroplasty procedure performed worldwide is total knee replacement (TKR), making up 89% to 96% of the primary knee arthroplasties implanted. Unicompartmental knee replacements (UKR) make up between 5% and 10%, and patellofemoral joint (PFJ) replacements make up between only 0.4% and 1.5% of primary surgeries.
Kurtz et al4 projected that the incidence of primary knee arthroplasty in the United States would increase by 673% between 2007 and 2030. The numbers of cases that registries collect are strongly biased by their compliance entry rates, however, the Scandinavian registries (which have high compliance rates) have demonstrated an increase of 21% between 2006 and 2010 in Sweden alone (Fig. 1),5 an increase of over 400% in Norway between 1995 and 2010, and an increase of 76% between 2003 and 2012 in Australia.6,7 Over the last year, the numbers of recorded procedures in the UK, Swedish and New Zealand registries have been relatively static, while there are still increasing numbers of knee arthroplasty being performed in Australia, Norway and Denmark (4%, 13% and 13%, respectively), perhaps reflecting the slowdown in the global economy and restrictions in healthcare provision.5-10
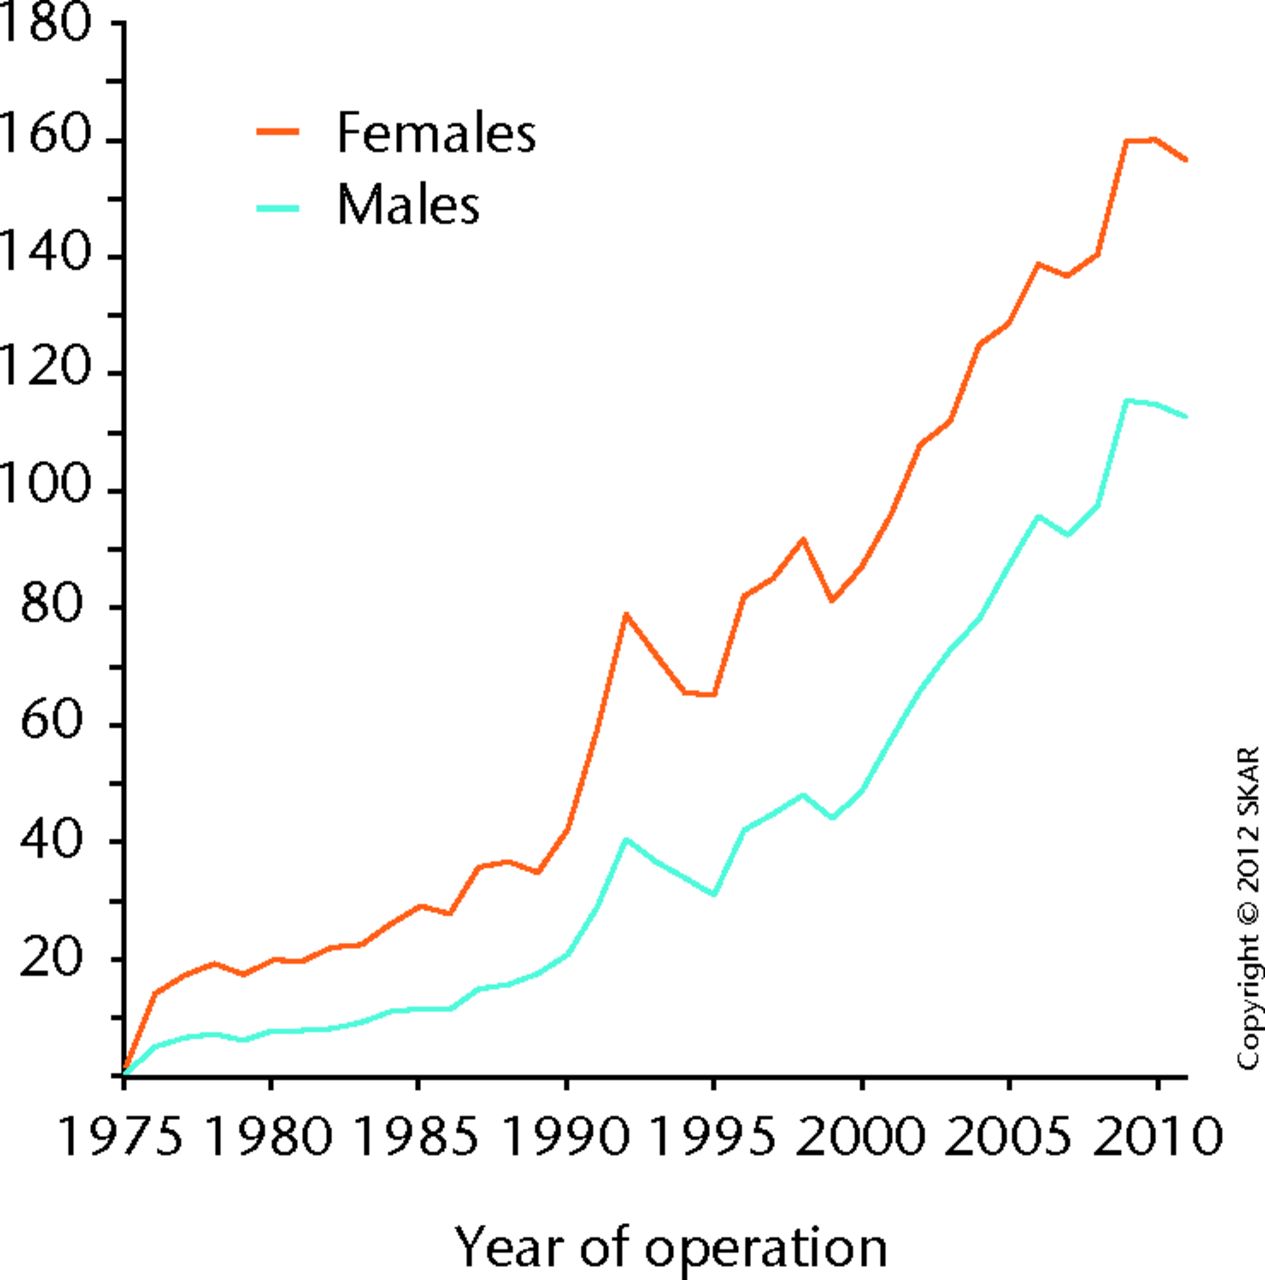
Fig. 1
Incidence of primary knee arthroplasty per 100 000 inhabitants in Sweden5 (Permission granted from Swedish Knee Arthroplasty Register; Annual Report 2012).
A striking change in practice is the reduction in the number of patients undergoing UKR in Australia. Since 2003 there has been a 49% decline in UKR procedures compared with the latest report in 2012 (from 14.5% of all primary procedures to 4.4%).6 A drop in the number of UKR procedures performed in Sweden has also been noted, but the rate of UKA has increased in New Zealand (18% increase),9 Denmark (13% increase),8 and Norway (5% increase).7 A 57% increase was seen in the rate of PFJ arthroplasty in Sweden, although numbers are still very low (only 52 were performed), and make up only 0.5% of the total number of primary procedures.5
There has also been a marked increase of 17% in knee revision surgery in 2013 compared with the previous year in the UK, which was echoed by the Danish registry (22% increase). Only a 2% increase was seen in Australia, however, since 2003 the incidence of knee revision surgery has increased by approximately 60%.6,8,10 Clearly, how a revision procedure is classified is important. Should patellar resurfacing be classified as revision surgery? Should a polyethylene insert exchange for infection be classified as revision surgery? Aseptic loosening is the main cause of revision (32% in UK; 30% in Australia; 31% in Denmark), with infections making up approximately 22% of revisions in the UK, Australia and Denmark.6,8,10
Patellar resurfacing continues to be an area of much debate with large national variations. The resurfacing rate is 38% in the UK (the largest national registry), 54% in Australia and 66% in Denmark, while only 2% in Sweden and 3% in Norway. Despite this variation, revision rates are broadly similar between these registries.5-8 Such national variations in the rates of patellar resurfacing are likely to reflect traditional practices, compounded by the lack of strong evidence on the subject.
Cemented knee replacements are the most commonly used prostheses in the UK, Sweden, Canada and New Zealand (all over 90%), while hybrid and uncemented TKR prostheses remain popular in Australia (where 20% are uncemented and 22% are hybrid fixations).6,10,11 A similar pattern is seen in navigation rates remaining low in the UK, Sweden and Denmark (3%, < 1% and < 1%, respectively), but more popular in Australia (22%) and Norway (19%).5-8,10 These two technologies are both relatively newer and may reflect the ‘early adopter’ tendency in different healthcare systems. Many individuals who tried navigation have moved away from the technology, likely due to the extra cost, increased surgical time and lack of long-term evidence that navigation leads to improved outcomes.
Cruciate-retaining (CR), fixed bearing implants are the most commonly used in the UK (70% of total), with posterior-stabilised (PS) fixed bearing the next most popular (23%), followed by CR mobile bearing (5%), and PS mobile bearing (1%).10 Interestingly, only 1% of procedures performed in the UK were simultaneous bilateral procedures.
One of the effects of registry data on surgical practice is that the feedback loop may occur. Close analysis and widespread adoption of practice supported by registry data can lead to convergence, with increasing conservatism and lack of innovation. To encourage innovation while still under close independent supervision and scrutiny, a system called ‘Beyond Compliance’ (Table IV) has been introduced in the UK that enables surgeons and manufacturers to innovate in a safer environment for patients.12
Table IV. Beyond Compliance.
| Beyond Compliance was developed in the UK to support the safe and stepwise introduction of new or modified orthopaedic implants.12 It is a voluntary service that encourages surgeons and implant manufacturers to work together to ensure new implants are introduced to the market safely. Registries support conservative surgical practice by publishing long-term outcomes on established implants. New products that may confer advantages to patients are unable to provide long-term outcome data and therefore patients, surgeons and industry may suffer as a result. Beyond Compliance therefore encourages innovation, but does so in a regulated environment to ensure patient safety. Beyond Compliance seeks to go beyond complying with the bare minimum standards that are required for the introduction of new implants, through: 1) Setting up and designing post-market surveillance programmes. 2) Ensuring that centres have appropriate clinical experience and infrastructure. 3) Collecting independent follow-up and outcome data and providing independent scrutiny and analysis. 4) Providing regular feedback to participating clinicians and manufacturers |
Revision rates
Most registries calculate the risk of revision surgery by using the Cumulative Percentage Probability (CPP) of a first revision since the primary operation. Alternatively, this is referred to as the Cumulative Revision Rate (CRR). This survival analysis takes into account patients who have died (censored) and are then excluded from further analysis. Most commonly this is calculated using a Kaplan–Meier method although it may also be calculated using proportional hazards modelling (commonly using a Cox method). Data can be presented as the probability of survivorship (Kaplan–Meier – starting point 100%), or probability of revision (where the starting point is 0%). Confidence intervals should not be used to infer significant differences in revision between groups. Instead, hazard or relative risk ratios should be used to judge clinical and statistical significance.7 Instead of using CPP, the New Zealand Registry calculates revision rates by the number of revisions per 100 component-years. One of the perennial difficulties that occurs with survival analysis is that registries analyse their data in different ways. While this can produce different and unique insights into each aspect of arthroplasty surgery, it makes comparison between registries difficult. The UK and Australian registries concentrate on comparing ‘types’ of implants, such as the type of constraint or fixation method, while the Scandinavian registries prefer comparing specific brands and regional performances. Clearly, detailed and reliable analysis of survivorship depends upon the age of the individual registry, fidelity and completeness of data and the total number of joints entered. Table II demonstrates the information collected in the registries referred to in this article.
Total knee replacement
The Australian Registry has published a 6.5% (95% Confidence Interval (CI) 6.2 to 6.7) revision rate for all total knee replacements at 12 years.6 The New Zealand Registry has published a 5.51% revision rate at 13 years (no CI).9
The UK registry found the lowest revision rates (at nine years) in unconstrained knees (CR), fixed bearing TKRs (CRR 2.90; 95% CI 2.77 to 3.04).10 Revision rates were marginally higher in PS fixed bearing TKRs (CRR 3.32; 95% CI 3.08 to 3.52), and higher still in the PS mobile bearing TKRs (CRR 5.01; 95% CI 3.55 to 7.06). All polyethylene tibias had a similar revision rate to modular designs with a revision rate of 2.64 (95% CI 1.96 to 3.55). Similar results were found in the Australian Registry, with the lowest revision rates being in the unconstrained fixed bearing group (6.1 at 12 years; 6.2 to 6.7) when compared with the posterior-stabilised group (7.6 at 12 years; 6.9 to 8.4). These data are presented in Table V. Only the UK and Australian registries published detailed analysis of the survivorship of not only specific implants, but also the types of knee replacements.6,10
Table V. Comparison of available data on survivorship after knee arthroplasty. Cumulative Probability Percentage of Revision unless stated (*=Rate/100 component years). This is all of the available published data from all registries. Many registries only publish comparison rates between implants rather than publishing absolute revision rates.
| Registry | Australia6 | UK 10 | New Zealand9 | ||
| Duration of follow-up | 10 years | 9 years | 13 years | ||
| All TKR | 5.5 (5.4-5.7) | N/A | 5.51 | ||
|
5.2 (5.0-5.3) | N/A | |||
|
6.5 (6.2-6.7) | N/A | |||
| Cruciate-Retaining | 5.3 (5.1-5.4) | N/A | 0.40 (0.37-0.44)* | ||
| Fixed Bearing | 2.9 (2.8-3.0) | ||||
| Mobile Bearing | 3.8 (3.2-4.4) | ||||
| Posterior-Stabilised | 6.4 (6.1-6.8) | N/A | 0.70 (0.64-0.76)* | ||
| Fixed Bearing | 3.3 (3.1-3.6) | ||||
| Mobile Bearing | 5.0 (3.6-7.1) | ||||
| Patella resurfaced | 6.0 (5.9-6.2) | N/A | |||
| Patella not resurfaced | 4.9 (4.7-5.1) | N/A | |||
| All poly tibia | 5.4 (4.2-7.0) | 2.6 (2.0-3.6) | |||
| Cemented | 5.3 (5.2-5.5) | 3.1 (3.0-3.2) | |||
| Uncemented | 6.2 (6.0-6.5) | 4.0 (3.6-4.5) | |||
| Hybrid | 5.1 (4.8-5.3) | 3.4 (2.7-4.4) | |||
| UKA | 15.2 (14.7-15.7) | 11.6 (10.9-12.3) | 1.29 (1.18-1.41)* | ||
| PFJ | 15.5 (13.8-17.5) | 16.1 (14.1-18.4) | 2.02 (1.20-3.19)* |
Implant-specific data are referred to in each of the annual reports. It is important that all data are used and applied with caution, taking the context into account. For instance, consistently throughout the registries, CR TKRs have been shown to have lower revision rates than PS mobile bearing TKRs. Why is this so? Registries do not give any explanations, they merely state the facts. If fewer of a certain type of implant are used, the confidence intervals will be wider. If an implant only has a small number of cases implanted and a revision occurs, the revision rate will appear high until more cases have been performed. This is the same with individual surgeon data; if a surgeon who only performs 20 TKRs per year has one failure, straight away he or she then has a revision rate of 5%, and needs to perform a further 80 joint replacements (taking four more years) to bring their revision rate to 1%. Registries also do not necessarily take into account case complexity (which may impact failure rate), and nor do they account for all variables such as age (which has been shown to have a significant impact on revision rates). Thus, there are two possible explanations for the observed higher revision rate in cruciate-substituting knees. Either the design is inferior and has higher revision rates, or the cases in which these implants are used are more complex (such as significant valgus knees) which have an innately higher revision rate. Both are equally plausible and registries currently do not provide the answers to these questions.
The registries uniformly demonstrate that rates of revision are higher for uncemented TKRs when compared with fully cemented TKRs (Table V). The Swedish and Danish registries calculated that the risk of revision is higher for uncemented TKRs compared with cemented prostheses (Swedish: Relative Risk 1.6 (1.3 to 1.9), Danish: Hazard Ratio 1.46 (1.29 to 1.66)).5,8Figure 2 from the UK registry demonstrates the difference between cemented and uncemented TKR revision rates.
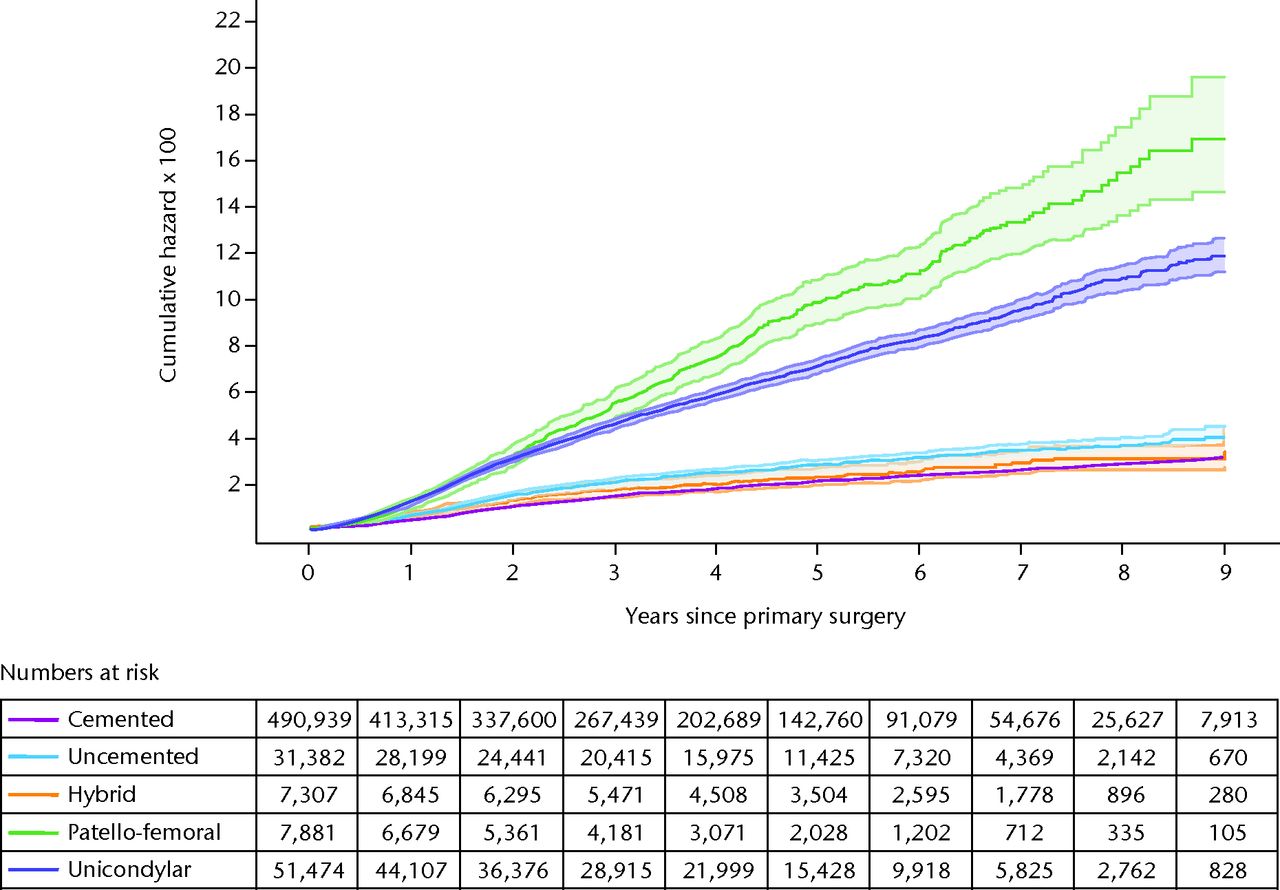
Fig. 2
Hazard ratio for a first revision for different types of primary knee replacement at increasing years after the primary surgery. Reprinted with permission from the England, Wales and Northern Ireland Joint Registry (2013 Annual Report; www.njrcentre.org.uk).10
The Australian Registry has performed a detailed analysis looking at how CPP changed with age at time of primary surgery.6 Younger patients have higher revision rates, confirming previously published data.5,13 The CPP at 12 years, if the age was less than 55 years, was 13.6 (12.6 to 14.7), compared with 6.0 (5.6 to 6.3) between 65 and 74 years, and 3.1 (2.9 to 3.3) when over 75 years. The Hazard Ratio (calculated by the Danish) for patients over 75 years was 0.39 (0.34 to 0.44) compared with patients less than 66 years, confirmed also by the Australian registry.6,8
The Danish Registry also found an increased risk of revision in males (HR 1.13 (1.03 to 1.23), a finding confirmed by the New Zealand and Australian registries.6,8,9
The New Zealand Registry analysed the effect of laminar flow on revision rate, and found that revision rates within six months of primary surgery were higher if laminar flow was used (0.25%), compared with when laminar flow was not used (0.11%), which appears counterintuitive and may be an association rather than a causation.14
Mortality data obtained from the UK joint registry revealed that the 90-day mortality (CPP) for men after arthroplasty was only 0.07% (0.04 to 0.13) if younger than 55 years, 0.34% (0.29 to 0.39) if between 70 and 74 years, 0.63% (0.56 to 0.71) if between 75 and 79 years, and as high as 1.6% (1.47 to 1.75) if over 80 years.10 The risk of 90-day mortality for women was less, but still almost 1% (0.92; 0.84 to 1.00) for women over 80 years.
Figure 3, taken from the Norwegian Registry, demonstrates how revision rates have improved compared with historical prostheses.9
Unicompartmental knee replacement (UKR)
The UK registry published a CRR of 11.57 (11.11 to 12.66) for all UKR at nine years.10s Rates were even higher in New Zealand (15.79; no CI calculated) at 11 years, and 18.0 (17.0 to 19.0) for the Australian Registry at 12 years.6,9 The Australian results possibly explain why the rate of UKA in Australia has dropped by 49% over the past eight years.
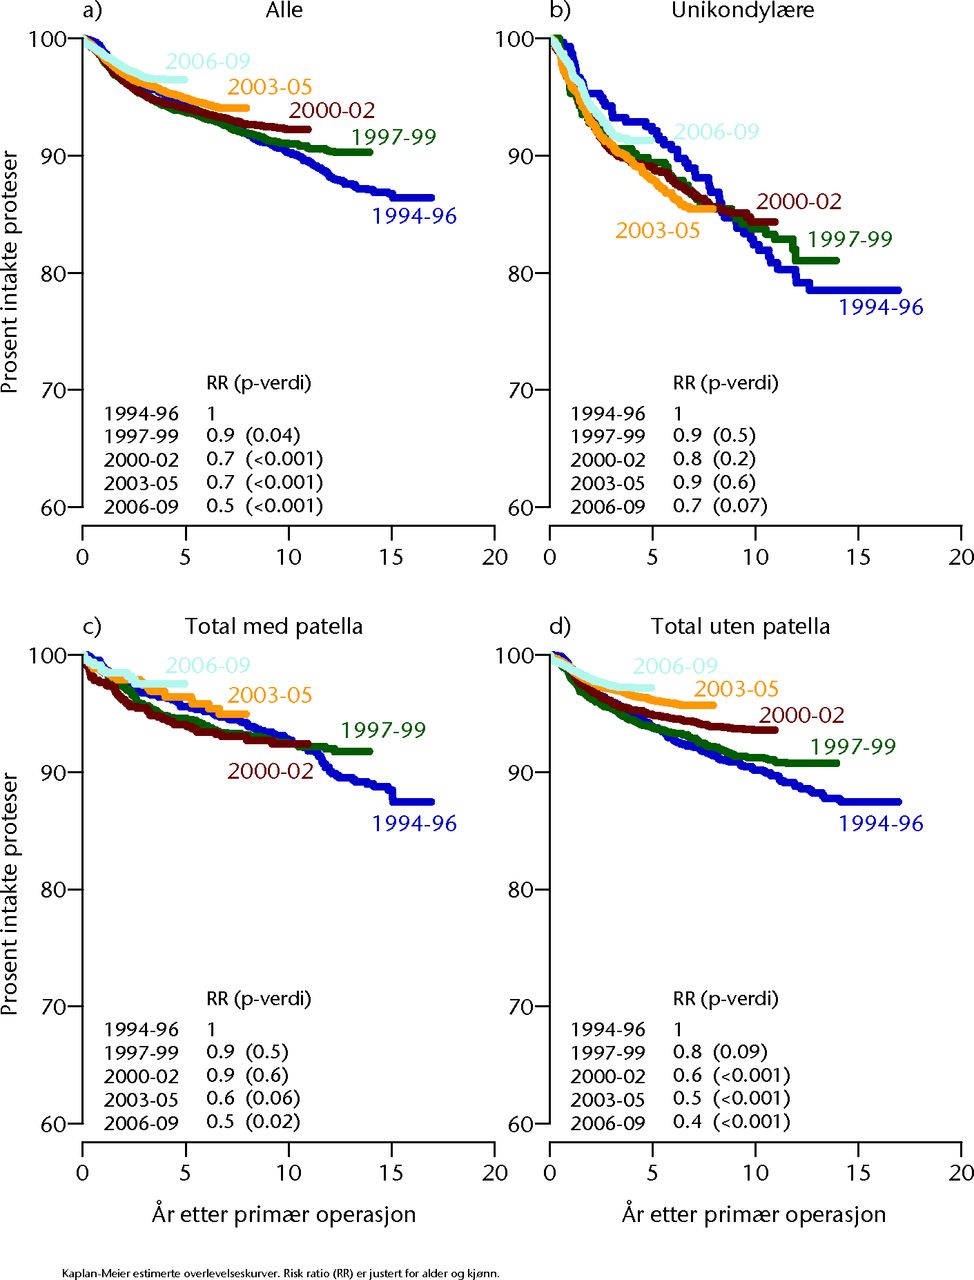
Fig. 3
Survivorship of historical knee prostheses. Reprinted with permission from The Norwegian Arthroplasty Registr, The Annual Report 2010 (www.haukeland.no/nrl).7
The UK registry discovered that higher revision rates were found for mobile bearing UKRs (11.86; 11.11 to 12.66) compared with fixed bearing prostheses (10.72; 9.34 to 12.29), although there is a large overlap of the confidence intervals and no Hazard Ratio published to confirm the clinical significance of this finding.10 The Danish Registry calculated the Hazard ratio for the risk of revision of UKA compared with TKR to be 2.25 (2.01 to 2.52).8 A paper published using the UK registry data found no differences in revision rates between lateral and medial implants.15
The interpretation of revision rates of UKR using registry data has been a subject of much scrutiny and criticism.16 The New Zealand registry has found that patients with a lower Oxford Knee Score (OKS)17 with a UKA are more likely to undergo revision surgery than the same OKS in a TKR (likely due to the fact that it is less difficult to revise a UKR than a TKR). Revision data, when applied to UKR or PFJ replacements must therefore be interpreted with care.
Patellofemoral joint (PFJ) replacement
Rates of revision are even higher for PFJ replacements. The UK registry published CRR of 16.11 (14.09 to 18.39) at nine years and the Australian Registry published CRR of 28.9 (25.7 to 32.4) at 12 years.6,10
PROMS data
PROMS are becoming widely recognised as being increasingly important in the evaluation of joint replacements. Revision rates are only one of a number of indicators of success after arthroplasty. The collection of PROMs data adds another layer of complexity to data collection in registries, and a significant extra health economic burden. Potentially adding to the value of the registry PROMs also potentially adds to the pitfalls. Which scores should be used? When should data be collected and for how long? This is still a matter of debate. Again, before any analysis of such data is performed it is important to understand when and how data are collected and what the compliance rates for data collection are (even PROMs suffer from significant bias such as reporting bias, i.e. unhappy patients may be more likely to report their outcomes than satisfied ones). Table III explains which outcome measures are collected for each registry.
The UK collects data pre-operatively and at six months post-operatively. The registry claims 99.7% compliance pre-operatively, and 74.6% compliance at six months.10 Patients classified their satisfaction with their operation as excellent (23%), very good (35%), good (26%), fair (12%) and poor (4%), and 88% of patients had improved scores post-operation while 6.5% were worse. Improvements in the EQ5D index, EQ5D VAS and OKS were significantly better at six months (p < 0.001). Health benefits across the main fixation types and knee replacement subgroups showed improvements in all groups. The PFJ replacements, while showing significant improvements in PROMs data, showed smaller improvements when compared with other types of knee arthroplasty.
The Swedish Registry implemented a pilot study in two regions (prior to collecting PROMs nationally, which is now their intention), collecting EQ5D and KOOS scores pre-operatively and at one year post-operatively.5 Approximately 80% were satisfied with their surgery and 72% had improved their general health since their surgery (EQ5D VAS), slightly lower rates than in the UK registry.
The New Zealand Registry send OKS scores to patients at six months, five years and ten years post-TKR.9 The methodology behind data collection involved attempting to achieve a 20% response rate at six months (deemed ample enough by power analysis), and then these patients were sent questionnaires at five and ten years. Patients who had undergone revision surgery were excluded from analysis. It is not clear how many of the original sample were followed-up at five and ten years, however, OKS were a mean of 37 at six months, and 40 at both five and ten years post-TKR. The authors then went on to perform ROC analysis at five years to demonstrate that a patient with a score of less than 35.5 has five times the risk of revision within two years compared with a patient with a score of greater than 35.5. The risk of revision within two years is 3.2% if the Oxford score is less than 27, and 0.33% if the Oxford score is between 34 and 41. At six months, using the same analysis, an OKS > 42 had a 0.48% risk of revision within two years compared with a 6.2% risk of revision with an OKS of < 27. The New Zealand study also performed the same analysis for UKR.9 The OKS was 39 at six months, 41 at five, and 41 at ten years. At six months, the risk of revision (within two years) was 1.16% if OKS was between 34 and 41, but the risk of revision was a startling 20.6% if the OKS was less than 27. These data suggest that the OKS may be suitable for PROMs based follow-up.
Satisfaction rates after TKR in Denmark were 90% at one year after primary surgery, and 78% at one year after revision surgery. A total of 86% reported improved function at one year.8 The Californian registry collected WOMAC data pre-operatively and at six months, and showed an improvement from 53 to 76 (p < 0.0001).18
Interesting articles published from joint registry data
In addition to the annual reports, the registries are spawning a plethora of registry-based papers. While many of these fall into the ‘data trawl’ category, many also yield insights into patient outcomes that could never be achieved with a traditional methodology.
Survivorship of TKR after previous HTO
Analysis of the Finnish Registry showed survivorship rates for TKR after previous HTO to be 95.3% at five years, 91.8% at ten years, and 88.4% at 15 years based on a large cohort of 1036 patients.19 They found survivorship to be lower in this group compared with patients who had not undergone HTO previously (97.2%, 94.5% and 90.6%, respectively, p = 0.01).19 The same authors analysed data on UKR patients, comparing survivorship between UKR and TKR at 15 years. Survivorship was only 69.6% at 15 years in the UKR group, compared with 88.7% in the TKR group (p < 0.001).20
Does diabetes affect clinical outcomes?
Analysis of the Mayo Clinic Registry found that diabetes, as well as its severity, was associated with poorer functional outcomes at two and five years post-TKR.21 This was based on a cohort of 677 (out of 7139) with diabetes at two-year follow-up, and 353 (out of 4234) at five years. Patients were more likely to suffer moderate-severe limitations of activities of daily living (ADL) at two years (Odds Ratio (OR) 1.7), and five years (OR 1.7). Patients with complications related to their diabetes were even more likely to suffer limitations of ADL (OR 2.7 at two and five years).
Does patellar resurfacing lead to improved clinical outcomes?
Analysis of the UK registry looked at whether resurfacing the patella improved functional outcome scores after TKR (OKS).22 No difference was identified irrespective of the implant brand or design to a maximum of 12 months post-operation.
What factors increase infection rate?
Analysis of the Kaiser Permanente Registry of 56 000 patients in California (USA) showed that BMI > 35 (HR 1.47), diabetes mellitus (HR 1.28), male gender (HR 1.89), American Society of Anesthesiologist (ASA) Grade > 3 (HR 1.65), osteonecrosis (HR 3.65) and post-traumatic arthritis (HR 3.23) independently increase the risk of deep infection after TKR.23 The same paper also found that lower hospital volume and bilateral procedures appeared to reduce the infection rate.
How does surgeon or unit volume affect results?
A different paper based on the NJR looking at the revision rate based on surgeon and unit volume of UKR showed that high-volume surgeons and units had superior results.24 A minimum of 13 procedures per year was suggested. The New Zealand Registry looked at the individual surgeon volume and the resultant revision rate (for TKRs), and found that surgeons who performed between ten and 25 TKRs per year had statistically higher revision rates than surgeons who performed between 25 and 100 TKRs per year.
How do registry-collected data compare with revision rates in clinical studies?
Researchers in Austria compared registry-collected data for 36 knee arthroplasty systems with revision rates in clinical studies.25 Revision rates from all the clinical studies they examined did not differ significantly from registry data, but a significant difference was noted between revision rates published by developers and registry data.25
Limitations of registries
As demonstrated by this article, registries can provide a huge amount of information about implants, individual surgeons and units. They do not, however, tell the whole picture, and are essentially large observational studies. It is important to remember that no matter how successful the implant, the single most important factor in the success of surgery is the attention to detail during surgery. Careful patient selection and good surgical training is paramount.
Data analysis is only as good as the data entry. This highlights the importance of understanding the limitations of the particular registry being analysed. If compliance rates are low then the results are less reliable. It is a fine balance between collecting sufficient information from surgeons and patients before compliance rates drop.
Registries are slow to react to new changes in practice. For example, the UK registry does not collect data on ‘Patient Specific Instrumentation’, and neither does it collect data on local anaesthetic infiltration nor tranexamic acid use in knee arthroplasty. This may change with the increased awareness of early survival of new implants and initiatives such as Beyond Compliance.
This paper has analysed implant survivorship on published registry data. This has been limited by the ways that data have been aggregated and analysed by individual registries. The way data are presented means that it is difficult to create direct comparisons between individual implants or techniques, particularly across registries. We would encourage registries to work together to publish data that could be compared. This would then help surgeons to make informed decisions to use implants with proven outcomes.
Registries are, however, extremely good at identifying information at a population level. There is no better way of auditing outcomes, and information collected is valuable in the future planning of service provision. It has also been able to identify failing implants, such as the ASR (Depuy Orthopaedics) hip resurfacing.
The future for registries
As registries increase in size and number, it is important that data entry compliance rates remain high. Attention must be paid to how registries are paid for in this age of austerity. The collection of PROMs data has a significant health economic impact on already stretched healthcare resources. Industry or government involvement in the payment for registries must be publicly declared, and any analysis of data must be impartial and unbiased. In our opinion, it is vital that the base data collected by registries are published regularly, are available for public scrutiny and are made accessible to its surgeons for detailed interrogation and analysis. Table VI describes what we feel to be some of the key findings that we have identified from current registry data.
Table VI. Key findings from joint registries
| Key Findings |
|---|
| Knee arthroplasty numbers have significantly increased worldwide |
| The revision rate for all TKRs at 12 years is 6.5% (Australia) 6 |
| The lowest revision rates are found in cruciate-retaining fixed bearing cemented TKRs |
| Revision rates are higher in uncemented TKRs (compared with cemented), young patients (< 66 years compared with > 75 years), and males |
| The 90-day mortality rate after TKR for men > 80 years is 1.6% |
| The revision rate for UKR is 12% at nine years (UK) and 18% at 12 years (Australia). The revision rate for PFJ replacement is 16% at nine years (UK) and 29% at 12 years (Australia) 6,10 |
| 88% of patients after TKR have improved by six months post-operation; 6.5% are worse 6 |
| At five years post-operation, a patient with an Oxford Knee Score (OKS) of < 35.5 has five times the risk of revision than a patient with OKS > 35.5 9 |
| At five years post-operation the risk of revision of a TKR (within two years) is 3.2% if OKS < 27 9 |
| At six months post-operation the risk of revision of a UKR (within two years) is 21% if the OKS < 27 9 |
It is likely that registry data will be used in the decision making behind implant choices, either at a unit, regional, or even national level. The linkage of PROMs data with survivorship data provides valuable information that can be used for the justification of either the use of certain implants, or the decision not to use other types of implants, however, this will need to be done with care and in the light of published research trials.
There are now a number of large registries. We look forward to these registries becoming more established. The growing communication between registries (such as the ISAR meetings), and collaboration (such as the collaboration between many of the American registries), will add to their strength. These qualities will improve their ability to identify failing implants and drive up standards of care.
1 No authors listed. ISAR International Society of Arthroplasty Registers: Directory. http://www.isarhome.org/directory (date last accessed 16 April 2014). Google Scholar
2 Graves S. Arthroplasty Registries: What they can and can’t do. What they should and shouldn’t do. What makes a quality Registry? Paper presented at Annual Scientific Meeting 2014 of British Hip Society, Exeter UK. Google Scholar
3 Phillips JRA. Joint registries: where we are, where we’ve been and where we are going. Bone Joint 360 2013;2:8-12. Google Scholar
4 Kurtz S , OngK, LauE, MowatF, HalpernM. Projections of primary and revision hip and knee arthroplasty in the United States from 2005 to 2030. J Bone Joint Surg [Am]2007;89-A:780–785.CrossrefPubMed Google Scholar
5 No authors listed. Swedish Knee Arthroplasty Register: Annual Report 2012. http://www.myknee.se/pdf/117 (date last accessed 23 April 2014). Google Scholar
6 No authors listed. Australian Orthopaedic Association National Joint Replacement Registry: Hip and Knee Arthroplasty, Annual Report 2013. https://aoanjrr.dmac.adelaide.edu.au/ (date last accessed 23 April 2014). Google Scholar
7 No authors listed. The Norwegian Arthroplasty Register: Report June 2010. http://nrlweb.ihelse.net/Rapporter/Rapport2010.pdf (date last accessed 23 April 2014). Google Scholar
8 No authors listed. Danish Knee Arthroplasty Register: Annual Report 2010. http://www.dhr.dk/Ny%20mappe/rapporter/DHR%20Aarsrapport_2010%20t_web.pdf (date last accessed 23 April 2014). Google Scholar
9 No authors listed. The New Zealand Joint Registry: Fourteen Year Report January 1999 to December 2012. http://www.nzoa.org.nz/system/files/NJR%2014%20Year%20Report.pdf (date last accessed 23 April 2014). Google Scholar
10 No authors listed. National Joint Registry: 10th Annual Report 2013. http://www.njrcentre.org.uk/njrcentre/Portals/0/Documents/England/Reports/10th_annual_report/NJR%2010th%20Annual%20Report%202013%20B.pdf (date last accessed 23 April 2014). Google Scholar
11 No authors listed. Canadian Institute for Health Information: Hip and Knee Replacements in Canada; Canadian Joint Replacement Registry 2013 Annual Report. https://secure.cihi.ca/estore/productFamily.htm?locale=en& pf=PFC2209& lang=en& media=0 (date last accessed 23 April 2014). Google Scholar
12 No authors listed. Beyond Compliance: Protecting patients, supporting innovation. http://www.beyondcompliance.org.uk/Home.aspx (date last accessed 23 April 2014). Google Scholar
13 Santaguida PL, Hawker GA, Hudak PL, et al. Patient characteristics affecting the prognosis of total hip and knee joint arthroplasty: a systematic review. Can J Surg 2008;51:428-436. Google Scholar
14 Hooper GJ , RothwellAG, FramptonC, WyattMC. Does the use of laminar flow and space suits reduce early deep infection after total hip and knee replacement?: the ten-year results of the New Zealand Joint Registry. J Bone Joint Surg [Br]2011;93-B:85–90.CrossrefPubMed Google Scholar
15 Baker PN , JamesonSS, DeehanDJ, et al.Mid-term equivalent survival of medial and lateral unicondylar knee replacement: an analysis of data from a National Joint Registry. J Bone Joint Surg [Br]2012;94-B:1641–1648.CrossrefPubMed Google Scholar
16 Goodfellow JW , O'ConnorJJ, MurrayDW. A critique of revision rate as an outcome measure: re-interpretation of knee joint registry data. J Bone Joint Surg [Br]2010;92-B:1628–1631.CrossrefPubMed Google Scholar
17 Dawson J , FitzpatrickR, MurrayD, CarrA. Questionnaire on the perceptions of patients about total knee replacement. J Bone Joint Surg [Br]1998;80-B:63–69.CrossrefPubMed Google Scholar
18 No authors listed. The California Joint Replacement Registry: Progress Update Spring 2013. http://www.caljrr.org/about/CJRR-2013-progress-update.aspx (date last accessed 23 April 2014). Google Scholar
19 Niinimäki T , EskelinenA, OhtonenP, et al.Total knee arthroplasty after high tibial osteotomy: a registry-based case-control study of 1,036 knees. Arch Orthop Trauma Surg2014;134:73–77.CrossrefPubMed Google Scholar
20 Niinimäki T , EskelinenA, MäkeläK, et al.Unicompartmental Knee Arthroplasty Survivorship is Lower Than TKA Survivorship: A 27-year Finnish Registry Study. Clin Orthop Relat Res2014;472:1496–1501.CrossrefPubMed Google Scholar
21 Singh JA , LewallenDG. Diabetes: a risk factor for poor functional outcome after total knee arthroplasty. PLoS One2013;8:78991.CrossrefPubMed Google Scholar
22 Baker PN , PetheramT, DowenD, et al.Early PROMs following total knee arthroplasty--functional outcome dependent on patella resurfacing. J Arthroplasty2014;29:314–319.CrossrefPubMed Google Scholar
23 Namba RS , InacioMC, PaxtonEW. Risk factors associated with deep surgical site infections after primary total knee arthroplasty: an analysis of 56,216 knees. J Bone Joint Surg [Am]2013;95-A:775–782.CrossrefPubMed Google Scholar
24 Baker P , JamesonS, CritchleyR, et al.Center and surgeon volume influence the revision rate following unicondylar knee replacement: an analysis of 23,400 medial cemented unicondylar knee replacements. J Bone Joint Surg [Am]2013;95-A:702–709.CrossrefPubMed Google Scholar
25 Pabinger C , BergholdA, BoehlerN, LabekG. Revision rates after knee replacement. Cumulative results from worldwide clinical studies versus joint registers. Osteoarthritis Cartilage2013;21:263–268.CrossrefPubMed Google Scholar
26 No authors listed. Jaarrapportage uit de Landelijke Registratie Orthopedische Implantaten 2012. Nederlandse Orthopaedische Vereniging (NOV) (Netherlands orthopaedic registry, English translation of summary). www.lroi.nl. (date last accessed 23 April 2014). Google Scholar
27 No authors listed. American Joint Replacement Registry: Fall 2013 Update. http://teamwork.aaos.org/ajrr/AJRR%20Documents/AJRR%20Fall%202013_F11062013.pdf (date last accessed 23 April 2014). Google Scholar
