


Abstract
Aims
To develop and validate patient-centred algorithms that estimate individual risk of death over the first year after elective joint arthroplasty surgery for osteoarthritis.
Methods
A total of 763,213 hip and knee joint arthroplasty episodes recorded in the National Joint Registry for England and Wales (NJR) and 105,407 episodes from the Norwegian Arthroplasty Register were used to model individual mortality risk over the first year after surgery using flexible parametric survival regression.
Results
The one-year mortality rates in the NJR were 10.8 and 8.9 per 1,000 patient-years after hip and knee arthroplasty, respectively. The Norwegian mortality rates were 9.1 and 6.0 per 1,000 patient-years, respectively. The strongest predictors of death in the final models were age, sex, body mass index, and American Society of Anesthesiologists grade. Exposure variables related to the intervention, with the exception of knee arthroplasty type, did not add discrimination over patient factors alone. Discrimination was good in both cohorts, with c-indices above 0.76 for the hip and above 0.70 for the knee. Time-dependent Brier scores indicated appropriate estimation of the mortality rate (≤ 0.01, all models).
Conclusion
Simple demographic and clinical information may be used to calculate an individualized estimation for one-year mortality risk after hip or knee arthroplasty (https://jointcalc.shef.ac.uk). These models may be used to provide patients with an estimate of the risk of mortality after joint arthroplasty.
Cite this article: Bone Joint Res 2020;9(11):808–820.
Article focus
-
Death is an uncommon but important outcome after joint arthroplasty to which several factors contribute.
-
To enable patients to come to an informed decision among the treatment choices, these risks must be personalized according to the patient’s own circumstances.
-
Validated patient decision support tools that quantify this risk in an easily accessible form are lacking.
Key messages
-
We have developed and validated prediction models that underpin a web-enabled, patient-centred tool to provide patients considering surgery an individualized estimation of outcomes after hip or knee arthroplasty.
-
Simple models containing basic demographic and comorbidity data provide a similar quality of mortality estimation to more complex models that include modifiable variables associated with the choice of intervention.
-
These same models provide similar discrimination when applied to another country, despite differences in mortality rates.
Strengths and limitations
-
These models were developed using the world’s largest joint arthroplasty register and validated in another long-established national register.
-
The models were developed using observational data in patients who have undergone these procedures.
-
In places where the data distribution is sparse, such as at the extremes of age and body mass index, the estimates are less robust.
Introduction
Patients considering any medical intervention need to be able to understand the potential risks and benefits of the different treatment options available. The use of decision support instruments can help patients to be better informed when making these choices.1-3 These instruments may provide generic information based on aggregate data, or more personalized information using algorithms that are tailored to the individual patient’s characteristics and the proposed intervention.4-6 Personalized instruments are more complex to construct than generic ones and require data gathered from a population of sufficient size, and with sufficient diversity of input and output variables to provide a statistically meaningful estimation of the outcomes.7,8
Death is an uncommon but important outcome after routine joint arthroplasty surgery, with 90-day mortality estimated in recent systematic reviews to be 0.65% (95% confidence interval (CI) 0.50 to 0.81) and 0.39% (95% CI 0.32 to 0.49) after total hip or knee arthroplasty, respectively.9,10 Older age, male sex, and pre-existing comorbidities are associated with a higher risk of death after surgery.11-16 Modifiable variables related to the choice of intervention such as surgical approach, use of thromboprophylaxis, and implant selection are also associated with the mortality outcome.11,12,17
We recently reported the development of the first comprehensive web-based personalized decision support tool for patients considering hip arthroplasty (https://jointcalc.shef.ac.uk).7,18,19 This tool was developed in partnership with patients to enable them to come to an informed decision about the risks and benefits of surgery. Here, we describe the development and validation of the tool’s underlying personalized models that generate absolute predicted risk of death over the first year after hip or knee arthroplasty using demographic, prosthesis, and procedure-related data from the National Joint Registry for England and Wales (NJR). The external generalizability of the prediction models was tested using cohort data from the Norwegian Arthroplasty Register (NAR).
Methods
Participating cohorts
The NJR cohort comprised individuals undergoing primary total hip and knee arthroplasty procedures between April 2003 and December 2015. NJR episode data for all patients are linked to death event and date through the National Patient Demographics Service of the Office for National Statistics. The NAR cohort dataset comprised primary total hip and knee arthroplasty procedures performed between January 2005 and December 2016. The Norwegian National Registry provided dates of death for all patients. For both cohorts we included procedures where osteoarthritis was the only indication for surgery and included only those patients with complete demographic records. All NJR analyses were carried out using Stata 15 (StataCorp, College Station, Texas, USA). The NAR cohort was analyzed independently using R version 3.5.1 (R Foundation for Statistical Computing, Vienna, Austria).
Modelling
We analyzed hip and knee arthroplasty procedures separately. Person-time incidence mortality rates per 1,000 patient-years were calculated separately for hip and knee procedures. We used flexible parametric survival regression (FPR) to model absolute mortality in the first year after surgery, due to its ability to estimate absolute risk in addition to relative risk.20 FPR uses restricted cubic splines to provide a flexible specification of the baseline hazard. For each joint type we considered two models: a ‘community-based’ version intended for use by the patient on any web-enabled device; and a ‘clinic-based’ version intended for completion by the patient with the support and input of a clinician. The clinic-based version includes modifiable variables related to the intervention, reflecting the additional choice information available in the clinic setting.
In the community-based hip model we considered age, sex, body mass index (BMI), and American Society of Anesthesiologists (ASA) physical status grade21,22 as covariates. For the clinic-based hip model we also included surgical approach, prosthesis fixation type, prosthesis-bearing materials, and diameter, anaesthetic, chemical, and mechanical thromboprophylaxis choices. In the community-based knee model we considered age, sex, BMI, and ASA grade as covariates. For the clinic-based knee model we also included prosthesis type (total, unicompartmental, or patellofemoral), anaesthetic choice, and chemical and mechanical thromboprophylaxis options. Details of the model specification and development are described in detail in the Supplementary Material.
Internal validation
We compared the agreement to the observed data using graphical methods and calculated metrics to assess the accuracy and discriminative ability of the models. We used internal cross-validation to calculate model performance metrics and calibration plots to visually assess model fit. We graphically compared the mean predicted survival from the chosen model to Kaplan-Meier estimates of mortality from the NJR within five prognostic groups, based on quintiles of the predicted risk. If a model shows good fit to the data then the predicted mortality curves should be in close agreement with the Kaplan-Meier curves.
Harrell’s concordance index (c-index) was used to assess the discrimination ability of the models. The c-index describes the proportion of all possible pairs of procedures where the procedure in the pair with the shortest observed survival time has a higher predicted risk.23 The c-index can range between 0 and 1, where a value of 0.5 indicates random assignment and values closer to 1 indicate positive discriminative ability, analogous to the area under a receiver operator characteristic curve. We calculated the c-index using somersd command in Stata, with adjustment for censoring.23,24 We used five-fold cross validation for our internal model validation, repeated 50 times, to calculate the above performance metrics with 95% CIs. Time-dependent Brier scores were used to evaluate overall predictive ability of our survival models.25 The Brier score is the mean squared difference between the actual outcome and predicted probability of that outcome at a given time. The Brier score can range between 0 and 1, where values closer to 0 indicate better predictive accuracy. We calculated time-dependent Brier scores, adjusted for censoring using Kaplan-Meier based censoring weights,26 at 1, 3, 6, 9, and 12 months.
External validation
To assess the generalizability of our models, we carried out external validation using data on primary hip and knee arthroplasties from the NAR. Information on BMI, anaesthetic type, and mechanical thromboprophylaxis are not recorded in the NAR and therefore these variables were excluded from the external validation models. In addition, as either low molecular weight heparin or aspirin are used almost universally for orthopaedic surgery chemical thromboprophylaxis in Norway, the models were not adjusted for other anticoagulants. We calculated person-time incidence mortality rates per 1,000 patient-years for hip and knee procedures in the registry separately. We calculated c-index and time-dependent Brier scores using R functions survConcordance and pec, respectively. We also generated calibration plots comparing NJR model based predicted mortality versus the observed mortality for patients in the NAR. As further exploratory analyses, hybrid models were also generated using the Norwegian baseline hazard together with the English coefficients (see Supplementary Material for details).
This study was approved by the Research Committees of the NJR and the NAR. Individual consent from subjects was not required, in accordance with data processing laws for pseudo-anonymized data in these countries.
Results
Participating cohorts
The initial NJR dataset included 768,385 linkable hip arthroplasty procedures and 839,192 linkable knee arthroplasty procedures with consent for analysis. After application of our inclusion and exclusion criteria (Figure 1), there were 340,033 hip arthroplasty procedures with the diagnosis of primary osteoarthritis available for complete case analysis, with 3,368 deaths observed within the first year after surgery. There were 423,180 knee arthroplasty procedures with the diagnosis of primary osteoarthritis available for complete case analysis, with 3,458 deaths within the first year after surgery. Information on demographic and surgical characteristics is provided in Table I for the included procedures. The overall incidence rate for mortality was 10.8 per 1,000 patient-years for hip arthroplasty procedures and 8.9 per 1,000 patient-years for knee arthroplasty procedures.
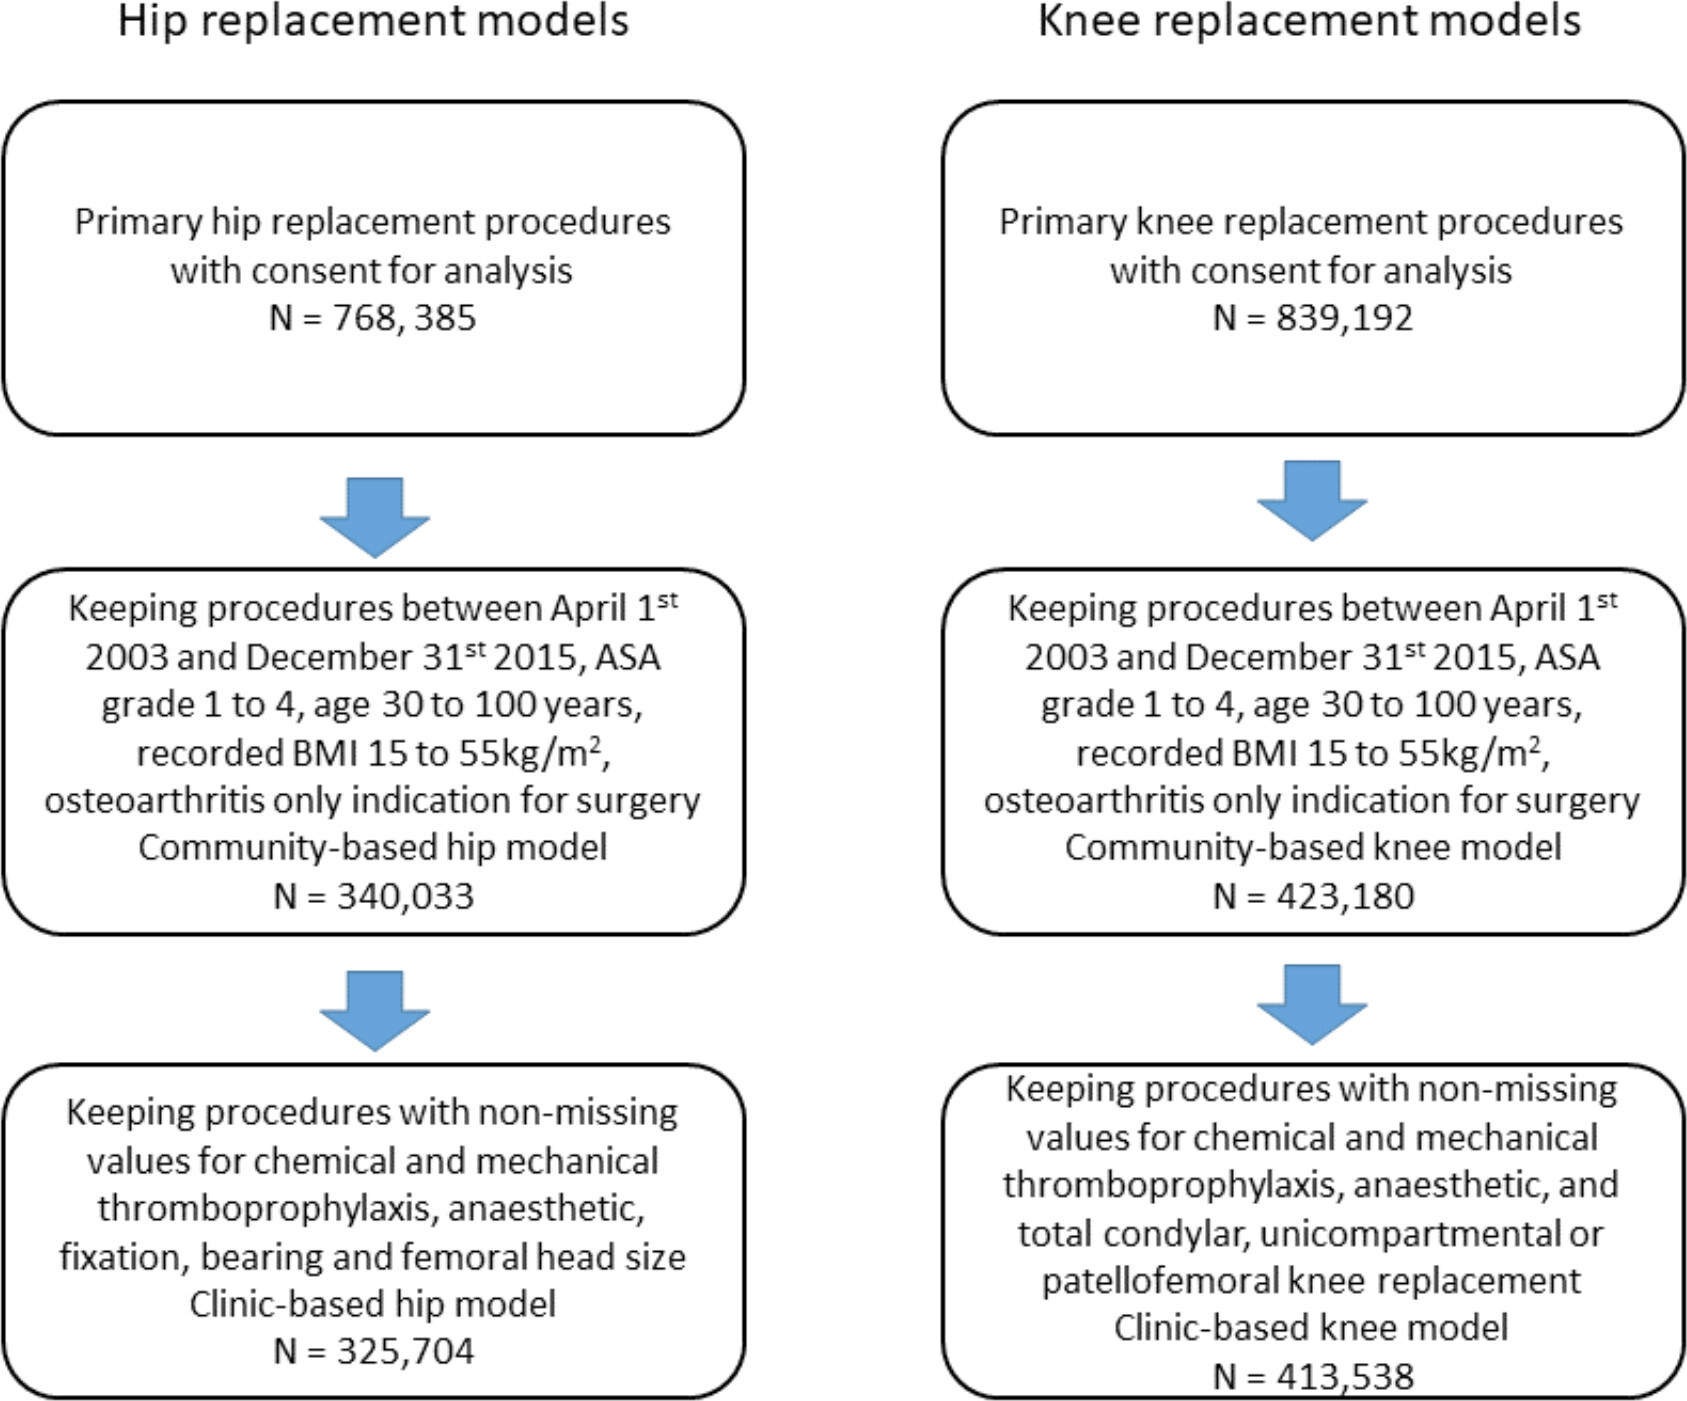
Fig. 1
Patient flow chart for inclusion in the National Joint Registry for England and Wales (NJR) models. ASA, American Society of Anaesthesiologists; BMI, body mass index.
Table I.
Demographic and surgical characteristics for National Joint Registry for England and Wales (NJR) hip and knee arthroplasty procedures included in the models.
| Characteristic | Hip arthroplasty procedures | Knee arthroplasty procedures | ||||||
|---|---|---|---|---|---|---|---|---|
| N | % | Deaths, n* | PTIR† | N | % | Deaths, n* | PTIR† | |
| All | 340,033 | 100.0 | 3,368 | 10.8 | 423,180 | 100.0 | 3,458 | 8.9 |
| Age, yrs | ||||||||
| 30 to 40 | 1,697 | 0.5 | 2 | 1.3 | 581 | 0.1 | 1 | 1.8 |
| 40 to 50 | 10,851 | 3.2 | 19 | 1.9 | 10,047 | 2.4 | 13 | 1.4 |
| 50 to 60 | 42,948 | 12.6 | 107 | 2.7 | 56,550 | 13.4 | 117 | 2.2 |
| 60 to 70 | 107,642 | 31.7 | 526 | 5.3 | 145,547 | 34.4 | 548 | 4.1 |
| 70 to 80 | 125,281 | 36.8 | 1,304 | 11.3 | 153,420 | 36.3 | 1,397 | 9.9 |
| 80 to 90 | 49,169 | 14.5 | 1,263 | 28.2 | 55,160 | 13.0 | 1,261 | 25.0 |
| 90 to 100 | 2,445 | 0.7 | 147 | 67.2 | 1,875 | 0.4 | 121 | 72.4 |
| Sex | ||||||||
| Female | 207,231 | 60.9 | 1,718 | 9.0 | 239,275 | 56.5 | 1,542 | 7.0 |
| Male | 132,802 | 39.1 | 1,650 | 13.5 | 183,905 | 43.5 | 1,916 | 11.3 |
| ASA class | ||||||||
| 1 | 48,480 | 14.3 | 149 | 3.3 | 47,162 | 11.1 | 143 | 3.3 |
| 2 | 241,695 | 71.1 | 1,867 | 8.4 | 311,003 | 73.5 | 2,117 | 7.4 |
| 3 | 48,588 | 14.3 | 1,242 | 28.2 | 63,857 | 15.1 | 1,130 | 19.4 |
| 4 | 1,270 | 0.4 | 110 | 98.1 | 1,158 | 0.3 | 68 | 64.5 |
| BMI, kg/m2 | ||||||||
| 15 to 18.5 | 2,467 | 0.7 | 88 | 39.2 | 785 | 0.2 | 19 | 26.1 |
| 18.5 to 25 | 74,010 | 21.8 | 928 | 13.6 | 47,373 | 11.2 | 635 | 14.5 |
| 25 to 30 | 136,077 | 40.0 | 1,287 | 10.3 | 149,620 | 35.4 | 1,296 | 9.4 |
| 30 to 40 | 117,169 | 34.5 | 977 | 9.1 | 199,058 | 47.0 | 1,336 | 7.3 |
| 40 to 55 | 10,310 | 3.0 | 88 | 9.4 | 26,344 | 6.2 | 172 | 7.1 |
| Chemical thromboprophylaxis | ||||||||
| None | 12,388 | 3.6 | 120 | 9.9 | 20,117 | 4.8 | 181 | 9.1 |
| Aspirin only | 21,628 | 6.4 | 246 | 11.9 | 32,833 | 7.8 | 315 | 10.0 |
| Heparin (± aspirin) | 216,978 | 63.8 | 2,159 | 10.8 | 266,795 | 63.0 | 2,151 | 8.7 |
| Other | 86,086 | 25.3 | 796 | 10.4 | 98,806 | 23.3 | 760 | 8.6 |
| Missing | 2,953 | 0.9 | 47 | 16.1 | 4,629 | 1.1 | 51 | 11.1 |
| Mechanical thromboprophylaxis | ||||||||
| None | 17,268 | 5.1 | 194 | 11.8 | 20,427 | 4.8 | 192 | 9.9 |
| Active‡ | 82,455 | 24.2 | 802 | 10.7 | 93,535 | 22.1 | 739 | 8.7 |
| Passive§ | 102,255 | 30.1 | 1,057 | 11.2 | 134,530 | 31.8 | 1,127 | 9.0 |
| Both | 124,504 | 36.6 | 1,169 | 10.2 | 164,671 | 38.9 | 1,295 | 8.6 |
| Other | 9,555 | 2.8 | 94 | 10.3 | 5,741 | 1.4 | 42 | 7.7 |
| Missing | 3,996 | 1.2 | 52 | 13.1 | 4,276 | 1.0 | 63 | 14.8 |
| Anaesthetic | ||||||||
| General only | 69,641 | 20.5 | 680 | 10.6 | 82,963 | 19.6 | 598 | 7.8 |
| Regional only | 203,492 | 59.8 | 2,025 | 10.9 | 263,413 | 62.2 | 2,233 | 9.3 |
| General and regional | 66,315 | 19.5 | 656 | 10.5 | 75,869 | 17.9 | 612 | 8.5 |
| Missing | 585 | 0.2 | 7 | 12.1 | 935 | 0.2 | 15 | 16.2 |
| Knee type | ||||||||
| Total | 380,440 | 89.9 | 3,309 | 9.4 | ||||
| Unicompartmental | 37,999 | 9.0 | 130 | 4.3 | ||||
| Patello-femoral | 4,741 | 1.1 | 19 | 3.7 | ||||
| Hip fixation | ||||||||
| Cemented | 119,387 | 35.1 | 1,589 | 14.4 | ||||
| Uncemented | 137,149 | 40.3 | 967 | 7.6 | ||||
| Hybrid | 69,025 | 20.3 | 652 | 10.5 | ||||
| Reverse hybrid | 9,209 | 2.7 | 100 | 11.9 | ||||
| Missing | 5,263 | 1.5 | 60 | 11.8 | ||||
| Hip bearing | ||||||||
| MoP | 217,310 | 63.9 | 2,744 | 13.7 | ||||
| CoC | 60,496 | 17.8 | 264 | 4.6 | ||||
| CoP | 58,642 | 17.2 | 311 | 6.0 | ||||
| Missing | 3,585 | 1.1 | 49 | 14.0 | ||||
| Femoral head size, mm | ||||||||
| < 32 | 153,638 | 45.2 | 1,728 | 11.9 | ||||
| 32 | 104,481 | 30.7 | 944 | 10.2 | ||||
| > 32 | 79,645 | 23.4 | 664 | 9.1 | ||||
| Missing | 2,269 | 0.7 | 32 | 14.5 | ||||
| Surgical approach | ||||||||
| Posterior | 132,686 | 39.0 | 1,468 | 11.8 | ||||
| Other | 207,347 | 61.0 | 1,900 | 10.1 | ||||
-
*
Observed deaths up to one year after surgery.
-
†
PTIR: person-time incidence rate (mortality rate) per 1,000 patient-years.
-
‡
Foot pump and/or calf compression.
-
§
Thromboembolic disease stockings.
-
ASA, American Society of Anesthesiologists; BMI, body mass index; CoC, ceramic on ceramic; CoP, ceramic on polyethylene; MoP, metal on polyethylene.
The initial NAR dataset included 207,936 linkable hip arthroplasty procedures and 89,689 linkable knee arthroplasty procedures with consent for analysis. After application of our inclusion and exclusion criteria (Figure 2), there were 60,814 hip arthroplasty procedures with the diagnosis of primary osteoarthritis available for complete case analysis, with 524 deaths observed within the first year after surgery. There were 44,593 knee arthroplasty procedures with the diagnosis of primary osteoarthritis available for complete case analysis, with 251 deaths within the first year after surgery. Information on demographic and surgical characteristics are provided in Table II for the included procedures. The overall incidence rate for mortality was 9.1 per 1,000 patient-years for hip arthroplasty procedures and 6.0 per 1,000 patient-years for knee arthroplasty procedures.
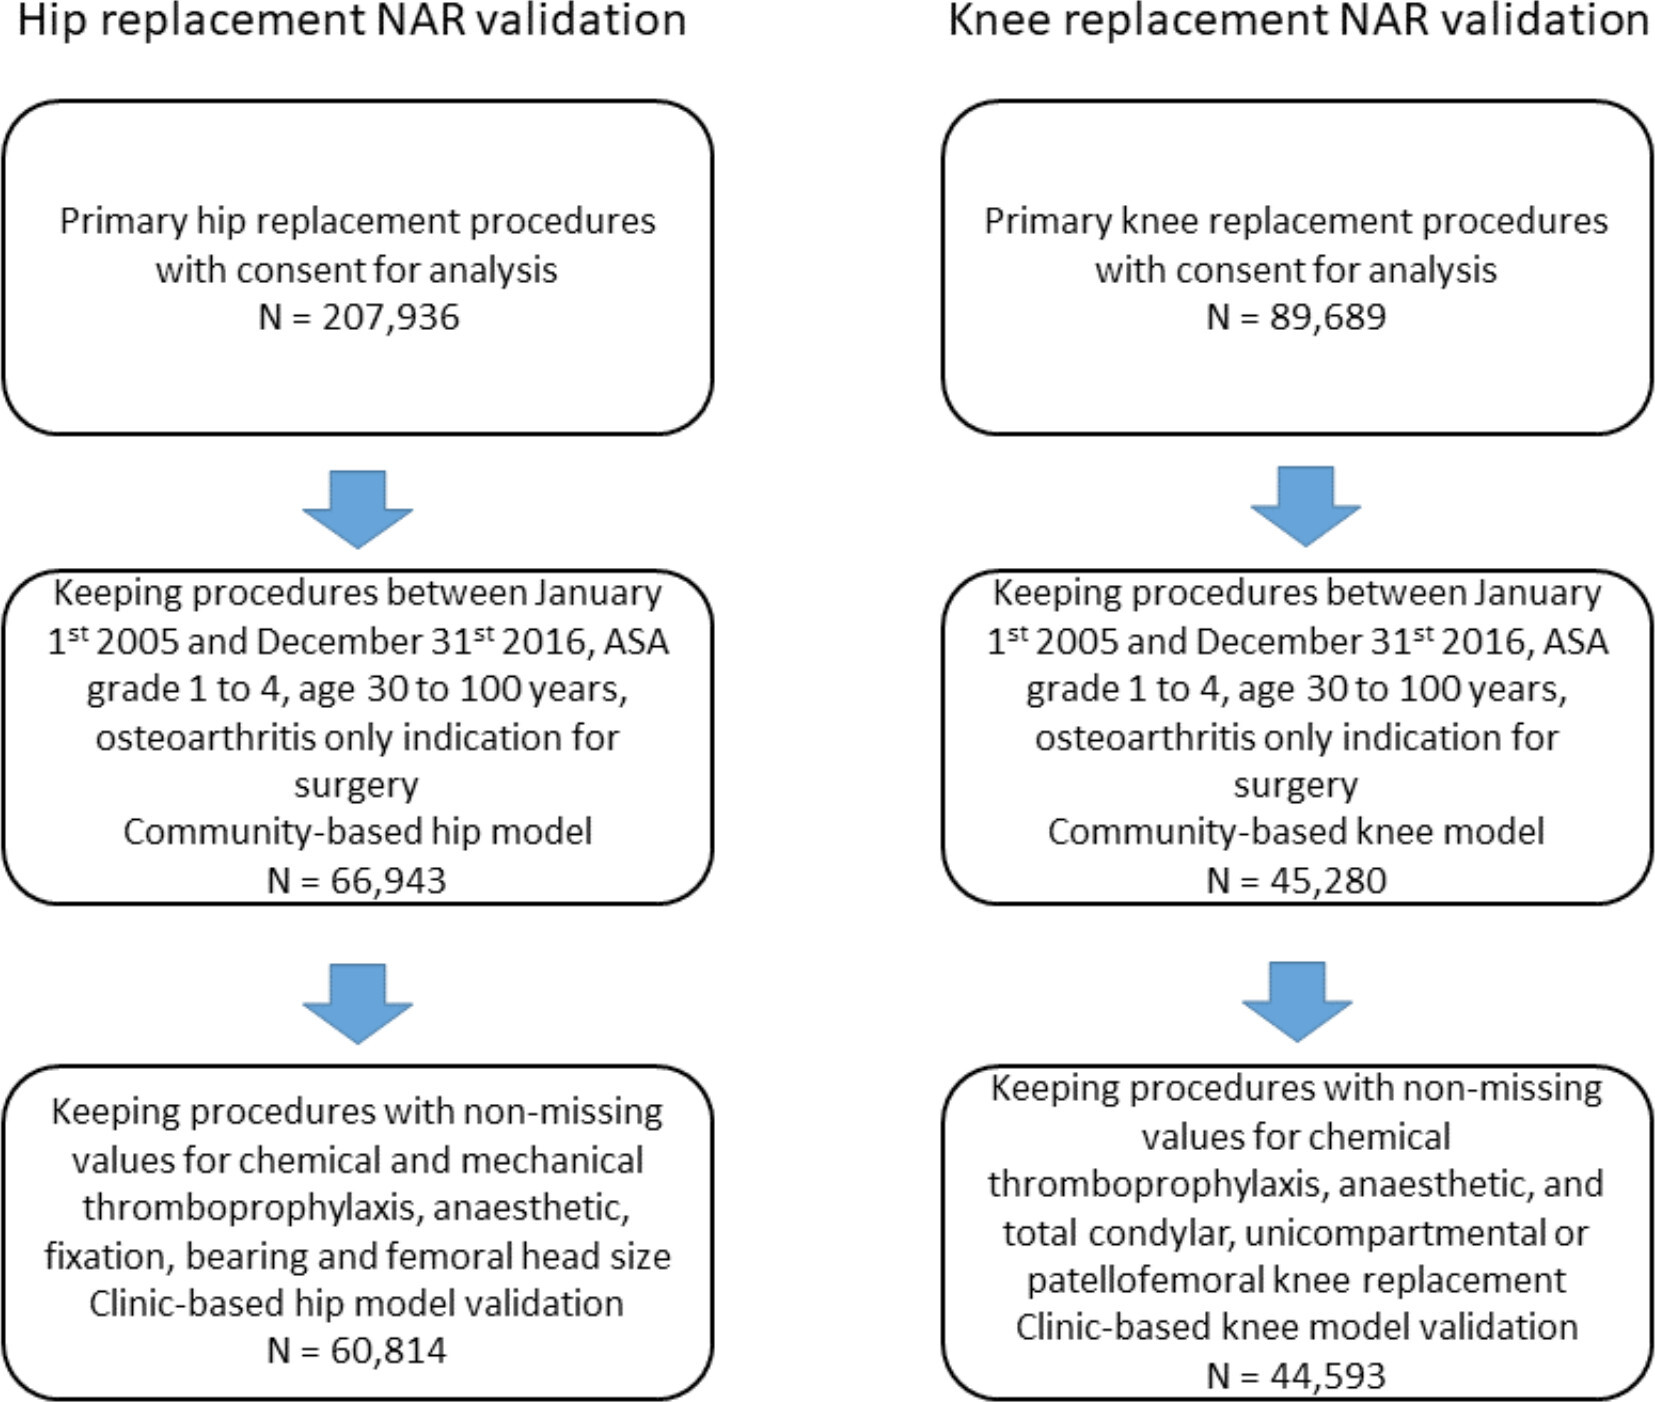
Fig. 2
Patient flow chart for inclusion in the Norwegian Arthroplasty Register (NAR) model validation.
Table II.
Demographic and surgical characteristics for Norwegian Arthroplasty Register (NAR) hip and knee arthroplasty procedures included in models.
| Characteristic | Hip arthroplasty procedures | Knee arthroplasty procedures | ||||||
|---|---|---|---|---|---|---|---|---|
| N | % | Deaths, n* | PTIR† | N | % | Deaths, n* | PTIR† | |
| All | 60,814 | 100.0 | 524 | 9.1 | 44,593 | 100.0 | 251 | 6 |
| Age, yrs | ||||||||
| 30 to 39 | 141 | 0.2 | 0 | 0 | 46 | 0.1 | 0 | 0 |
| 40 to 49 | 1,506 | 2.5 | 1 | 0.7 | 1,103 | 2.5 | 1 | 1 |
| 50 to 59 | 7,315 | 12 | 10 | 1.5 | 6,195 | 13.9 | 9 | 1.5 |
| 60 to 69 | 20,165 | 33.2 | 79 | 4.1 | 15,931 | 35.7 | 43 | 2.9 |
| 70 to 79 | 22,418 | 36.9 | 189 | 9 | 16,101 | 36.1 | 111 | 7.4 |
| 80 to 89 | 8,913 | 14.7 | 209 | 24.9 | 5,122 | 11.5 | 83 | 17.1 |
| 90 to 99 | 356 | 0.6 | 36 | 113.3 | 95 | 0.2 | 4 | 46.2 |
| Sex | ||||||||
| Male | 20,629 | 33.9 | 246 | 12.7 | 16,767 | 37.6 | 113 | 7.2 |
| Female | 40,185 | 66.1 | 278 | 7.3 | 27,826 | 62.4 | 138 | 5.2 |
| ASA class | ||||||||
| 1 | 11,707 | 19.3 | 34 | 3 | 6706 | 15 | 16 | 2.5 |
| 2 | 38,171 | 62.8 | 229 | 6.4 | 29,480 | 66.1 | 126 | 4.6 |
| 3 | 10,782 | 17.7 | 244 | 24.1 | 8,339 | 18.7 | 106 | 13.6 |
| 4 | 154 | 0.3 | 17 | 125.8 | 68 | 0.2 | 3 | 47.5 |
| Chemical thromboprophylaxis | ||||||||
| Other | 5,303 | 8.7 | 44 | 9 | 3,830 | 8.6 | 14 | 4.1 |
| Heparin (± aspirin) | 55,362 | 91 | 479 | 9.1 | 40,671 | 91.2 | 236 | 6.1 |
| Aspirin only | 144 | 0.2 | 1 | 8.6 | 91 | 0.2 | 1 | 13.7 |
| None | 5 | 0 | 0 | 0 | 1 | 0 | 0 | 0 |
| Knee type | ||||||||
| Total | 39,099 | 87.7 | 236 | 6.4 | ||||
| Unicompartmental | 5,303 | 11.9 | 15 | 3 | ||||
| Patello-femoral | 191 | 0.4 | 0 | 0 | ||||
| Hip fixation | ||||||||
| Cemented | 26,121 | 43 | 325 | 12.9 | ||||
| Uncemented | 13,870 | 22.8 | 61 | 4.8 | ||||
| Hybrid | 1,260 | 2.1 | 8 | 7.6 | ||||
| Reverse hybrid | 19,563 | 32.2 | 130 | 7.1 | ||||
| Hip bearing | ||||||||
| MoP | 41,558 | 68.3 | 416 | 10.6 | ||||
| CoC | 2,553 | 4.2 | 9 | 3.7 | ||||
| CoP | 16,703 | 27.5 | 99 | 6.2 | ||||
| Femoral head size, mm | ||||||||
| < 32 | 33,050 | 54.3 | 323 | 9.9 | ||||
| 32 | 24,530 | 40.3 | 178 | 8.1 | ||||
| > 32 | 3,234 | 5.3 | 23 | 7.8 | ||||
| Surgical approach | ||||||||
| Other | 39,976 | 65.7 | 386 | 10 | ||||
| Posterior | 20,838 | 34.3 | 138 | 7.3 | ||||
-
*
Observed deaths up to one year after surgery.
-
†
PTIR: person-time incidence rate (mortality rate) per 1,000 patient-years.
-
ASA, American Society of Anesthesiologists; CoC, ceramic on ceramic; CoP, ceramic on polyethylene; MoP, metal on polyethylene.
Modelling of mortality after hip arthroplasty
A proportional hazards model with four degrees of freedom for the spline terms was selected to model mortality after hip arthroplasty (see Supplementary Material). The strongest predictors of death in the final models were age, sex, BMI, and ASA grade. Covariate effects for the final hip models are presented in the Supplementary Material.
Risk prediction model
The models are built using flexible parametric regression with four degrees of freedom. All NJR models use the coefficients age, sex, ASA, and BMI. The NAR does not register height and weight so they were unable to use BMI in their models. The clinic-based NJR models use an expanded coefficient set, adding chemical thromboprophylaxis, mechanical thromboprophylaxis, and anaesthetic choice. The clinic-based hip models also look at hip fixation, hip bearing, femoral head size, and surgical approach, while the clinic-based knee models add knee type. Mechanical thromboprophylaxis and anaesthetic choice are not registered in the NAR data, and are thus excluded from the NAR models. The age variable is transformed according to the formula presented in the Supplementary Material.
The hazard is then calculated using formula 1:
Where
Three examples are given here: 1) a 30-year-old female, height 1.60 m and weight 65 kg (BMI 25.4 kg/m2), and with no comorbidities (ASA 1) using the community-based NJR mortality model has a one-year risk of death after hip arthroplasty of 0.035%; 2) a 65-year-old male, height 1.80 m and weight 140 kg (BMI 43.2 kg/m2), with comorbidities (ASA 3) using the community-based NJR mortality model has a one-year risk of death after hip arthroplasty of 1.4%; and 3) a 90-year-old male, height 1.80 and weight 75 kg (BMI 23.1 kg/m2), with mild comorbidities (ASA 2) using the clinic-based NJR mortality model, and undergoing a total knee arthroplasty under spinal anaesthetic using as heparin chemical but no mechanical thromboprophylaxis has a one-year mortality risk of 4.8%. The same individual undergoing a unicompartmental knee arthroplasty, but with the other intervention choices held constant has a one-year mortality risk of 3.2%.
Model validation
Figure 3 shows calibration plots comparing predicted mortality with Kaplan-Meier estimates from NJR data by quintile of predicted risk. These plots show that both the community-based and clinic-based models estimated mortality well across all risk quintiles, with a small tendency to underestimate risk in the > 80th quintile, and to slightly overestimate risk for the other quintiles. The internal cross-validation based c-index was 0.762 (95% CI 0.762 to 0.762) for the community-based model and 0.762 (95% CI 0.761 to 0.762) for the clinic-based model, indicating similar discrimination ability for both. The Brier scores for both community-based and clinic-based models were ≤ 0.01 (95% CI 0.01 to 0.01) at 12 months, indicating overall good estimation that weakened with increasing time after surgery (see Supplementary Material).
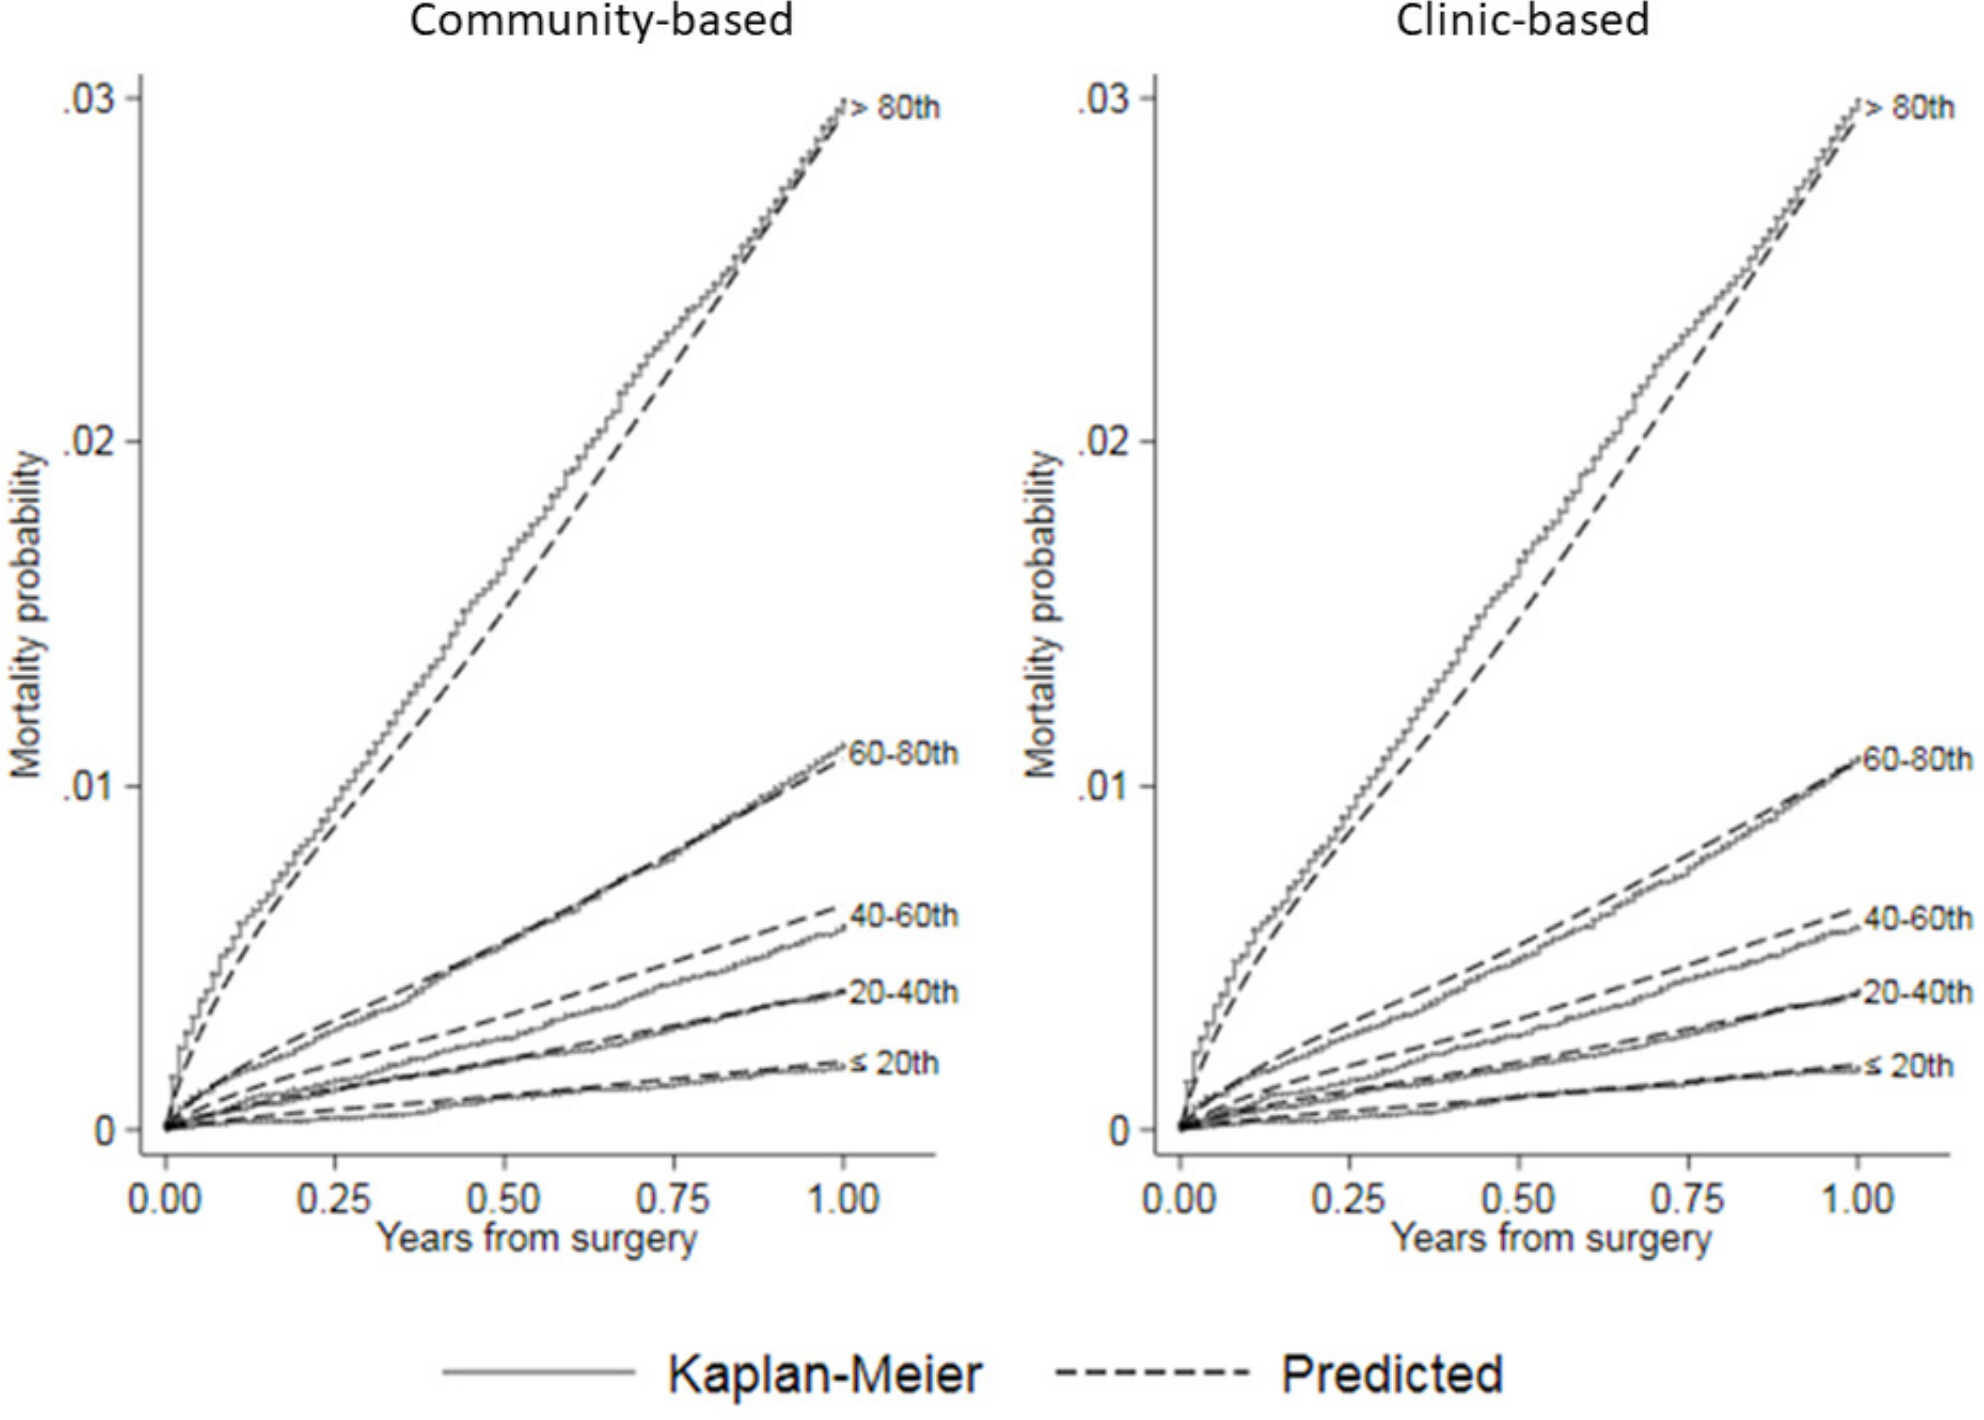
Fig. 3
Calibration plots comparing predicted mortality by risk quintile from community-based and clinic-based flexible parametric survival regression (FPR) models to Kaplan-Meier estimates of observed mortality after hip arthroplasty in the National Joint Registry for England and Wales (NJR).
Figure 4 shows that the observed NAR data map into similar risk quintiles as the NJR internal validation dataset, indicating that the populations as a whole behave similarly. The external validation c-index was 0.787 (95% CI 0.762 to 0.812) for the community-based model and 0.785 (95% CI 0.761 to 0.810) for the clinic-based model, indicating similar discrimination ability for both. The Brier scores remained small for both models (≤ 0.009 (95% CI 0.009 to 0.009) at 12 months, see Supplementary Material), indicating that they do not overestimate mortality within one year. Collectively, these data indicate that the NJR model is able to estimate one-year mortality risk in the NAR population.
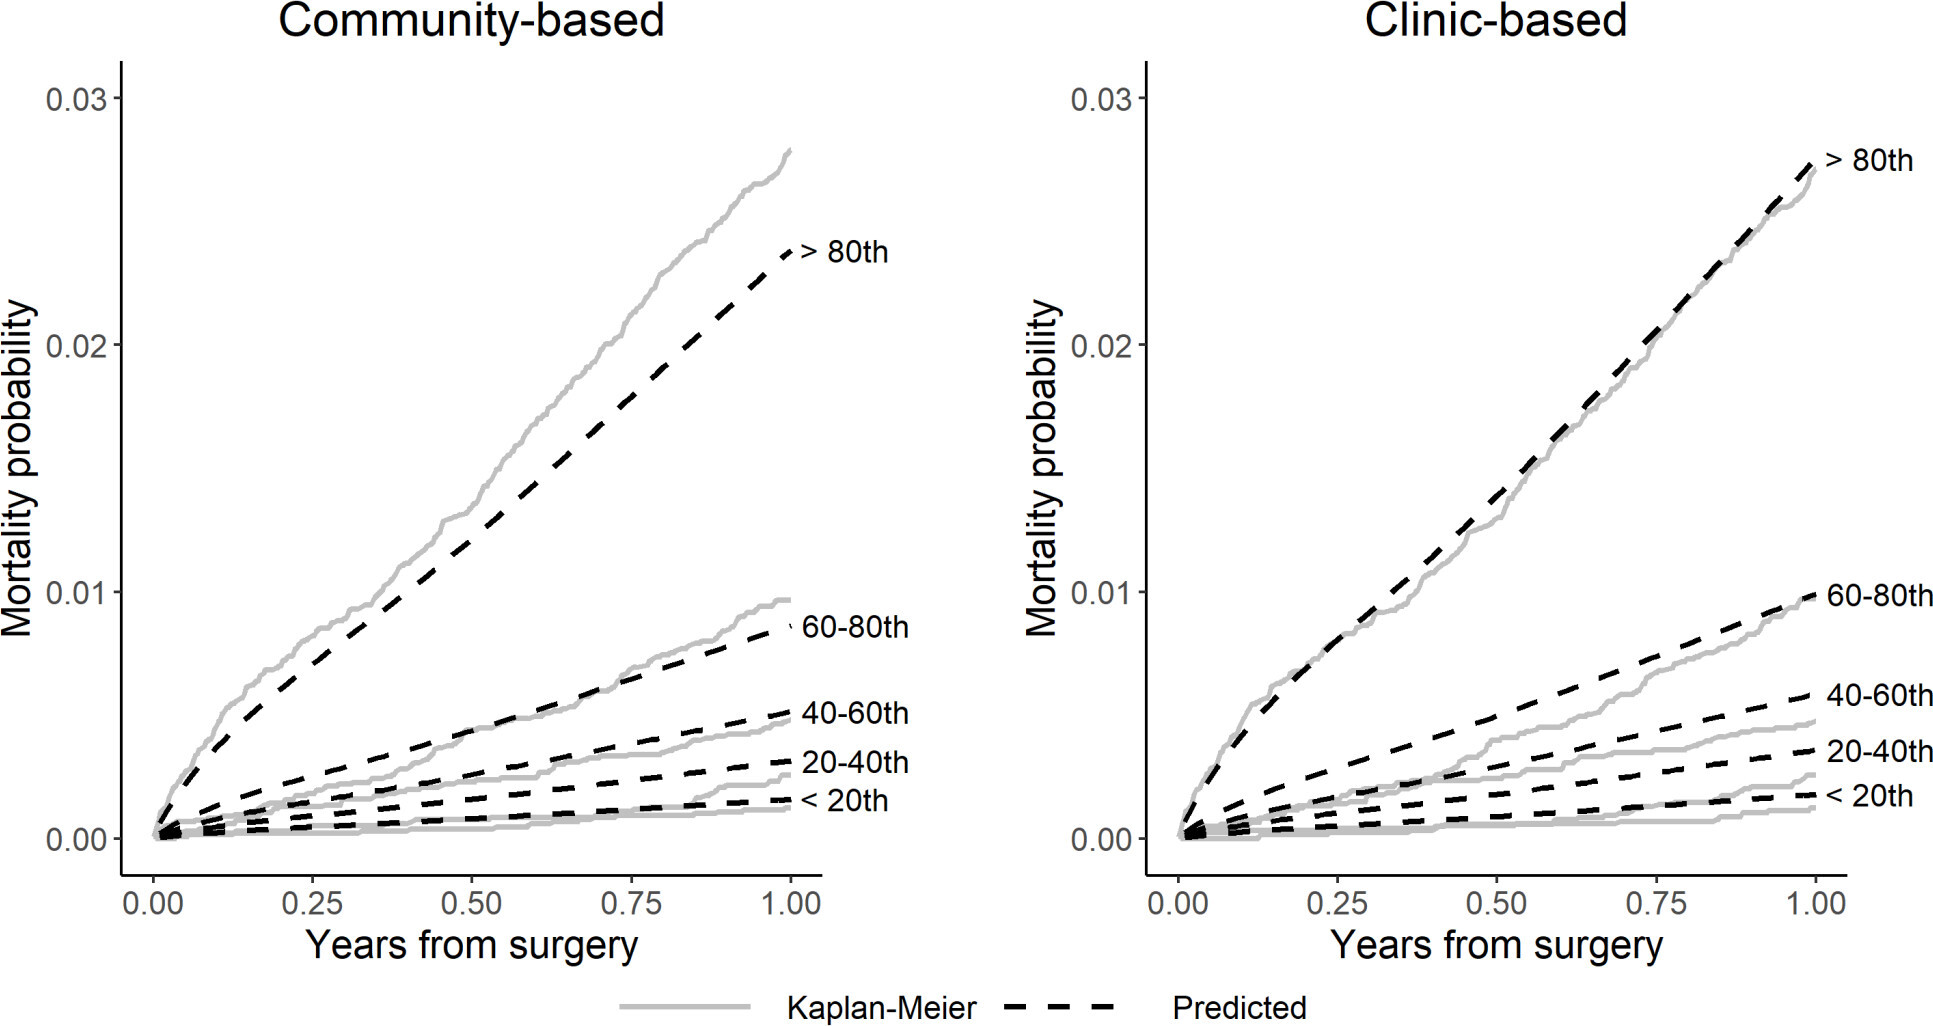
Fig. 4
Calibration plots comparing observed (Kaplan-Meier) versus predicted mortality by risk quintile for community-based and clinic-based hip models in Norwegian Arthroplasty Register (NAR) external validation.
To explore further the differences in mortality prediction between the NJR models and NAR hip dataset, we generated hybrid models where baseline hazards were exchanged between NJA and NAR mortality models. This exercise demonstrated a difference in the explanatory effects of the covariates of the hip models, indicating that the patients with referent risk characteristics are more divergent from the other subgroups in the NAR data than they are in the NJR data (see Supplementary Material). As the baseline hazard is also lower in the NAR model, the referent hip patient is less likely to die within one year than the referent patient in the NJR data. However, as the one-year mortality risk profiles separate into similar quintiles, we observe that the populations, as a whole, behave similarly within the two datasets.
Modelling of mortality after knee arthroplasty
Proportional hazards models with four degrees of freedom for the spline terms were selected for the knee mortality models (see Supplementary Material). The strongest predictors of death in the final models were age, sex, BMI, ASA grade, and knee arthroplasty type. Covariate effects for the final knee models are presented in the Supplementary Material.
Model validation
Figure 5 shows calibration plots comparing predicted mortality with Kaplan-Meier estimates from NJR by quintile of predicted risk. These plots show that both the community-based and clinic-based models estimated mortality well across all risk groups, with a small tendency to underestimate risk in the > 80th quintile and overestimate in the others. The internal cross-validation c-index was 0.760 (95% CI 0.759 to 0.761) for the community-based knee model and 0.760 (95% CI 0.760 to 0.761) for the clinic-based knee model, indicating similar discrimination ability. The Brier scores for both models were ≤ 0.01 (95% CI 0.01 to 0.01) at 12 months, indicating overall good estimation that weakened with increasing time after surgery (see Supplementary Material).
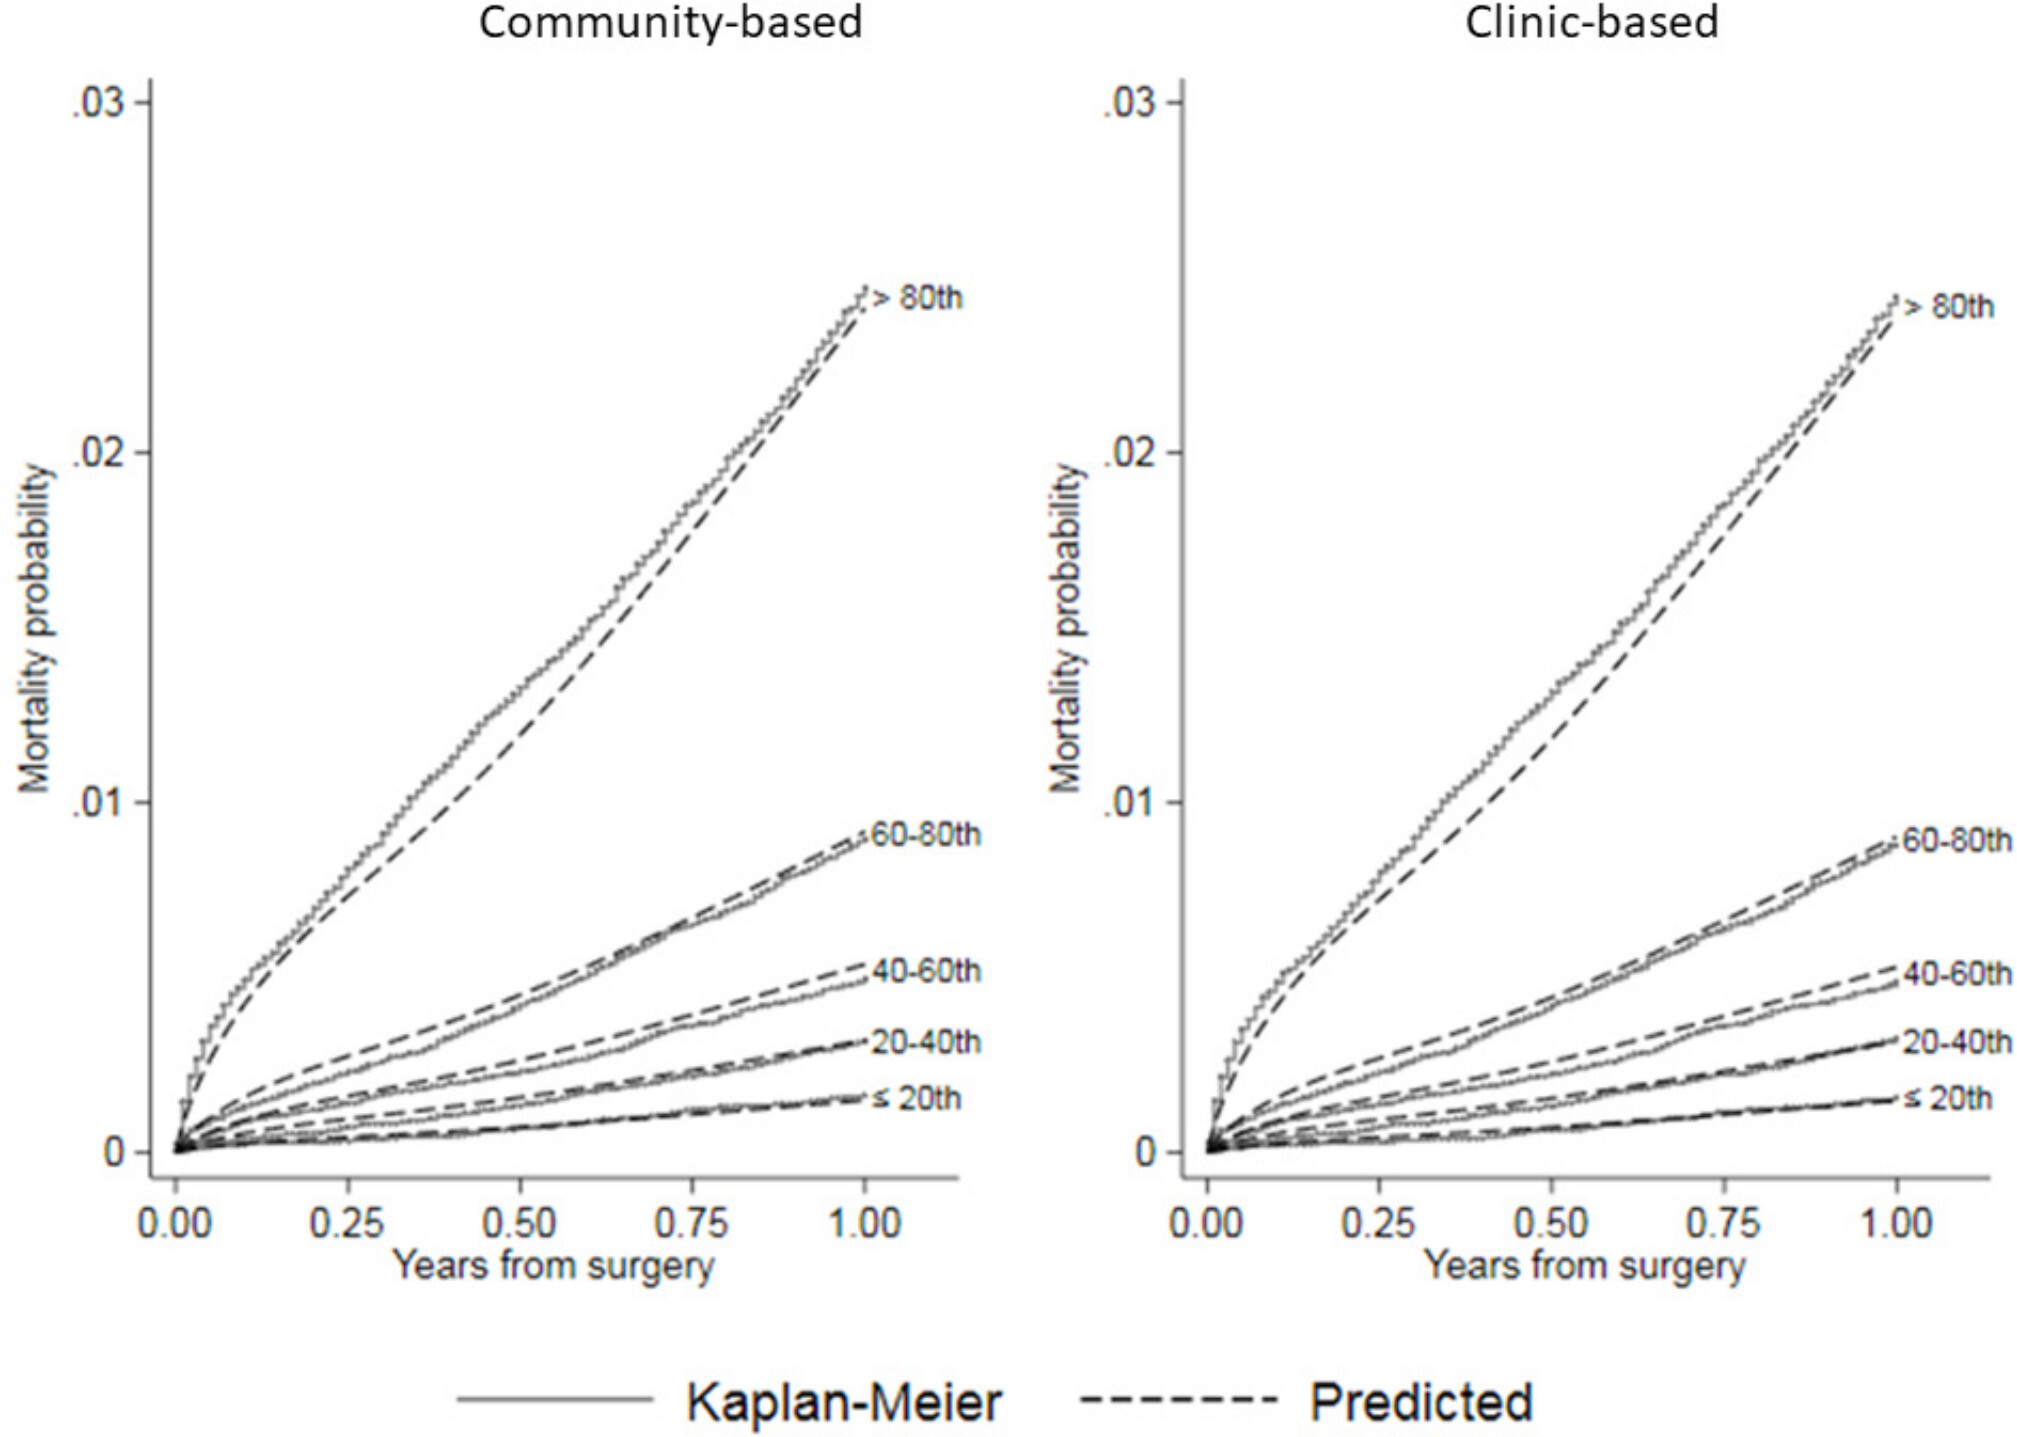
Fig. 5
Calibration plots comparing predicted mortality by risk quintile from community-based and clinic-based flexible parametric survival regression (FPR) models to Kaplan-Meier estimates of observed mortality after knee arthroplasty in the National Joint Registry for England and Wales (NJR).
Figure 6 shows that the NAR data separates into quintiles with lower risk of death compared to that predicted by the NJR mortality models. This is also seen in Table II, showing that the person-time incidence rate (mortality rate) per 1,000 patient-years (PTIR) for mortality in the NAR knee patients is lower than that in the NJR (6.0 vs 8.9 per 1,000 patient-years). This resulted in an overestimation of the mortality risk in the higher risk quintiles. The values for the external validation c-index were slightly poorer than observed for the internal validation, but still showed good discrimination (community-based c-index = 0.744 (95% CI 0.708 to 0.779), clinic-based c-index = 0.744 (95% CI 0.709 to 0.781)). The external validation Brier scores remained small for both models (≤ 0.006 (95% CI 0.006 to 0.006) at 12 months, see Supplementary Material), indicating that they do not overestimate mortality within one year. Collectively, these findings indicate that the English model has a strong predictive ability for one-year mortality in knee patients in the NAR data.
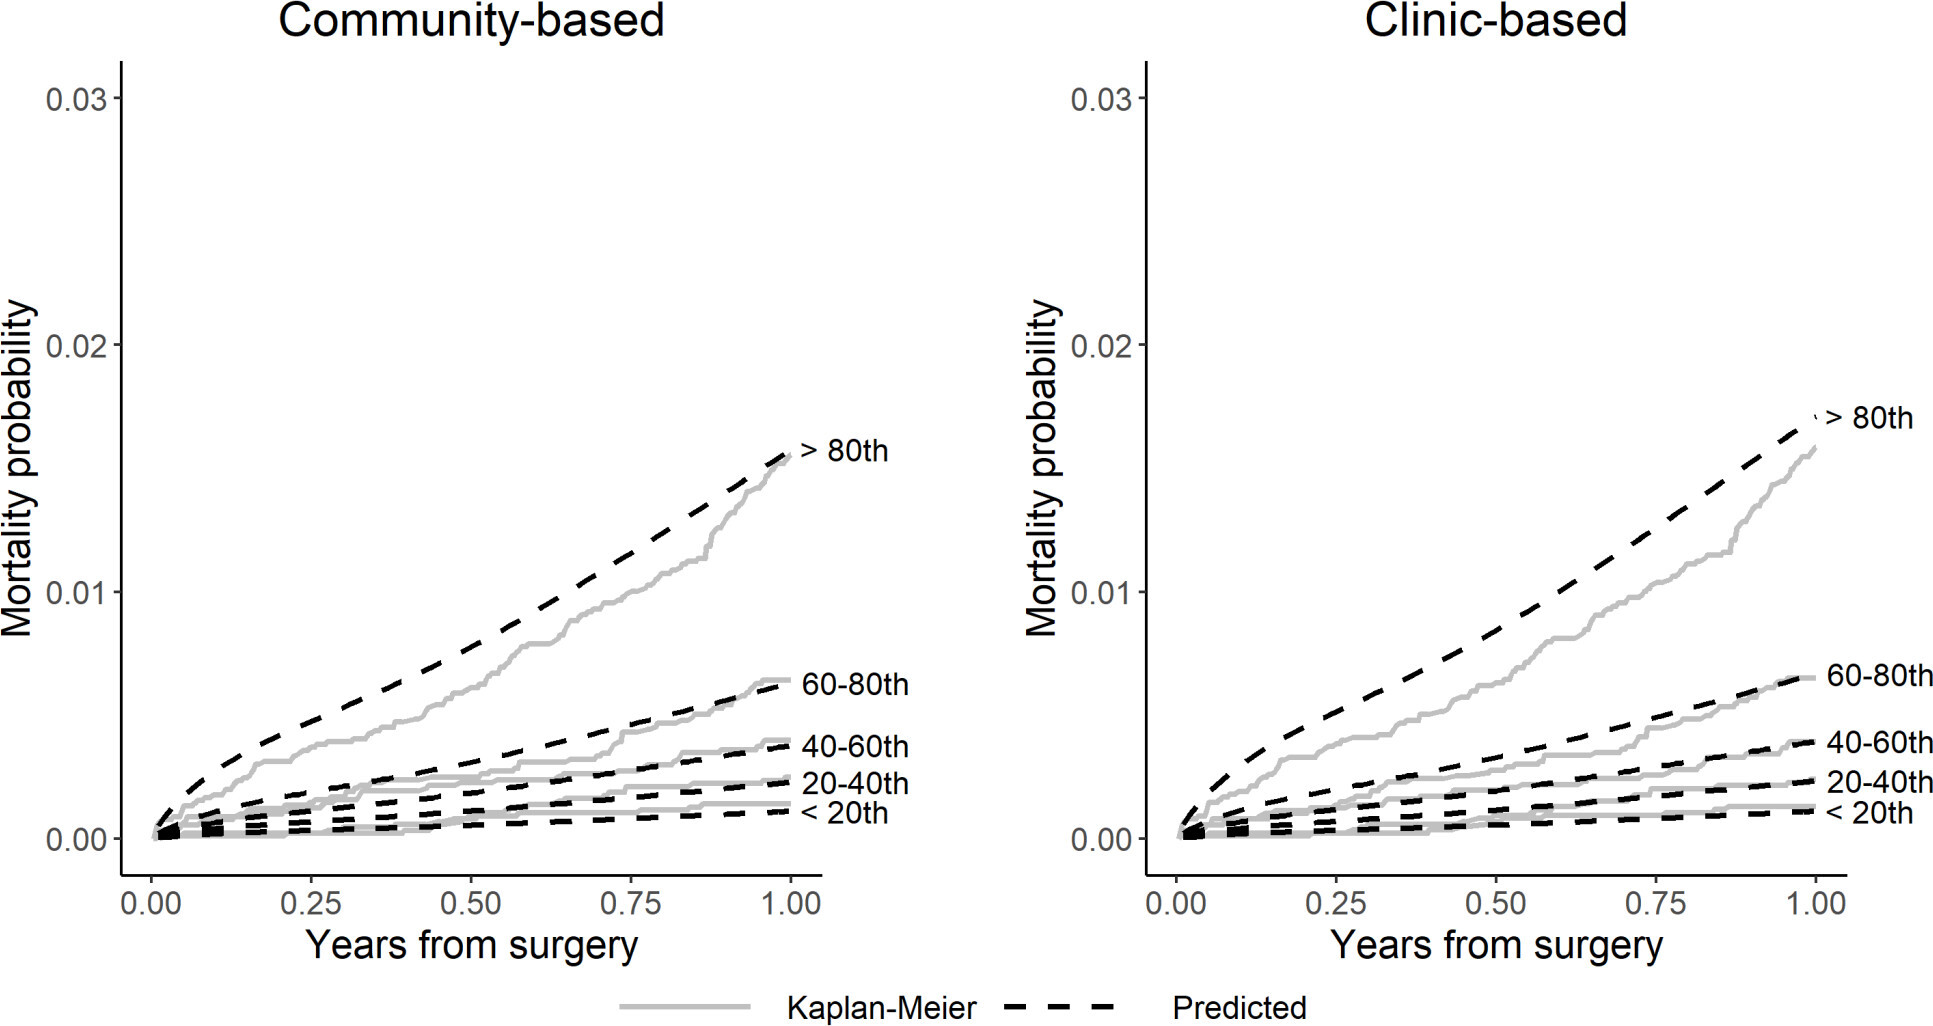
Fig. 6
Calibration plots comparing observed (Kaplan-Meier) versus predicted mortality by risk quintile for community-based and clinic-based knee models in the Norwegian Arthroplasty Register (NAR) external validation.
To explore further the differences in mortality prediction between the NJR models and the dataset, we generated hybrid models where baseline hazards were exchanged between NJR and NAR mortality models. Here, we observed that the patients with the referent risk characteristics behaved similarly within the two populations, such that neither the exchange of the baseline hazards nor the coefficients showed any meaningful difference in the predictive ability of the models (see Supplementary Material). Comparisons of the PTIRs in Tables I and II indicate that the highest risk patients in the NJR have a higher mortality rate than the highest risk patients in the NAR data. Thus, the mortality rate in the observed 80th quintile will be lower in the NAR data, as there are fewer patients dying overall. We can then infer that the NJR model will likely overestimate mortality in this subset of patients, as it was built on a higher mortality-rate population. This inference aligns with the observed data in Figure 6, where the NJR model overestimates mortality in the highest-risk patients.
Discussion
We used linked NJR and death data to generate models for personalized mortality estimation after joint arthroplasty surgery. We found that both the community-based and the clinic-based models were well-calibrated and showed good discrimination for mortality risk over one year following surgery. The models also validated well against external data from the NAR, despite underlying differences in mortality rates between the countries. The similarity of the calibration plots between the community-based and the clinic-based models also suggest that use of addition of modifiable intervention-related variables, with the exception of knee arthroplasty type, does not add to differential mortality risk prediction above basic demographic factors and comorbidity, as defined here by the ASA score. Although modifiable variables related to the intervention affect mortality at population level,11-13 our findings suggest that their effect size is insufficient to influence outcome for individual decision-making, apart from the choice between unicompartmental or total knee arthroplasty.17 One possible explanation for this observation is that these variables are associated with patient characteristics and therefore explain a proportion of the variability in the clinic-based model.13,17 However, these variables do influence other clinical outcomes of interest to patients in the decision-making process that justifies their inclusion in the model.7
Implications for future research
Although our observation of different mortality rates between the NJR and NAR patients did not adversely affect the estimation value of the models, it does suggest structural differences in the patient populations undergoing joint arthroplasty surgery between the countries. In support of this concept, in 2017 life expectancy in the UK for women was 82.9 years and 79.2 years for men, while in Norway it was 84.3 years and 80.9 years, respectively. The death rate in the UK in 2018 was 9.382 per 1,000, and in 2017 was 9.314 per 1,000 people, a 0.72% increase from 2016. In contrast, the death rate for Norway in 2018 was 7.998 per 1,000 people, and in 2017 was 8.038 per 1,000, a 0.5% decline from 2016.
The NJR is the world’s largest register of joint arthroplasty procedures and their outcomes, with completeness of reporting of ~95% for primary joint arthroplasty.27 As mortality information was obtained from linking to the Office for National Statistics, it is also likely to be reliable. The statistical model used allows a flexible specification of baseline hazard and for the incorporation of non-linear and non-proportional covariate effects. The principal reason for exclusion from the analysis was missing BMI data. This limitation may be addressed using imputation methods.28,29 However, as no independent BMI-related variables are collected, the results from such imputation are likely to be similar to those presented here.12 The external validation is based on data from the NAR, with high completeness of reporting of primary joint arthroplasties and deaths. The completeness of reporting for the years 2008 to 2016 was 97% for both hip and knee arthroplasty.30
There were a number of strengths and limitations in this study. Our models were generated using observational data among patients who have undergone joint arthroplasty, and therefore exclude the sickest patients who may not be considered for an elective procedure. This is evidenced by other findings that individuals who undergo joint arthroplasty surgery tend to have a lower mortality rate than the age- and sex-matched general population.31,32 We used the ASA grade as a simple measure of comorbidity rather than more complex methods, such as the Charlson Comorbidity Index.33 Previous studies indicate that the ASA score closely correlates with the Charlson Comorbidity Index across a range of musculoskeletal diseases, and is thus likely to be similarly discriminatory.34–37 We used a survivorship modelling approach. Given the short time horizon studied and the lack of patient censoring, an alternative approach would have been to treat the problem as one of logistic regression. Not all variables included in the NJR models were available in the NAR, therefore our external validation was carried out using adapted models that may have affected model performance.
In conclusion, we have constructed models to predict mortality risk over the first year after primary hip or knee arthroplasty. Overall, the risk of one-year mortality is generally low. The models show good fit and predictive ability for survival probabilities for the UK population, and also comprise a model structure that is generalizable to the Norwegian population. Although a model from one national cohort may be used to estimate risk in another, model discrimination and calibration is optimal when generated using data from the same cohort. These models may be incorporated into patient-centred decision support tools to better inform patients of the risks and benefits of joint arthroplasty surgery.19
References
1. O'Connor AM , Stacey D , Entwistle V , et al. Decision AIDS for people facing health treatment or screening decisions . Cochrane Database Syst Rev . 2009 ; 3 : CD001431 . Crossref PubMed Google Scholar
2. Kassirer JP . Incorporating patients' preferences into medical decisions . N Engl J Med . 1994 ; 330 ( 26 ): 1895 – 1896 . Crossref PubMed Google Scholar
3. Molenaar S , Sprangers MA , Postma-Schuit FC , et al. Feasibility and effects of decision aids . Med Decis Making . 2000 ; 20 ( 1 ): 112 – 127 . Crossref PubMed Google Scholar
4. Clark JP , Hudak PL , Hawker GA , et al. The moving target: a qualitative study of elderly patients' decision-making regarding total joint replacement surgery . J Bone Joint Surg Am . 2004 ; 86-A ( 7 ): 1366 – 1374 . PubMed Google Scholar
5. Hawker GA , Wright JG , Coyte PC , et al. Differences between men and women in the rate of use of hip and knee arthroplasty . N Engl J Med Overseas Ed . 2000 ; 342 ( 14 ): 1016 – 1022 . Crossref PubMed Google Scholar
6. Hawker GA , Wright JG , Badley EM , Coyte PC . Perceptions of, and willingness to consider, total joint arthroplasty in a population-based cohort of individuals with disabling hip and knee arthritis . Arthritis Rheum . 2004 ; 51 ( 4 ): 635 – 641 . Crossref PubMed Google Scholar
7. Aram P , Trela-Larsen L , Sayers A , et al. Estimating an individual's probability of revision surgery after knee replacement: a comparison of modeling approaches using a national data set . Am J Epidemiol . 2018 ; 187 ( 10 ): 2252 – 2262 . Crossref PubMed Google Scholar
8. Huber M , Kurz C , Leidl R . Predicting patient-reported outcomes following hip and knee replacement surgery using supervised machine learning . BMC Med Inform Decis Mak . 2019 ; 19 ( 1 ): 3 . Crossref PubMed Google Scholar
9. Berstock JR , Beswick AD , Lenguerrand E , Whitehouse MR , Blom AW . Mortality after total hip replacement surgery: a systematic review . Bone Joint Res . 2014 ; 3 ( 6 ): 175 – 182 . Crossref PubMed Google Scholar
10. Berstock JR , Beswick AD , López-López JA , Whitehouse MR , Blom AW . Mortality after total knee arthroplasty: a systematic review of incidence, temporal trends, and risk factors . J Bone Joint Surg Am . 2018 ; 100-A ( 12 ): 1064 – 1070 . Crossref PubMed Google Scholar
11. Hunt LP , Ben-Shlomo Y , Clark EM , et al. 90-day mortality after 409,096 total hip replacements for osteoarthritis, from the National Joint Registry for England and Wales: a retrospective analysis . Lancet . 2013 ; 382 ( 9898 ): 1097 – 1104 . Crossref PubMed Google Scholar
12. Hunt LP , Ben-Shlomo Y , Clark EM , et al. 45-day mortality after 467 779 knee replacements for osteoarthritis from the National Joint Registry for England and Wales: an observational study . Lancet . 2014 ; 384 ( 9952 ): 1429 – 1436 . Google Scholar
13. Dale H , Børsheim S , Kristensen TB , et al. Perioperative, short-, and long-term mortality related to fixation in primary total hip arthroplasty: a study on 79,557 patients in the Norwegian arthroplasty register . Acta Orthop . 2020 ; 91 ( 2 ): 152 – 158 . Google Scholar
14. Lie SA , Engesaeter LB , Havelin LI , Furnes O , Vollset SE . Early postoperative mortality after 67,548 total hip replacements: causes of death and thromboprophylaxis in 68 hospitals in Norway from 1987 to 1999 . Acta Orthop Scand . 2002 ; 73 ( 4 ): 392 – 399 . Crossref PubMed Google Scholar
15. Hunt LP , Blom A , Wilkinson JM . An analysis of 30-day mortality after weekend versus weekday elective joint arthroplasty in England and Wales: a cohort study using the National Joint Registry Dataset . Bone Joint J . 2017 ; 99-B ( 12 ): 1618 – 1628 . Crossref PubMed Google Scholar
16. Zeng C , Lane NE , Englund M , et al. In-hospital mortality after hip arthroplasty in China: analysis of a large national database . Bone Joint J . 2019 ; 101-B ( 10 ): 1209 – 1217 . Crossref PubMed Google Scholar
17. Liddle AD , Judge A , Pandit H , Murray DW . Adverse outcomes after total and unicompartmental knee replacement in 101,330 matched patients: a study of data from the National joint Registry for England and Wales . Lancet . 2014 ; 384 ( 9952 ): 1437 – 1445 . Crossref PubMed Google Scholar
18. Zotov E , Hills AF , de Mello FL , et al. JointCalc: a web-based personalised patient decision support tool for joint replacement . Int J Med Inform . 2020 ; 142 : 104217 . Crossref PubMed Google Scholar
19. No authors listed . Patient Decision Support Tool for Joint Replacement . National Joint Registry . 2020 . https://jointcalc.shef.ac.uk/ (date last accessed 09 October 2020 ). Google Scholar
20. Royston P , Parmar MKB . Flexible parametric proportional-hazards and proportional-odds models for censored survival data, with application to prognostic modelling and estimation of treatment effects . Stat Med . 2002 ; 21 ( 15 ): 2175 – 2197 . Crossref PubMed Google Scholar
21. Owens WD , Felts JA , Spitznagel EL . Asa physical status classifications: a study of consistency of ratings . Anesthesiology . 1978 ; 49 ( 4 ): 239 – 243 . Crossref PubMed Google Scholar
22. Saklad M . Grading of patients for surgical procedures . Anesthesiol . 1941 ; 2 ( 3 ): 281 – 284 . Google Scholar
23. Harrell FE , Lee KL , Mark DB . Multivariable prognostic models: issues in developing models, evaluating assumptions and adequacy, and measuring and reducing errors . Stat Med . 1996 ; 15 ( 4 ): 361 – 387 . Crossref PubMed Google Scholar
24. Newson R . Confidence Intervals for Rank Statistics: Somers’ D and Extensions . Stata J . 2006 ; 6 ( 3 ): 309 – 334 . Google Scholar
25. Gerds TA , Schumacher M . Consistent estimation of the expected Brier score in general survival models with right-censored event times . Biom J . 2006 ; 48 ( 6 ): 1029 – 1040 . Crossref PubMed Google Scholar
26. Graf E , Schmoor C , Sauerbrei W , Schumacher M . Assessment and comparison of prognostic classification schemes for survival data . Stat Med . 1999 ; 18 ( 17-18 ): 2529 – 2545 . Crossref PubMed Google Scholar
27. No author listed . Highlights: data quality audit . National joint registry . 2020 . https://reports.njrcentre.org.uk/NJR-Data-Quality-Audit-update (date last accessed 09 October 2020 ). Google Scholar
28. White IR , Royston P , Wood AM . Multiple imputation using chained equations: issues and guidance for practice . Stat Med . 2011 ; 30 ( 4 ): 377 – 399 . Crossref PubMed Google Scholar
29. Bhaskaran K , Smeeth L . What is the difference between missing completely at random and missing at random? Int J Epidemiol . 2014 ; 43 ( 4 ): 1336 – 1339 . Crossref PubMed Google Scholar
30. No authors listed . Norwegian National Advisory Unit on Arthroplasty and Hip Fractures . Norwegian Arthroplasty Register . 2020 . http://nrlweb.ihelse.net/eng/ (date last accessed 09 October 2020 ). Google Scholar
31. Hunt LP , Ben-Shlomo Y , Whitehouse MR , Porter ML , Blom AW . The main cause of death following primary total hip and knee replacement for osteoarthritis: a cohort study of 26,766 deaths following 332,734 hip replacements and 29,802 deaths following 384,291 knee replacements . J Bone Joint Surg Am . 2017 ; 99-A ( 7 ): 565 – 575 . Crossref PubMed Google Scholar
32. Pedersen AB , Baron JA , Overgaard S , Johnsen SP . Short- and long-term mortality following primary total hip replacement for osteoarthritis: a Danish nationwide epidemiological study . J Bone Joint Surg Br . 2011 ; 93-B ( 2 ): 172 – 177 . Crossref PubMed Google Scholar
33. Charlson ME , Pompei P , Ales KL , MacKenzie CR . A new method of classifying prognostic comorbidity in longitudinal studies: development and validation . J Chronic Dis . 1987 ; 40 ( 5 ): 373 – 383 . Crossref PubMed Google Scholar
34. Guo R , Yu W , Meng Y , et al. Correlation of ASA grade and the Charlson comorbidity index with complications in patients after transurethral resection of prostate . Urology . 2016 ; 98 : 120 – 125 . Crossref PubMed Google Scholar
35. Whitmore RG , Stephen JH , Vernick C , et al. ASA grade and Charlson Comorbidity Index of spinal surgery patients: correlation with complications and societal costs . Spine J . 2014 ; 14 ( 1 ): 31 – 38 . Crossref PubMed Google Scholar
36. Lavelle EAD , Cheney R , Lavelle WF . Mortality prediction in a vertebral compression fracture population: the ASA physical status score versus the Charlson comorbidity index . Int J Spine Surg . 2015 ; 9 : 63 . Crossref PubMed Google Scholar
37. Hailer NP , Garland A , Rogmark C , Garellick G , Kärrholm J . Early mortality and morbidity after total hip arthroplasty in patients with femoral neck fracture . Acta Orthop . 2016 ; 87 ( 6 ): 560 – 566 . Crossref PubMed Google Scholar
Author contributions
L. Trela-Larsen: Designed the study, Collated and Analyzed the data, Interpreted the results, Prepared and edited the manuscript.
G. Kroken: Collated and Analyzed the data, Interpreted the results, Prepared and edited the manuscript.
C. Bartz-Johannessen: Collated and Analyzed the data, Interpreted the results, Edited the manuscript.
A. Sayers: Designed the study, Interpreted the results, Edited the manuscript.
P. Aram: Designed the study, Interpreted the results, Edited the manuscript.
E. McCloskey: Designed the study, Interpreted the results, Edited the manuscript.
V. Kadirkamanathan: Designed the study, Interpreted the results, Edited the manuscript.
A. W. Blom: Designed the study, Edited the manuscript.
S. A. Lie: Designed the study, Interpreted the results, Edited the manuscript.
O. N. Furnes: Designed the study, Interpreted the results, Edited the manuscript.
J. M. Wilkinson: Designed the study, Analyzed the data, Interpreted the results, Prepared and edited the manuscript.
Funding statement
This work was supported by Arthritis Research UK (grant 20894). Adrian Sayers was supported by an MRC Strategic Skill Development award: MR/L01226X/1. The funders took no part in the study design; in the collection, analysis, and interpretation of data; in the writing of the report; or in the decision to submit the article for publication. No benefits in any form have been received or will be received from a commercial party related directly or indirectly to the subject of this article.
ICMJE COI statement:
None declared.
Acknowledgements
We thank the patients and staff of all the hospitals who have contributed data to the National Joint Registry (NJR). We are grateful to the Healthcare Quality Improvement Partnership (HQIP), the National Joint Registry Steering Committee (NJRSC), and staff at the NJR Centre for facilitating this work. The views expressed represent those of the authors and do not necessarily reflect those of the NJRSC or HQIP who do not vouch for how the information is presented. The authors would like to thank all Norwegian surgeons for conscientiously reporting joint and knee arthroplasties to theNorwegian Arthroplasty Register (NAR), and the secretaries, IT analyst, and statisticians at the NAR for entering the data and preparing them for analysis. The views expressed in this publication are those of the author(s) and not necessarily those of the NHS, the National Institute for Health Research, or the Department of Health.
Ethical review statement
This study was approved by the Research Committees of the National Joint Registry (20.12.2016) and the Norwegian Arthroplasty Registry. Individual consent from subjects was not required, in accordance with data processing laws for pseudoanonymized data in these countries.
Supplementary material
The supplementary material file includes: the general model specification and developmental methods; National Joint Registry for England and Wales (NJR) mortality models after hip arthroplasty and their validation; modelling mortality after hip arthroplasty using the Norwegian Arthroplasty Register (NAR) dataset; NJR mortality models after knee arthroplasty and their validation; and modelling mortality after knee arthroplasty using the NAR dataset. The file also includes accompanying tables and figures for these models and their validation.
© 2020 Author(s) et al. This is an open-access article distributed under the terms of the Creative Commons Attribution Non-Commercial No Derivatives (CC BY-NC-ND 4.0) licence, which permits the copying and redistribution of the work only, and provided the original author and source are credited. See https://creativecommons.org/licenses/by-nc-nd/4.0/.
