


Abstract
Aims
The study aimed to determine whether the microRNA miR21-5p (MiR21) mediates temporomandibular joint osteoarthritis (TMJ-OA) by targeting growth differentiation factor 5 (Gdf5).
Methods
TMJ-OA was induced in MiR21 knockout (KO) mice and wild-type (WT) mice by a unilateral anterior crossbite (UAC) procedure. Mouse tissues exhibited histopathological changes, as assessed by: Safranin O, toluidine blue, and immunohistochemistry staining; western blotting (WB); and quantitative real-time polymerase chain reaction (RT-qPCR). Mouse condylar chondrocytes were transfected with a series of MiR21 mimic, MiR21 inhibitor, Gdf5 siRNA (si-GDF5), and flag-GDF5 constructs. The effects of MiR-21 and Gdf5 on the expression of OA related molecules were evaluated by immunofluorescence, alcian blue staining, WB, and RT-qPCR.
Results
UAC altered the histological structure and extracellular matrix content of cartilage in the temporomandibular joint (TMJ), and KO of MiR21 alleviated this effect (p < 0.05). Upregulation of MiR21 influenced the expression of TMJ-OA related molecules in mandibular condylar chondrocytes via targeting Gdf5 (p < 0.05). Gdf5 overexpression significantly decreased matrix metalloproteinase 13 (MMP13) expression (p < 0.05) and reversed the effects of MiR21 (p < 0.05).
Conclusion
MiR21, which acts as a critical regulator of Gdf5 in chondrocytes, regulates TMJ-OA related molecules and is involved in cartilage matrix degradation, contributing to the progression of TMJ-OA.
Cite this article: Bone Joint Res 2020;9(10):689–700.
Article focus
-
The effect of miR21-5p (MiR21) knockout (KO) on temporomandibular joint osteoarthritis (TMJ-OA) mice.
-
Whether MiR21 can promote the TMJ-OA process by targeting growth differentiation factor 5 (Gdf5).
-
Whether Gdf5 stimulation decreases the expression of matrix metalloproteinase 13 (MMP13) and reverses the upregulation caused by MiR21.
Key messages
-
KO of MiR21 plays a vital role in blocking cartilage matrix degradation to affect the progression of TMJ-OA in mice.
-
Upregulation of MiR21 influences the expression of TMJ-OA related molecules in mandibular condylar chondrocytes (MCCs) by targeting Gdf5.
-
Gdf5 stimulation decreases the expression of MMP13 in MCCs and reverses the MiR21-induced upregulation of MMP13.
Strengths and limitations
-
We identified that inhibition of MiR21 may be a new therapeutic strategy for OA, and we determined the potential mechanism by which upregulation of MiR21 promotes TMJ-OA in vitro.
-
Since the temporomandibular joint (TMJ) is a unique linkage joint that differs from other joints in its anatomy and tissue structure, research on the TMJ is potentially valuable.
-
We are not confident in restorative changes in the KO mice subjected to unilateral anterior crossbite (UAC) (KO-OA) group and wild-type mice subjected to UAC (WT-OA) group observed in this study. Therefore, a longer investigation period is needed to further confirm whether the restorative trends differ between the two groups after three weeks.
Introduction
Temporomandibular joint osteoarthritis (TMJ-OA) is characterized by articular cartilage damage and degenerative changes in the synovium and subchondral bone, severely affecting the life quality of patients.1,2 The condylar cartilage, joint disc, and glenoid fossa are key components of the TMJ, but these structural surfaces are not completely matched with each other. Thus, stress concentrations are generated in the contact area if these surfaces are in inappropriate contact,3 which would causes serious damage and injury to the TMJ. Then, these surfaces erode and increasingly roughen, leading to pain and dysfunction. Eventually, this condition may progress to OA.4 Currently, the precise mechanism underlying TMJ-OA has not been sufficiently elucidated,5 and the aetiologies of TMJ-OA are complex and sometimes controversial.6 However, recently, a few studies have shown that the level of the microRNA miR21-5p (MiR21) is significantly increased in OA patients compared with patients without OA (p < 0.01, Student’s t-test).7,8 Thus, we hypothesized that regulation of the MiR21 level may be a therapeutic strategy for TMJ-OA.
MiR21, which has been shown to exhibit abnormal expression during carcinogenesis, functions as not only an important oncogene but also as a key participant in the self-renewal and directional differentiation of stem cells.9 Zhang et al7 confirmed that MiR21 can attenuate the process of chondrogenesis and Song et al10 verified that MiR21 can induce autophagy in chondrocytes. However, the mechanism underlying the role of MiR21 in the pathogenesis and progression of OA remains unclear. Growth differentiation factor 5 (Gdf5) is a cartilage-derived morphogenetic protein, and one previous study has demonstrated that mutations in its sequence of Gdf5 cause chondrodysplasia, which is characterized by nanomelia.11 Gdf5 has been shown to be downregulated in cartilage from patients with OA compared with that from normal controls.12 In addition, the mutation in the 5’ untranslated region (UTR) of Gdf5 has been shown to be involved in mediating susceptibility to OA.13 Previous studies have demonstrated that Gdf5 expression is critically related to the expression of chondrogenic and osteogenic gene markers as well as related transcriptional factors, such as runt-related transcription factor 2 (RUNX2) and SOX9.14 Furthermore, two classes of enzymes are responsible for degrading the chondrocyte extracellular matrix (ECM): matrix metalloproteinases (MMPs) and aggrecanases. MMP13 degrades the main component of the chondrocyte ECM, type II collagen (Col-II),15 and shows increased expression in samples from patients with knee OA; thus, MMP13 has been considered a critical biomarker reflecting the severity of arthritis.16 A disintegrin and metalloproteinase with thrombospondin motifs 5 (ADAMTS5), which degrades aggrecan (Agg, a proteoglycan localized mainly in the ECM), is considered the main aggrecanase in murine gene knockout (KO) models of OA.17,18 Therefore, verifying the involvement of the MiR21-Gdf5-catabolic enzyme pathway in TMJ-OA development is important for further relevant therapeutic management.
In the current study, we induced TMJ-OA in a unilateral anterior crossbite (UAC) model and determined the following: KO of MiR21 can ameliorate pathological alterations in UAC-induced TMJ-OA; upregulation of MiR21 influences the expression of TMJ-OA-related molecules in interleukin-6 (IL-6) stimulated chondrocytes by targeting Gdf5; and Gdf5 stimulation decreases the expression of MMP13 and reverses the upregulation caused by MiR21. These findings provide reliable support for the role of MiR21 and Gdf5 in TMJ-OA pathogenesis.
Methods
Sampling of mouse TMJ-OA cartilage
The whole experimental procedure was approved by the Institutional Animal Care Committee (Protocol GR2018017). A total of 20 wild-type (WT) mice and 20 MiR21 KO mice (aged six to eight weeks, weighing 18 g to 21 g) were bred from MiR21−/−C57BL/6 KO mice (two males, two females) purchased from Southeast University in Nanjing, China. The procedure for TMJ-OA induction in UAC model was performed as described previously.19 Then, the WT and KO mice were randomly divided into four subgroups each: WT-NC group (WT mice without UAC), WT-OA group (WT mice subjected to UAC), KO-NC group (KO mice without UAC), and KO-OA group (KO mice subjected to UAC). All mice were genotyped by polymerase chain reaction (PCR) amplification for tail DNA samples (Supplementary Figure a). After three weeks, the joints from mice in the different groups were collected and fixed with paraformaldehyde.
Histology and immunohistochemistry
For histological evaluation, sections were stained with Safranin O (Solarbio, Cambridge, Massachusetts, USA) and toluidine blue (Sigma-Aldrich, Poole, UK) to evaluate proteoglycan changes. As shown in Figure 1, the four bold lines divide the condylar cartilage into the anterior, central, and posterior thirds, and Case View 2.0 (3DHISTECH, Budapest, Hungary) was used to measure along the thin blue lines from the surface of the condylar cartilage to the interface of the subchondral bone in each section (Figure 1). The cartilage thickness in the central or posterior third was calculated as the mean length of the three thin blue lines in the corresponding thirds, and the total cartilage thickness was calculated as the mean values of the central and posterior thirds.19,20 The level of TMJ-OA severity was scored in accordance with the Osteoarthritis Research Society International (OARSI) evaluation system.21,22
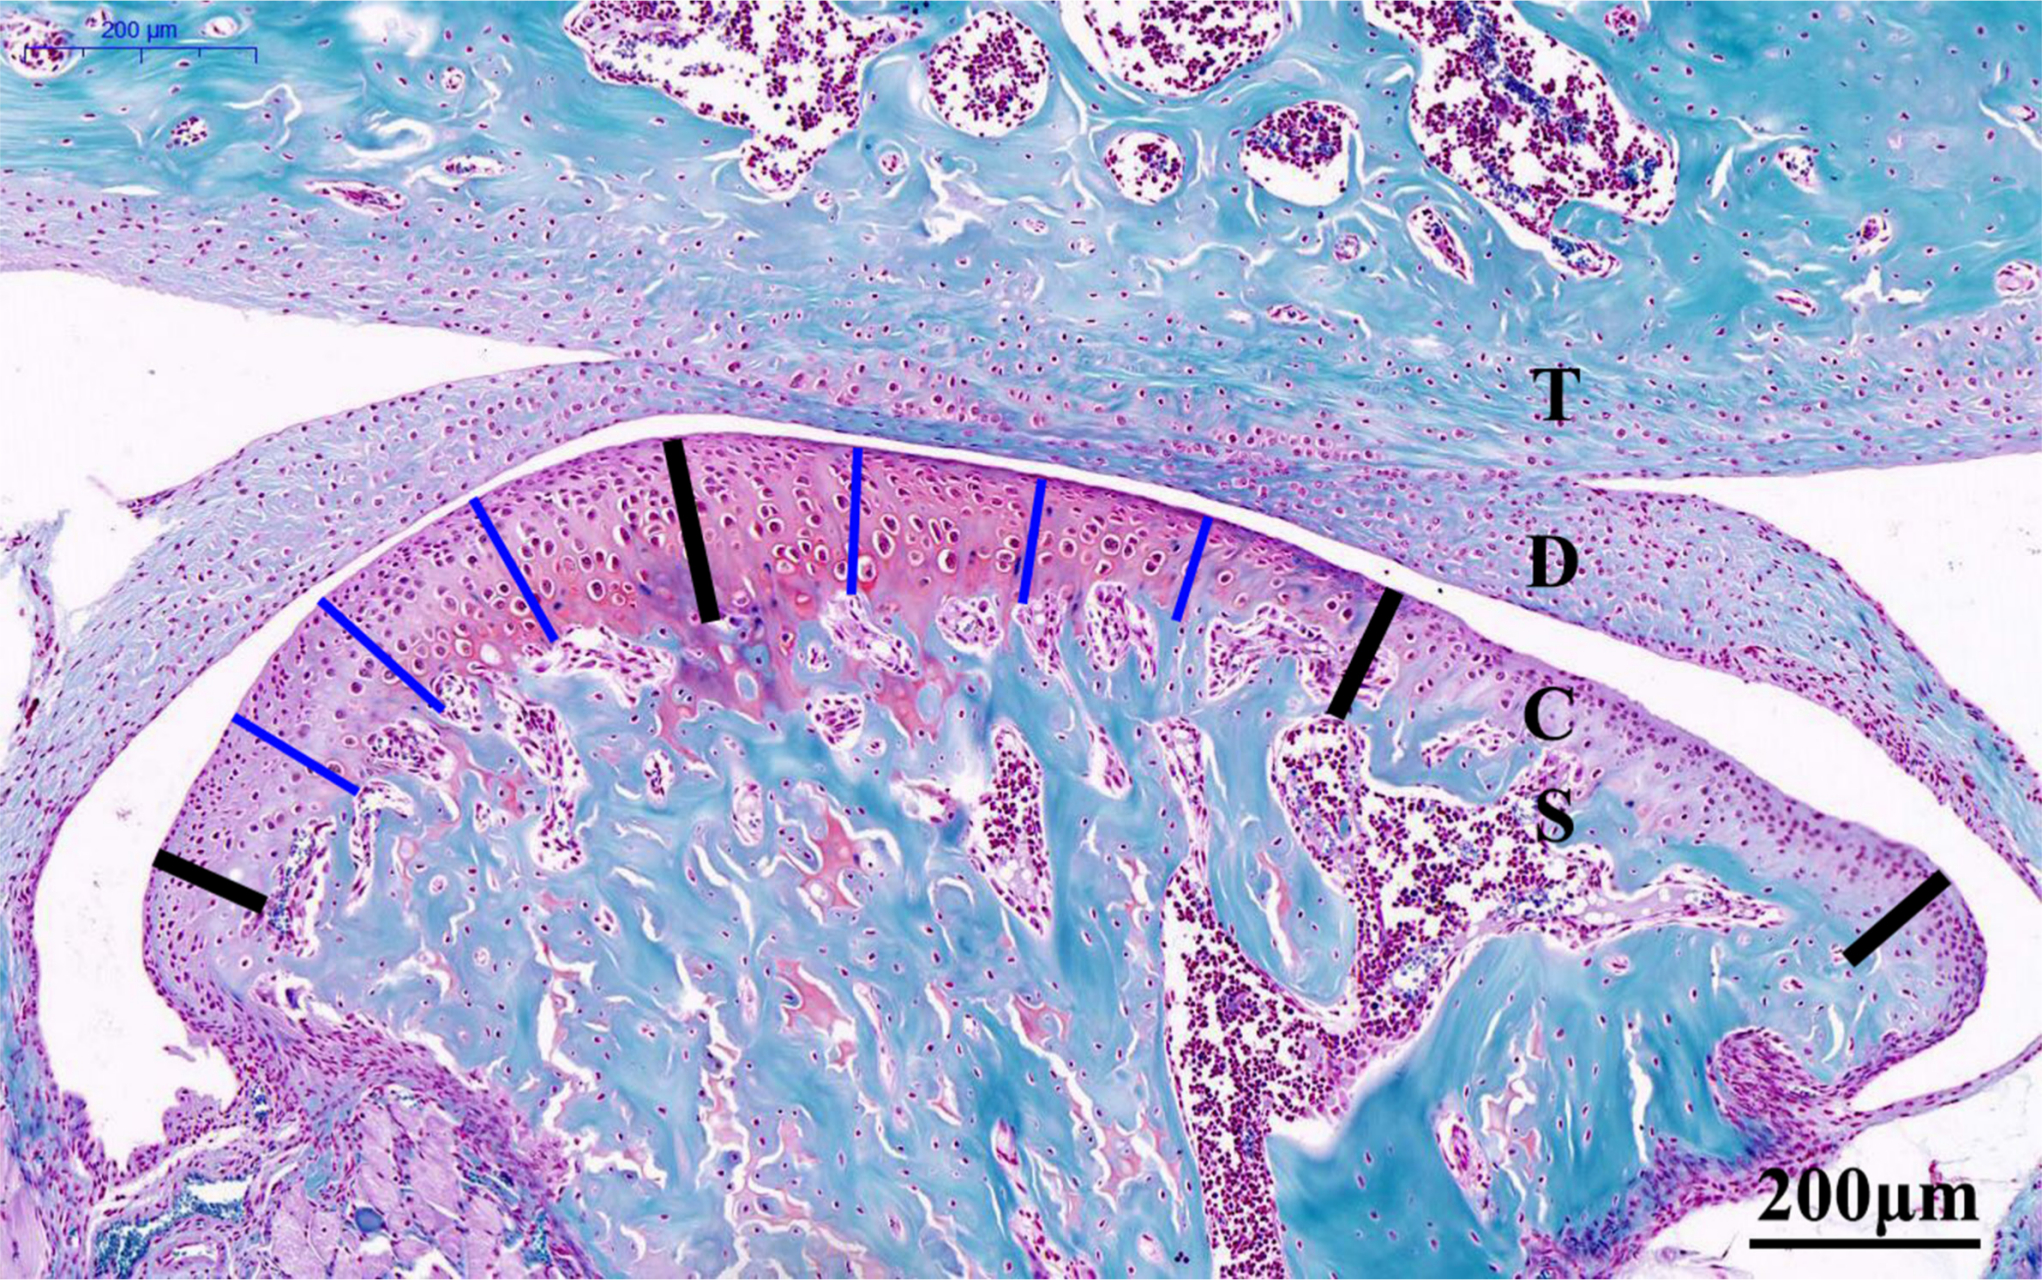
Fig. 1
Representative Safranin O-stained central sagittal sections (10× magnification) of the temporomandibular joint (TMJ) from six-week-old control mice (20×). The cartilage was divided into three regions, as denoted by the four bold black lines. The thickness of the central or posterior third of the cartilage was calculated as the mean length of the three thin blue lines in the corresponding thirds. The total cartilage thickness of the TMJ was calculated as the mean of the values for the central and posterior thirds. Scale bar: 200 mm. C, condylar cartilage; D, articular disc; S, subchondral bone; T: temporal bone.
For immunohistochemistry (IHC), after fixation in paraformaldehyde and deparaffinization, tissue sections (5 μm thick) were prepared. Tissue sections were incubated with anti-Col-II (Abcam, Cambridge, Massachusetts, USA) and anti-Gdf5 (Abcam) at 37°C overnight. Image-Pro Plus 6.0 software (Media Cybernetics, Silver Spring, Maryland, USA) was used to select areas with equal brown and yellow staining as a uniform standard for assessing positive results in all images. The integrated optical density (IOD) and the pixel area (AREA) of the tissue were measured for each image. Finally, the average optical density (AOD = IOD/AREA) values was determined.23
Quantitative real-time PCR
Total RNA was extracted from condylar cartilage of each specimen and cultured mandibular condylar chondrocytes (MCCs) using TRIzol Reagent (Invitrogen, Carlsbad, California, USA). For quantitative detection of microRNA (miRNA), a TaqMan miRNA assay kit (Thermo Fisher Scientific, Cambridge, Massachusetts, USA) was used. A 7500 Real-Time PCR system (Applied Biosystems, Foster City, California, USA) and SYBR Premix Ex Taq II Kit (TaKaRa, Otsu, Japan) were used to perform real-time quantification. The relevant primer sequences are listed in Table I. The threshold cycle (Ct) method was used to analyze the results; the relative mRNA expression levels were analyzed with the comparative 2−ΔΔCt method. β-actin (Beyotime Biotechnology, Shanghai, China), which served as the internal reference, was used for normalization.
Table I.
Primer sequence of related genes in the reverse transcription quantitative polymerase chain reaction.
| Gene | Forward | Reverse |
| MiR21 | 5’-CTTACTTCTCTGTGTGATTTCTGTG-3’ | 5’-ACAACCTTTCCAAAATCCATGAGGC-3’ |
| Gdf5 | 5’-TGACTTAGGACAGAGAAC-3’ | 5’-CCACACCATAGATATGAC-3’ |
| Col-II | 5’-CCTGGCAAAGCTGGTGAG-3’ | 5’-ACAGAGATGTAGCACCTT-3’ |
| Agg | 5’-CAGTAGTGCGGACATTAG-3’ | 5’-AGAGGACAGTTCATTAAGC-3’ |
| ADAMTS5 | 5’-CATAGAGAACACGCAGAG-3’ | 5’-CCAGCCAATACAGAACAT-3’ |
| MMP9 | 5’-ACTCACACGACATCTTCCA-3’ | 5’-CCACCTGGTTCACCTCAT-3’ |
| MMP13 | 5’- TCCCATCTATACCTACACT-3’ | 5’-GCCAGAAGAATCTGTCTTT-3’ |
| β-actin | 5’-GAAGATCAAGATCATTGCTCCT-3’ | 5’-TACTCCTGCTTGCTGATCCACA-3’ |
-
ADAMTS5, a disintegrin and metalloproteinase with thrombospondin motifs 5; Agg, aggrecan; Col-II, type II collagen; Gdf5, growth differentiation factor 5; MiR21, microRNA miR21-5p; MMP, matrix metalloproteinase.
Cell expansion and identification
MCCs were obtained from 20 mice aged between three and four weeks. Condylar cartilage was extracted from the mice, cut with microsurgical scissors into pieces of less than 1 mm3, and digested at 37°C with 3 mg/ml dispase (Sigma-Aldrich, Burlington, Massachusetts, USA) and 2.5 mg/ml collagenase type II in Dulbecco's Modified Eagle Medium (DMEM; Gibco, Waltham, Massachusetts, USA) for two hours with stirring done every 20 minutes. The MCC suspension obtained by centrifugation was cultured in a mixture of 79% DMEM, 20% fetal bovine serum (FBS; ScienCell, San Diego, California, USA), and 1% antibiotic solution containing penicillin and streptomycin (Gibco, Waltham, Massachusetts, USA) at 37°C in 5% CO2. MCCs were passaged by detachment with 0.25% trypsin (Gibco). The viable cells were observed under an optical microscope and validated by immunohistochemical staining for Col-II. The identification results are shown in Supplementary Figure b. MCCs were used for immunofluorescence (IF) studies, alcian blue staining, western blotting (WB), quantitative real-time PCR (RT-qPCR), dual luciferase reporter assay, and transfection experiments.
Target prediction and luciferase reporter assay
MiRanda24 was used to predict the target relationship between MiR21 and Gdf5. A dual luciferase reporter assay was cused to further verify this target relationship. The linker fragment containing the Gdf5 WT or mutant type sequence was synthesized and cloned into the PsiCHECK-2 plasmid (Promega, Shanghai, China). The PsiCHECK-2-Gdf5-3’UTR construct was synthesized by Sangon Biotech company (Shanghai, China). Luciferase activity was detected 48 hours after MCC transfection according to the instructions of the dual luciferase assay.
Cell transfection and treatment with interleukin-6
The MiR21 overexpression construct (mimic-21), anti-MiR21 construct (inhibitor-21), Gdf5 siRNA (Si-Gdf5), flag-Gdf5, and their corresponding negative control constructs were purchased from Genepharma (Shanghai, China), and the GV141-Gdf5 plasmid was synthesized by GENE Company (Shanghai, China) (Supplementary Figure c and Supplementary Table i). Cells were seeded in six-well plates at 106 cells/well. Transfection via Lipofectamine 2000 (Thermo Fisher Scientific) and stimulation with IL-6 (Peprotech, Rocky Hill, New Jersey, USA) were performed when the cultured MCCs had grown to a confluence of between 70% and 75%. After six to eight hours of transfection, cells were cultured in the reduced serum media for 40 to 42 hours. Then, 10 ng/ml IL-6 was used to stimulate cells for six hours after all transfections. After transfection or IL-6 treatment, RNA and protein were extracted from MCCs for western blot and PCR analyses.
Immunofluorescence and alcian blue staining of cells
For IF staining, MCCs were incubated with rabbit anti-Gdf5 (1:200; Abcam) and rabbit anti-Col-II (1:200; Abcam) at 4°C overnight and then with a fluoresceine isothiocyanate (FITC)-labelled goat rabbit anti-immunoglobulin G (IgG) (Beyotime Biotechnology, Shanghai, China) secondary antibody for one hour at 37°C. Fluorescence was analyzed with a confocal scanning microscope system (Carl Zeiss, Beijing, China). We used Image-Pro Plus 6.0 software to determine the integrated fluorescence density (ID) and AREA in each image and calculated the fluorescence intensity (FI = ID/AREA) values of the Gdf5 and Col-II.
For alcian blue staining (Solabio, Beijing, China), MCCs were fixed with 4% buffered paraformaldehyde (Servicebio, Wuhan, China) for five minutes and washed with Dulbecco's phosphate-buffered saline (DPBS). Cells were then stained in toluidine blue solution for 30 minutes at 37°C, and this procedure was repeated for 30 to 60 seconds after washing with DPBS for three minutes. Alcian blue staining was used to determine changes in the proteoglycans in the ECM of MCCs. Staining was observed by microscopy and quantified. The IOD and AREA of the tissue were measured in each image via Image-Pro Plus 6.0 software. Finally, the mean AOD = IOD/AREA was calculated.25
Western blotting
Total protein from MCCs and condylar cartilage was extracted with radioimmunoprecipitation assay (RIPA) lysis buffer purchased from Beyotime Biotechnology. A bicinchoninic acid (BCA) protein assay kit (Thermo Fisher Scientific) was used to measure the concentration of the extracted protein. Membranes were incubated with anti-ADAMTS5 (Abcam), anti-Gdf5 (Abcam), anti-MMP-9 (Abcam), anti-MMP-13 (Abcam), anti-Col II (Abcam), and anti-Agg (Abcam) for 12 hours at 4°C. An anti-rabbit IgG (Abcam) secondary antibody at a concentration of 1:5,000 was then fully bound to the polyvinylidene difluoride membrane at 37°C for 1.5 hours. The blots were developed using an enhanced chemiluminescence WB kit (BeyoECL Plus, Beyotime Biotechnology), visualized with an Immobilon Western Chemiluminescent HRP Substrate Kit (MilliporeSigma, St. Louis, Missouri, USA), and quantitatively evaluated with ImageJ (Bethesda, Maryland, USA) software.
Statistical analysis
GraphPad Prism 6 (GraphPad Software, San Diego, California, USA) software was used for data analysis. The data are reported as the mean ± standard error of the mean (SEM), and all experiments were performed in triplicate. Analysis of variance (ANOVA) or Mann–Whitney U test were utilized to identify significant differences, which were accepted when the p-value was less than 0.05.
Results
Knockout of MiR21 ameliorates pathological alterations in UAC-induced TMJ-OA
The histological results in Figure 2 show that the OARSI score was significantly higher and the cartilage thickness was significantly lower in the WT-OA group than in the WT-NC group, while these changes were not as prominent in the KO-OA group. In addition, the OARSI score was significantly lower and the cartilage thickness was significantly higher in the KO-OA group than in the WT-OA group, but did not differ significantly between the WT-NC group and the KO-NC group (Figure 2).
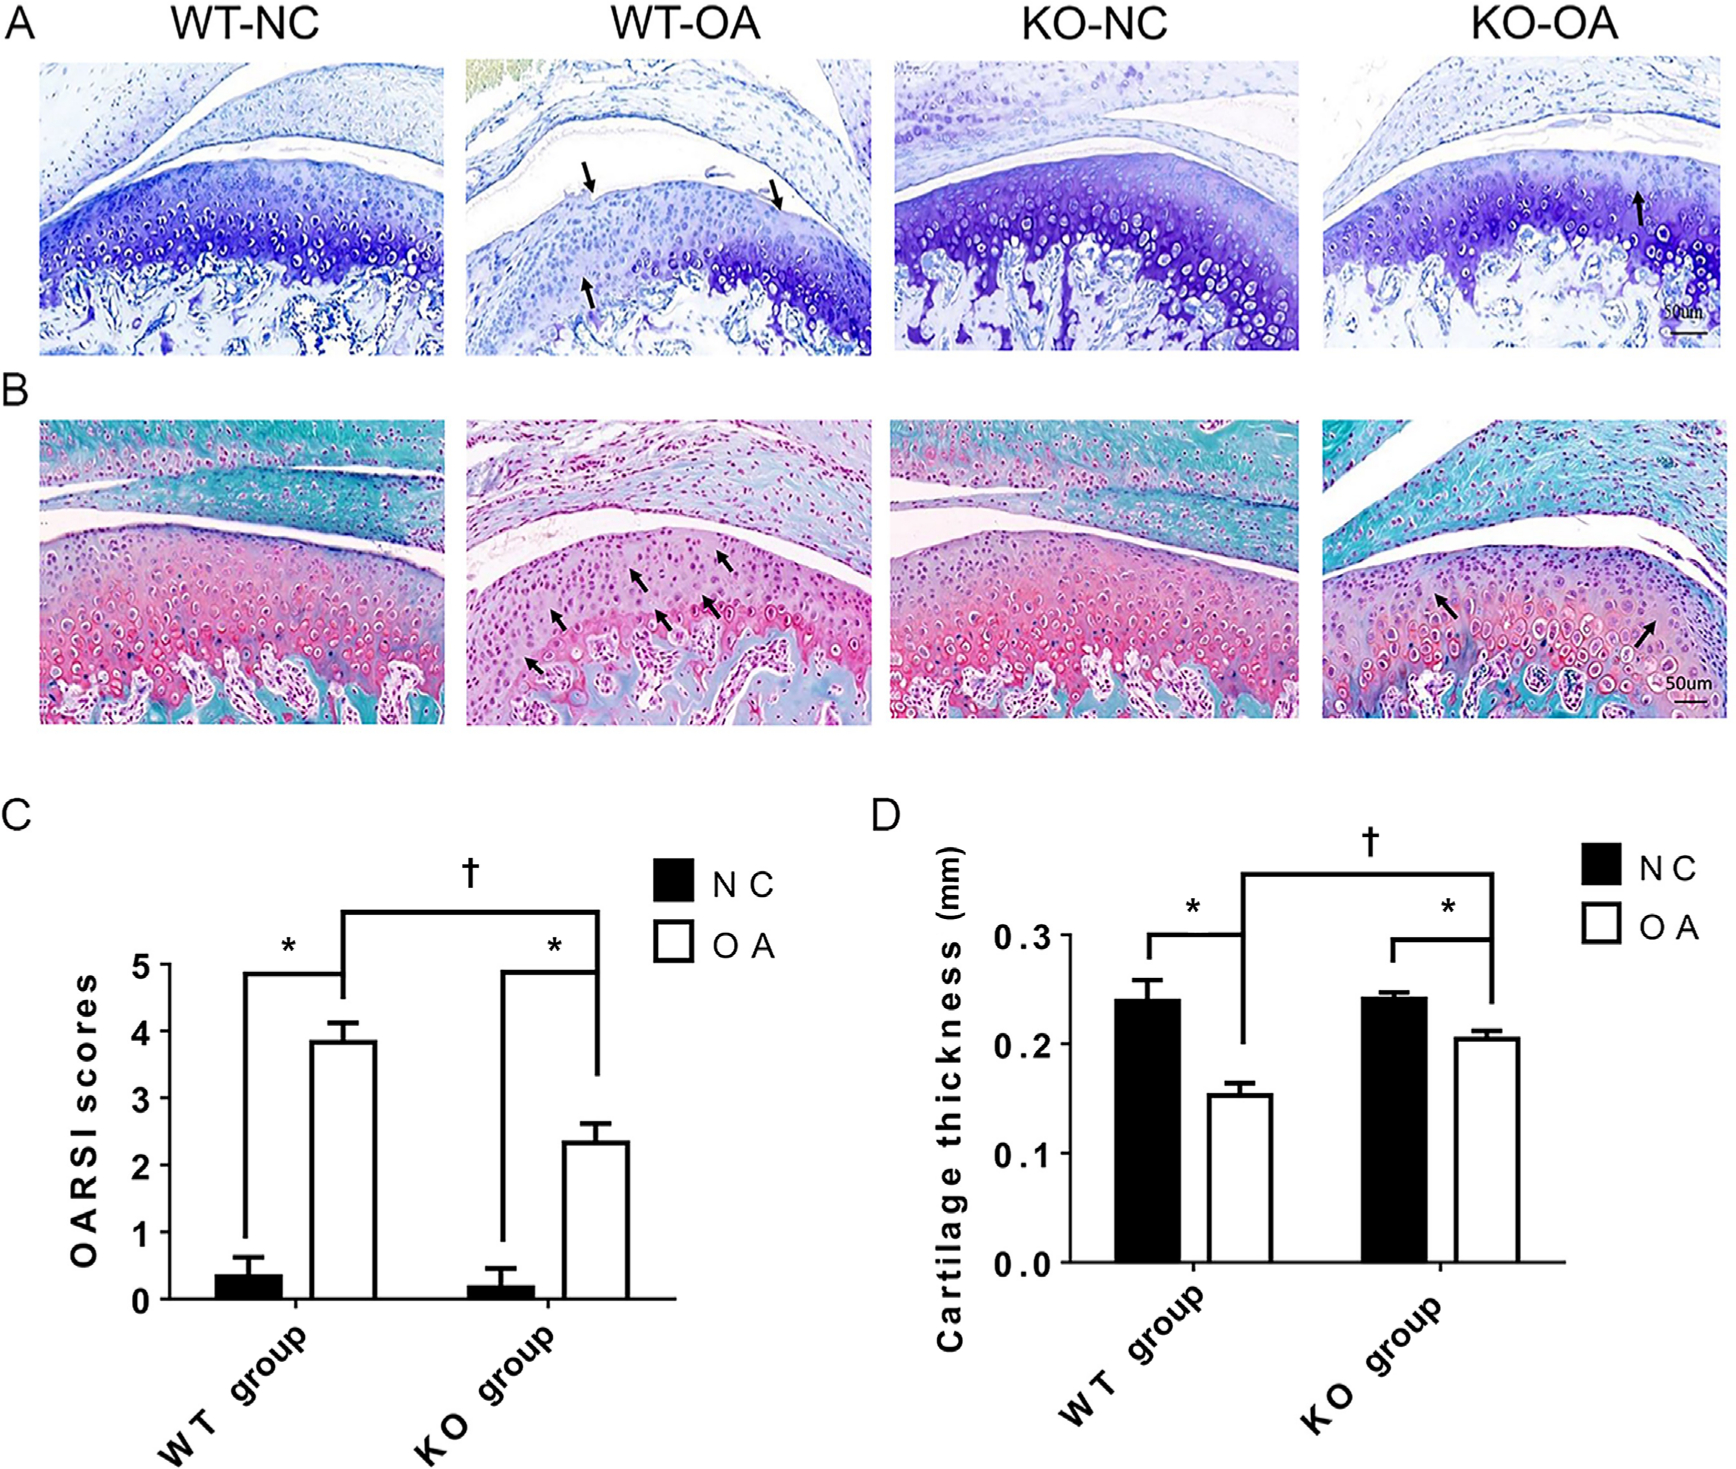
Fig. 2
Histological changes observed and measured after osteoarthritis (OA) treatment and the microRNA miR21-5p (MiR21) knockout. a) and b) Representative images (magnification: 30×) of toluidine blue and Safranin O staining of cartilage from knockout (KO) and wild-type (WT) mice with or without unilateral anterior crossbite (UAC)-induced OA. The arrows indicate areas of degraded cartilage, manifested by local loss of proteoglycans and cell reduction or cell loss. c) Osteoarthritis Research Society International (OARSI) scores in the KO-NC, WT-NC, WT-OA, and KO-OA groups. d) The mean of cartilage thickness in the respective groups. The data are represented as the means ± standard error of the mean (SEM) (n = 10 mice per group). Two-way analysis of variance (ANOVA) corrected with the Bonferroni correction was used to identify significant differences in multiple comparisons. The asterisk (*) and dagger (†) symbols indicate p-values of 0.05. *Comparing between NC and OA groups; †comparing between WT-OA and KO-OA groups. Scale bar: 50 μm. NC, control.
The immunohistochemical results in Figure 3 show that the AODs of Col-II and Gdf5 staining in the KO-OA group were significantly higher than those in the WT-OA group. In addition, the AOD of Gdf5 in the KO-NC group was significantly higher than that in the WT-NC group, while the AOD of Col-II in the KO-NC group was slightly higher than that in the WT-NC group.
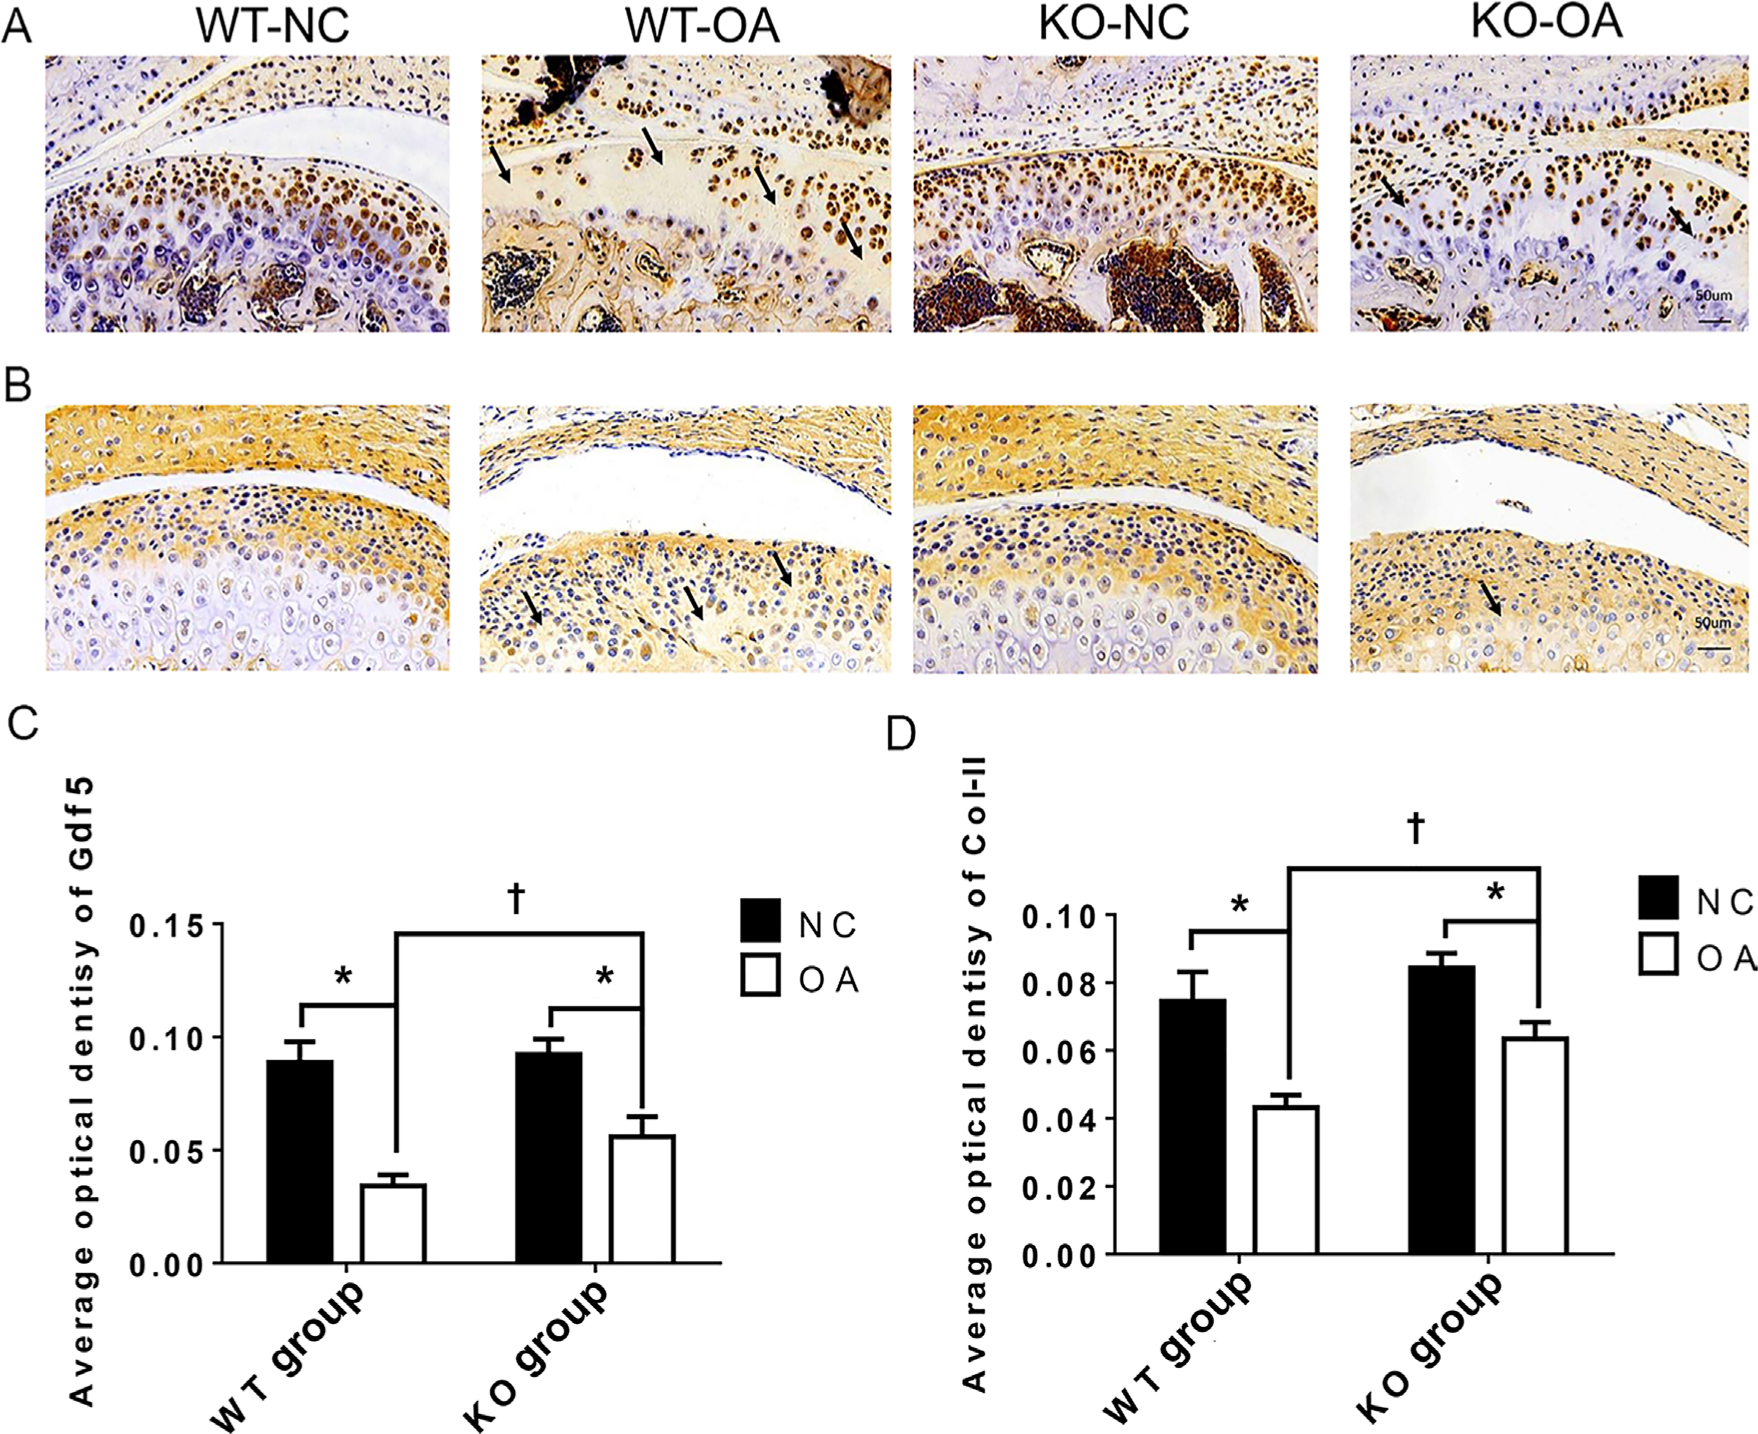
Fig. 3
Immunohistochemistry (IHC) changes assessed after osteoarthritis (OA) treatment and the microRNA miR21-5p (MiR21) knockout (KO). a) and b) Representative sections (magnification: 30×) of IHC staining for a) growth differentiation factor 5 (Gdf5) and b) type II collagen (Col-II) in cartilage from wild-type (WT) and KO mice with or without OA induced by unilateral anterior crossbite (UAC). The arrows indicate areas of degraded cartilage, manifested by local loss of Gdf5 and Col-II. c) and d) Average optical density (AOD) of Gdf5 and Col-II protein expression in cartilage. The data are represented as the means ± standard error of the mean (SEM) (n = 10 mice per group). Two-way analysis of variance (ANOVA) corrected with the Bonferroni correction was used to identify significant differences in multiple comparisons. Asterisk (*) and dagger (†) symbols represent p-values < 0.05. *Comparing between NC and OA groups; †comparing between WT-OA and KO-OA groups. Scale bar: 50 μm. NC, control.
The western blot and RT-PCR results in Figure 4a show that the expression levels of Col-II, Gdf5, and Agg were significantly higher in the KO-OA group than in the WT-OA group, while those of ADAMTS5, MMP9, and MMP13 showed the opposite trend. In addition, the results of WB indicate that the protein expression levels of the above mentioned molecules except Gdf5 and MMP13 did not differ significantly between the WT-NC and KO-NC groups, whereas the results of RT-qPCR showed significant differences in the mRNA expression levels of all these molecules (Figure 4b).
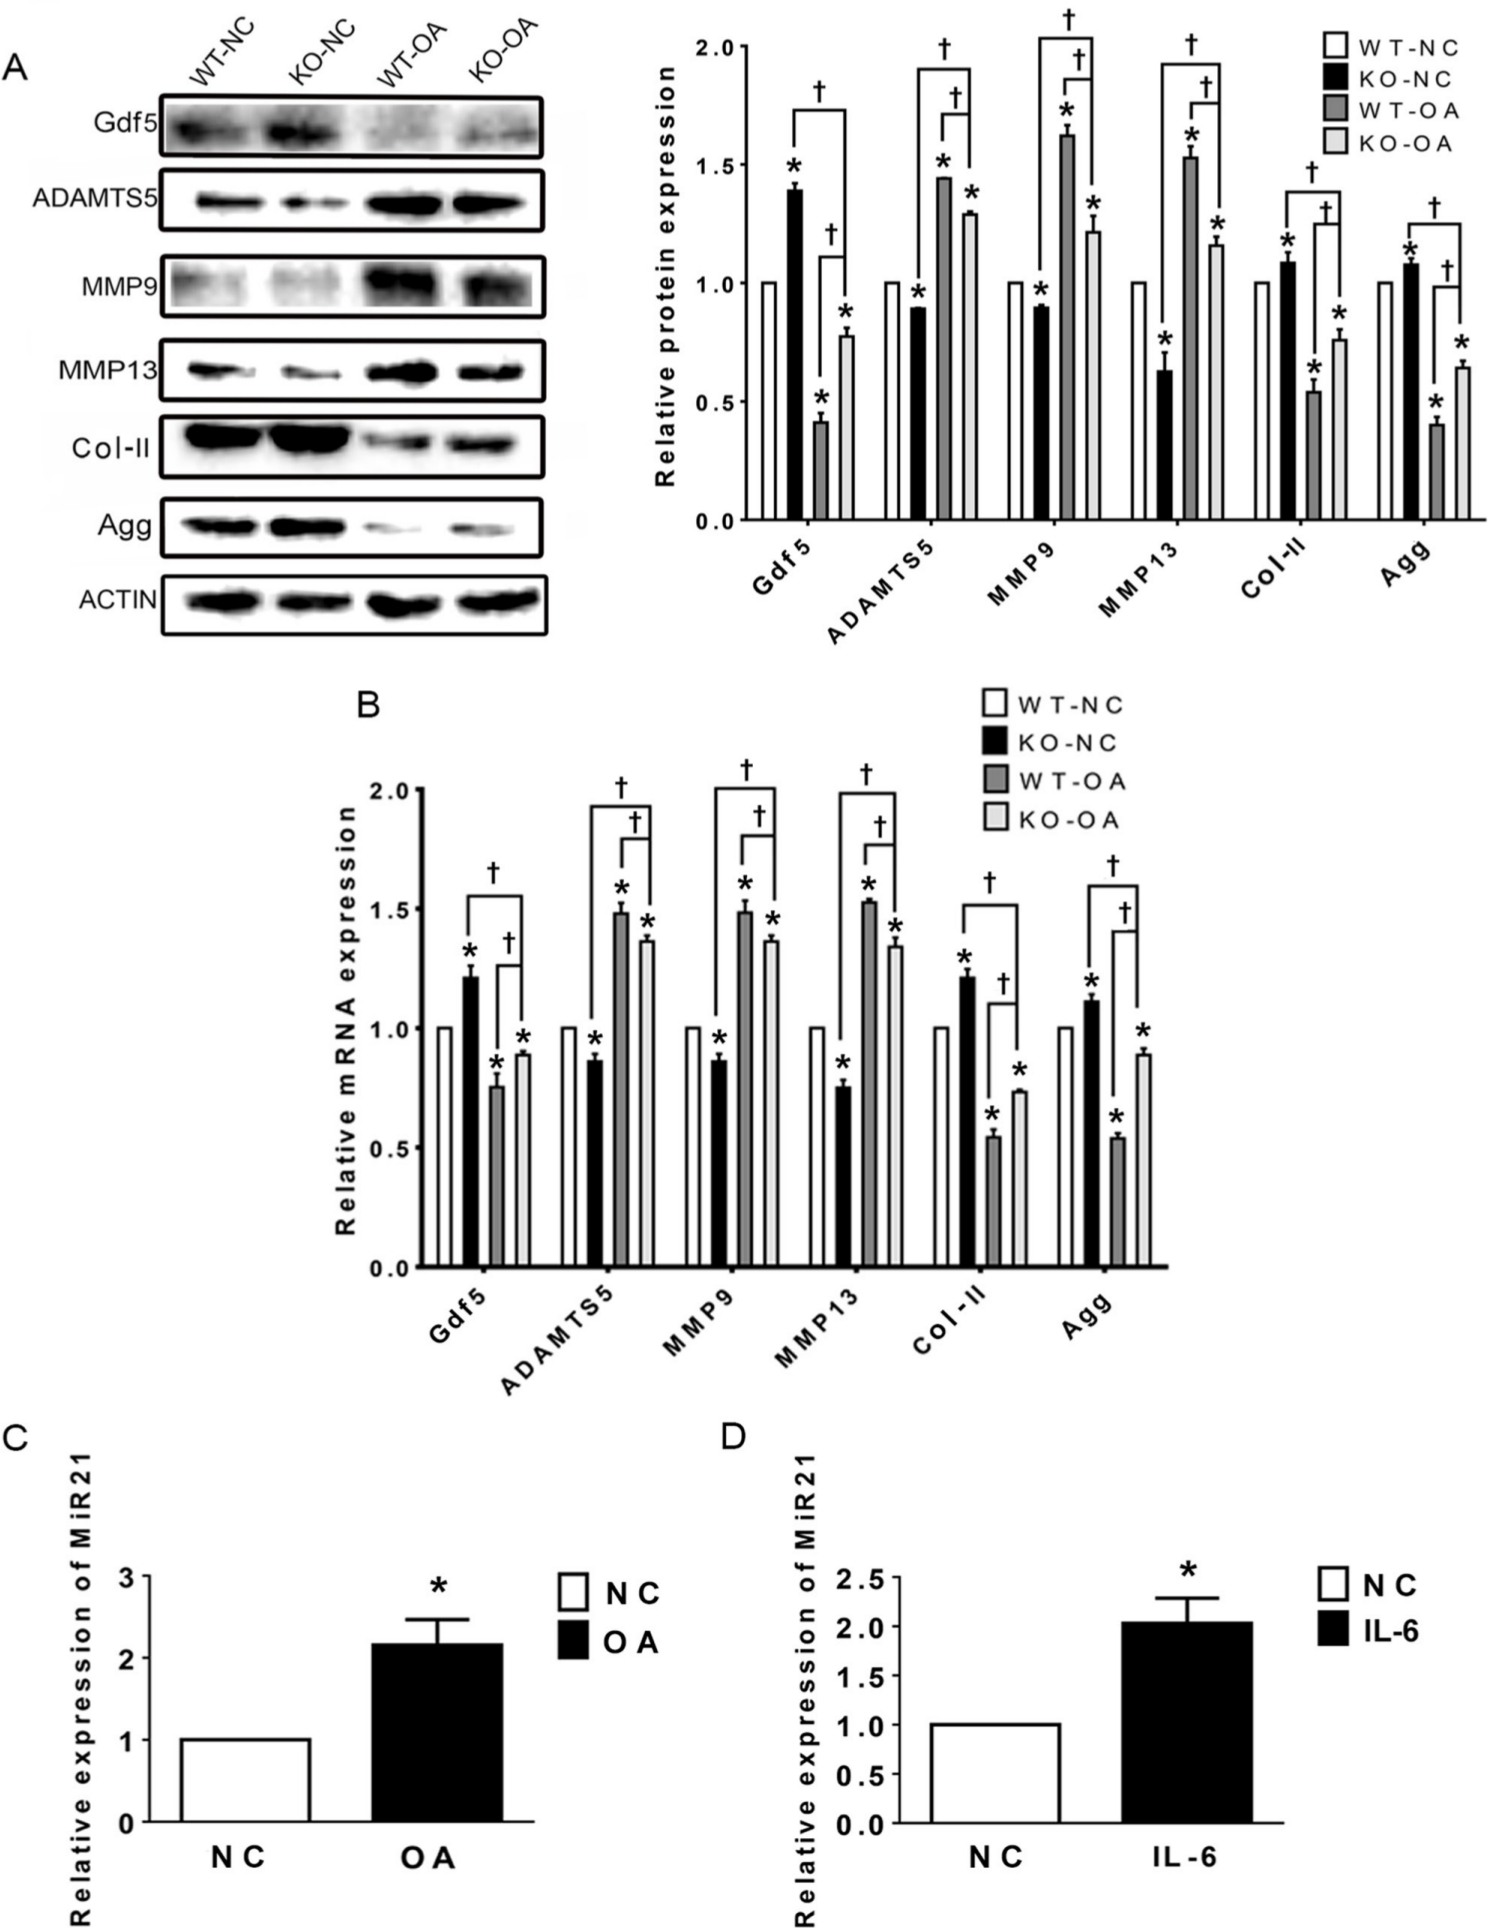
Fig. 4
Relative expression levels of the microRNA miR21-5p (MiR21), growth differentiation factor 5 (Gdf5), and related osteoarthritis (OA) molecules in temporomandibular joint (TMJ) cartilage after OA treatment and MiR21 knockout (KO), as assessed by western blotting and quantitative real-time polymerase chain reaction (RT-qPCR). a) Western blot and b) RT-qPCR results of Gdf5, a disintegrin and metalloproteinase with thrombospondin motifs 5 (ADAMTS5), matrix metalloproteinase 9 (MMP9) and MMP13, type II collagen (Col-II), and aggrecan (Agg) protein and messenger RNA (mRNA) expression in cartilage. c) and d) RT-qPCR results of MiR21 mRNA expression in cartilage of temporomandibular joint osteoarthritis (TMJ-OA) induced by c) unilateral anterior crossbite (UAC) and d) in mandibular condylar chondrocytes (MCCs) stimulated by interleukin-6 (IL-6). The data are represented as the means ± standard error of the mean (SEM) (n = 10 mice per group). Two-way analysis of variance (ANOVA) with the Bonferroni correction was used to identify significant differences between two groups. The asterisk (*) and dagger (†) symbols indicate p-values < 0.05. *Comparing between NC and other groups; †comparing between KO-OA group and WT-OA or KO-NC group. NC, control.
In addition, the RT-qPCR results showed that the expression of MiR21 was significantly increased in the WT-OA group compared with that in the WT-NC group (Figure 4c). The above results indicate that knockout of MiR21 suppresses these molecules related to TMJ inflammation.
IL-6 regulates MiR21 and TMJ-OA-related molecules in MCCs
MiR21 expression increased significantly under IL-6 stimulation (Figure 4d), consistent with the results of the animal study (Figure 4c) and confirming the effects of IL-6 on OA pathogenesis. Compared to their normal counterparts, MCCs treated with IL-6 demonstrated a dramatic decrease in Gdf5, Col-II, and Agg expression and a considerable increase in ADAMTS5, MMP9, and MMP13 expression (Figures 5a and 5b). These results indicate that IL-6 induces the degradation of ECM of the MCCs, which mimics the environment of UAC-induced TMJ-OA.
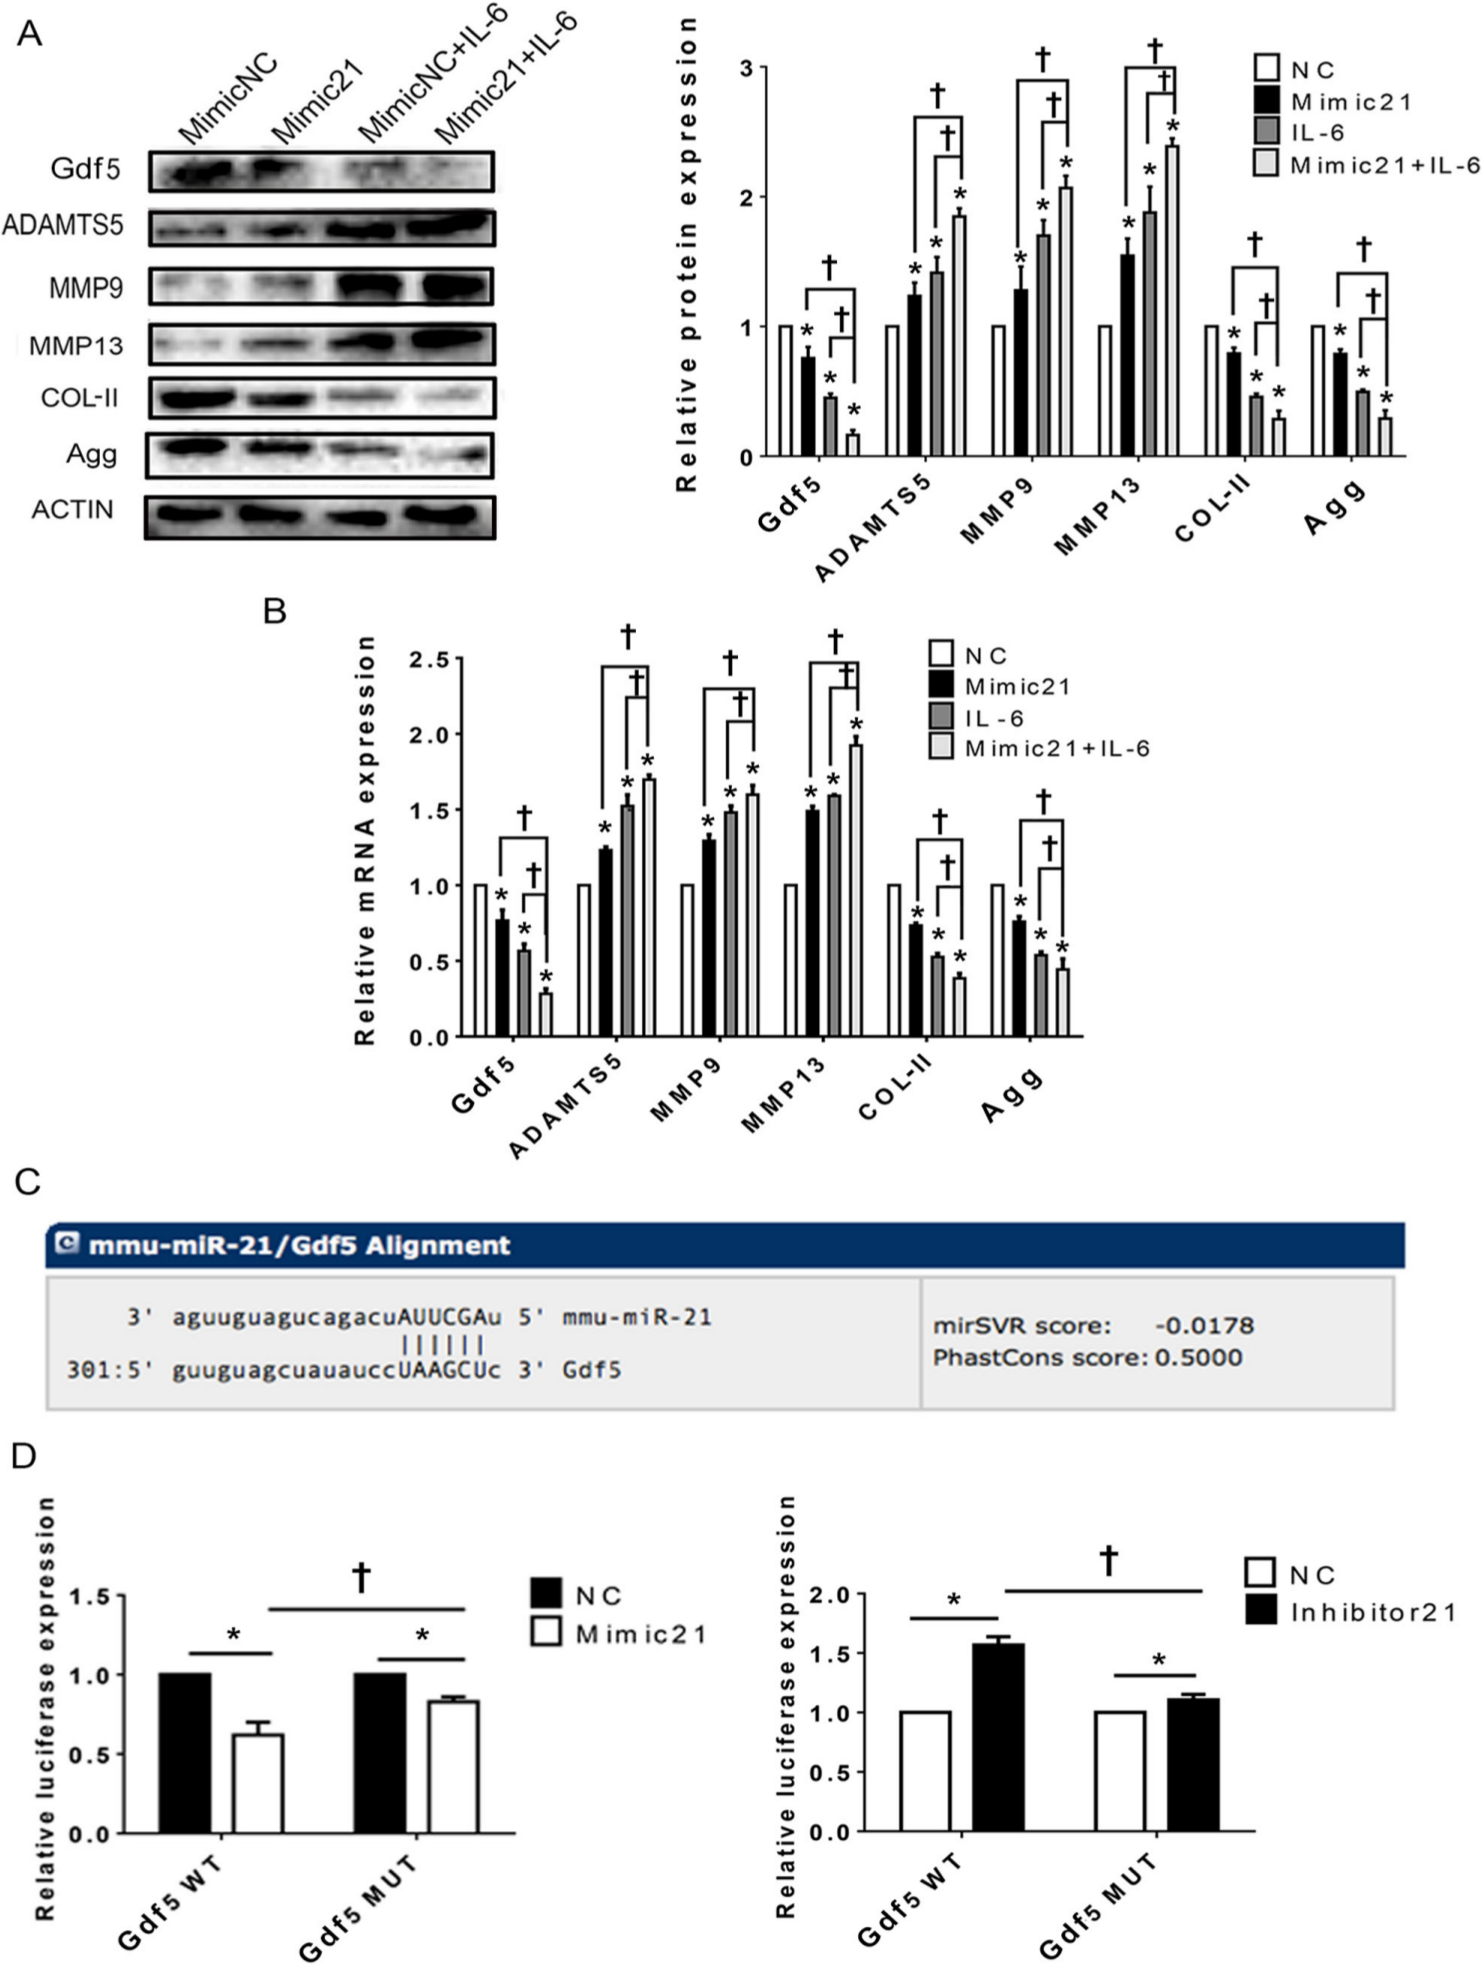
Fig. 5
Upregulation of the microRNA miR21-5p (MiR21) influences temporomandibular joint osteoarthritis (TMJ-OA)-related molecules in mandibular condylar chondrocytes (MCCs) via targeting of growth differentiation factor 5 (Gdf5). a) and b) Western blot and quantitative real-time polymerase chain reaction (RT-qPCR) results for Gdf5, type II collagen (Col-II), aggrecan (Agg), a disintegrin and metalloproteinase with thrombospondin motifs 5 (ADAMTS5), matrix metalloproteinase 9 (MMP9) and MMP13 protein, and mRNA expression in MCCs transfected with mimic-21 or mimic-NC and stimulated or not stimulated with interleukin-6 (IL-6). c) Predicted sites of MiR21 binding to Gdf5. d) Dual-luciferase reporter assay results showing the comparison of wild-type (WT) and mutant-type Gdf5 reporter sequences based on control reporter activity in cells transfected with mimic-21 or inhibitor -21. The data are presented as the means ± SDs (n = 3). Two-way analysis of variance (ANOVA) with the Bonferroni correction was used to identify significant differences in multiple comparisons. The asterisk (*) and dagger (†) symbols indicate p-values < 0.05. *Comparing between NC and other groups; †comparing between Mimic 21+IL-6 group and Mimic 21 or IL-6 group. NC, control.
Upregulation of MiR21 influences TMJ-OA-related molecules in MCCs via targeting of Gdf5
The protein and mRNA expression analysis results (Figures 5a and 5b) show that after upregulation of MiR21 in chondrocytes, the expression of Gdf5, Agg, and Col-II was significantly downregulated, whereas that of ADAMTS5, MMP9, and MMP13 was significantly upregulated. Similar trends were observed in cells co-treated with mimic-21 and IL-6. MiRanda24 was used to confirm the theoretical target genes of MiR21, and Gdf5 was predicted to be a target of MiR21 (Figure 5c). Through quantitative dual luciferase activity assays (Figure 5d), we validated the target relationship between MiR21 and Gdf5.
In addition, the IF staining results (Figures 6a and 6b) show that the FI values of both Gdf5 and Col-II were significantly lower in the mimic-21 and mimic-21+IL-6 groups than in the NC and IL-6+NC groups, respectively, while the inhibitor-21 and IL-6+inhibitor-21 groups exhibited the opposite pattern.
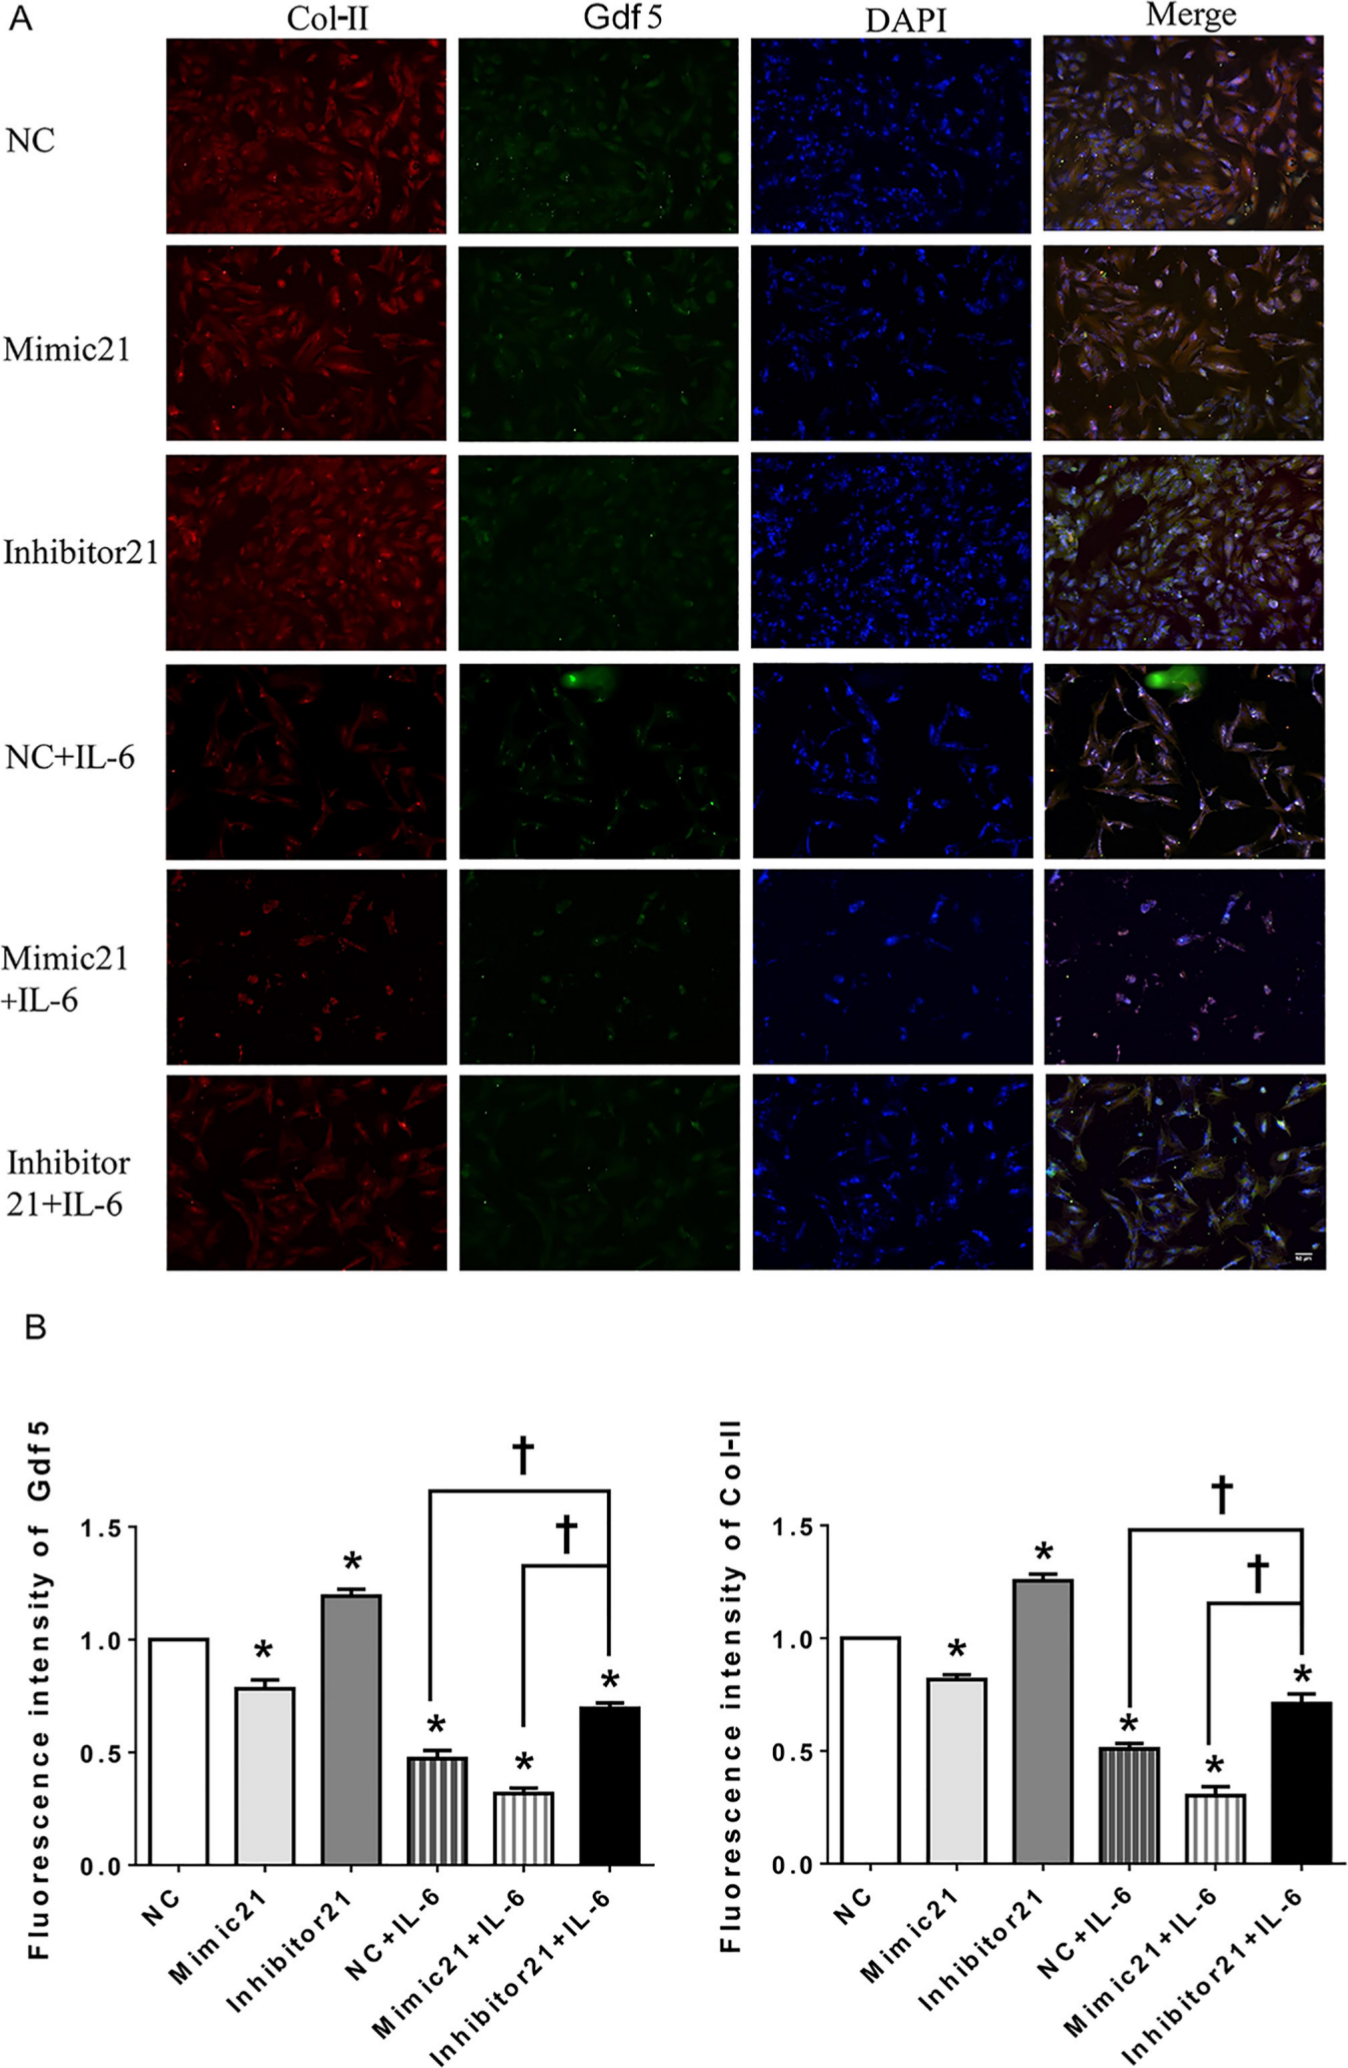
Fig. 6
Immunofluorescence (IF) in mandibular condylar chondrocytes (MCCs) after upregulation or downregulation of the microRNA miR21-5p (MiR21) under interleukin-6 (IL-6). Image magnification: 100×. a) Observation of type II collagen (Col-II) (red), growth differentiation factor 5 (Gdf5) (green), and nuclear DAPI (blue) staining in MCCs transfected with mimic-21 or inhibitor-21 and with or without IL-6 stimulation. b) Fluorescence intensity analysis of Gdf5 and Col-II expression in MCCs. The data are presented as the means ± SDs (n = 3). Two-way analysis of variance (ANOVA) with the Bonferroni correction was used to identify significant differences in multiple comparisons. The asterisk (*) and dagger (†) symbols indicate p-values < 0.05. *Comparing between NC and other groups; †comparing between inhibitor 21+IL-6 group and NC+IL-6 or Mimic 21+IL-6 group. NC, control.
Stimulation of Gdf5 expression decreases the expression of MMP13 and reverses MiR21-induced upregulation of MMP13
Since MMP13 was shown in the above experiments to have high signalling sensitivity, we selected it as the effector gene. A significant upward trend in MMP13 expression was observed when cells were transfected with si-Gdf5 and treated or not treated with IL-6 (Figure 7a). In addition, exogenous Gdf5 expression led to a marked decrease in MMP13 expression under IL-6 stimulation (Figure 7b), while the difference between the groups not treated with IL-6 was non-significant.
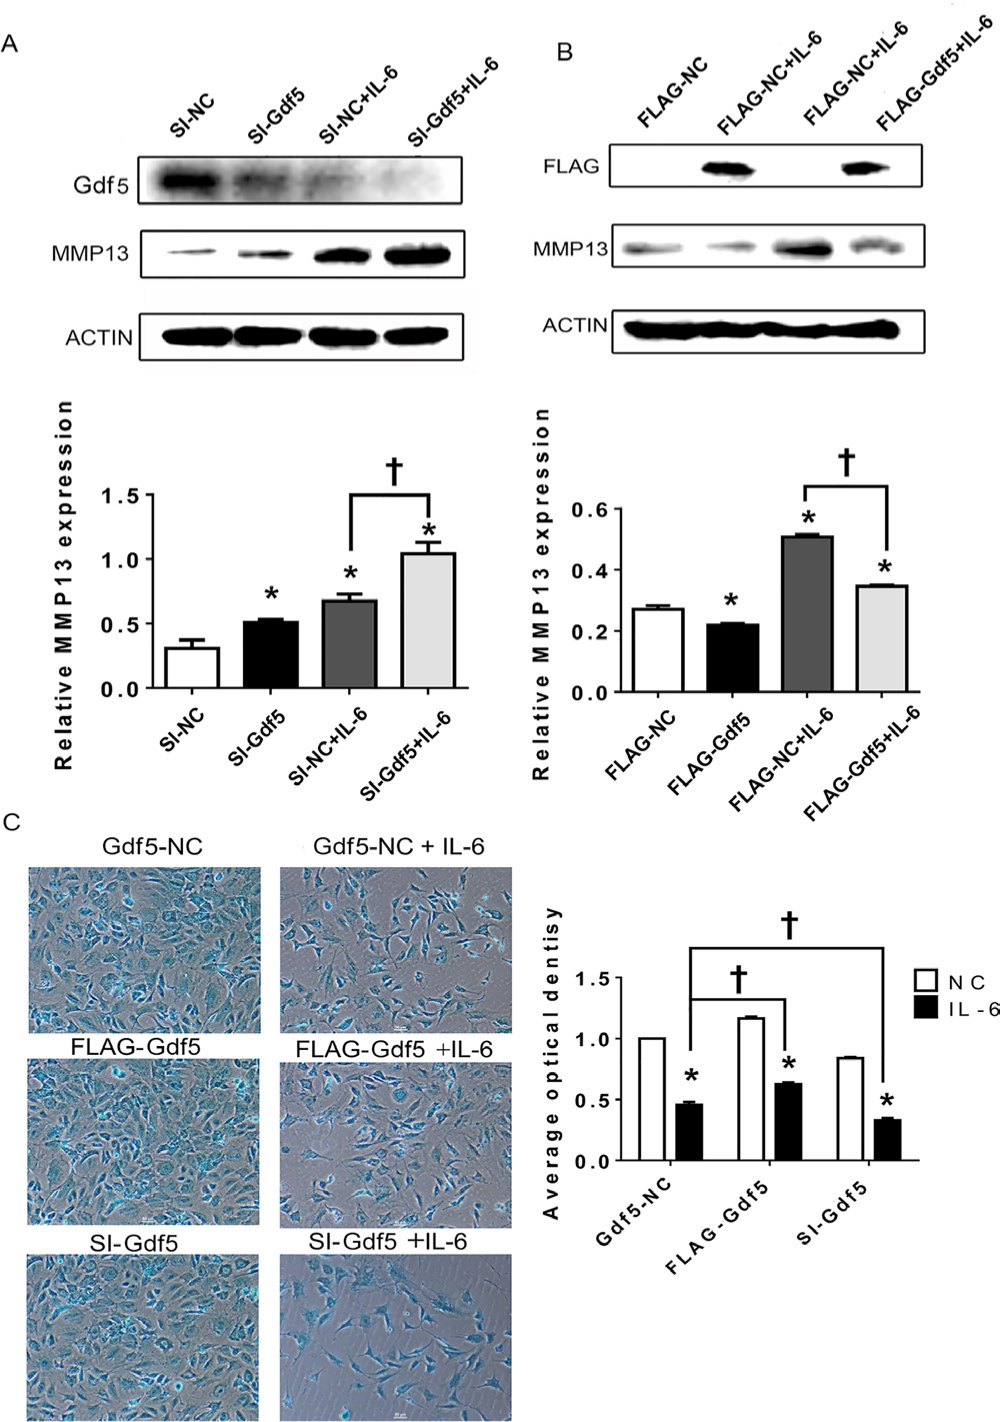
Fig. 7
Growth differentiation factor 5 (Gdf5) stimulation decreases matrix metalloproteinase 13 (MMP13) expression and extracellular matrix (ECM) production by mandibular condylar chondrocytes (MCCs). a) and b) Protein levels of MMP13 in chondrocytes transfected with Gdf5 siRNA (si-Gdf5) or flag-Gdf5 and their corresponding negative control constructs with or without interleukin-6 (IL-6) stimulation. c) Images (magnification: 100×) of alcian blue staining and calculation of the corresponding average optical density (AOD) values in MCCs transfected with si-Gdf5 or flag-Gdf5 with or without IL-6 stimulation. The data are presented as the means ± SDs (n = 3). One-way analysis of variance (ANOVA) with Tukey’s post hoc test was used to identify significant differences in multiple comparisons. The asterisk (*) and dagger symbols (†) indicate p-values of < 0.05. *Comparing between NC and other groups; †comparing between Gdf5-NC (SI-NC or FLAG-NC)+IL-6 group and FLAG-Gdf5+IL-6 or SI-Gdf5+IL-6 group. NC, control.
The results of alcian blue staining showed that the AOD of the IL-6-treated group was lower than that of the untreated group. In addition, the matrix staining in MCCs transfected with si-Gdf5 and stimulated with IL-6 was significantly decreased compared with that in negative control cells (Figure 7c), while Gdf5 overexpression increased matrix staining (Figure 7c), especially under IL-6 stimulation.
A further study was performed in which MCCs were transfected with both mimic-21 and flag-Gdf5 under IL-6 stimulation. Although the expression of MMP13 was upregulated by mimic-21, upregulation of MMP13 induced by the MiR21-mimic was attenuated by overexpression of Gdf5 (Figure 8), indicating that Gdf5 participates in matrix degradation and mitigates the function of MiR21 to alleviate degradation.
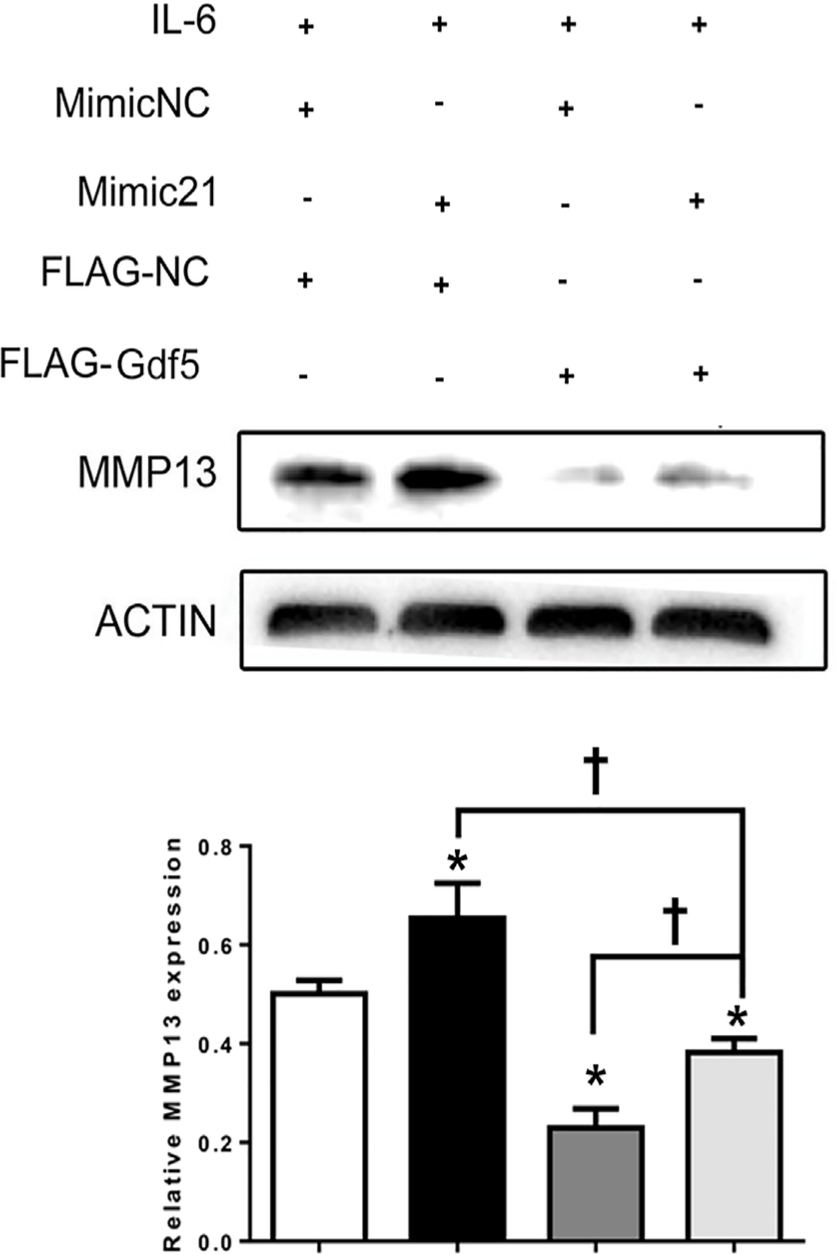
Fig. 8
Growth differentiation factor 5 (Gdf5) reverses the microRNA miR21-5p (MiR21)-induced upregulation of matrix metalloproteinase 13 (MMP13). Mandibular condylar chondrocytes (MCCs) were transfected first with mimic-21 or control vector and then with flag-Gdf5 or flag-control to evaluate changes in MMP13 expression under induction by interleukin-6 (IL-6). The data are presented as the means ± SDs (n = 3). One-way analysis of variance (ANOVA) with Tukey’s post hoc test was used to identify significant differences in multiple comparisons. The asterisk (*) and dagger (†) symbols indicate p-values < 0.05. *Comparing between NC and other groups; †comparing between Mimic 21+Flag-Gdf5+IL-6 and Flag-Gdf5+IL-6 or Mimic 21+IL-6 group. NC, control.
Discussion
Currently, research on the mechanisms by which miRNAs regulate OA development focuses mainly on large joints, such as the limb, knee, and hip joints, and research on the mechanism in TMJ-OA is scarce. The TMJ is a unique linkage joint that differs from other joints in anatomy and structure;26 thus, research on this joint is potentially valuable.
MiRNAs, short noncoding RNAs containing approximately 22 nucleotides, participate in cellular processes via post-transcriptional regulation. MiRNAs have been verified to be associated with multiple pathologies, such as cancers, cardiovascular diseases, and OA.27–29 Results from Zhang et al7 showed that overexpression of MiR21 in knee OA patients suppressed chondrogenesis. The current understanding of miRNAs indicates that they mainly affect post-transcriptional level30 and that they can degrade their target mRNAs.31,32 In the present study, we found significant changes in the mRNA and protein expression levels of related genes after either upregulation or knockout of MiR21 (Figures 4 and 5). Therefore, we believe that the mRNA level is altered possibly because MiR21 binds with its target mRNA to form a complex; the mRNA is subsequently degraded, resulting in a reduction in its level.33 However this process is still a post-transcriptional process.
The present study demonstrates that as with mimic-21 alone, the combination of mimic-21 and IL-6 reduced Gdf5 expression, but the change was more significant ( Figures 5a and 5b), suggesting that MiR21 acts as a negative upstream regulator of Gdf5 and is positively regulated by IL-6 in the catabolism process of chondrocyte ECM catabolism. Furthermore, IL-6 is thought to play a dual role, exerting anti-inflammatory effects during the acute response.34 The effects of treatment with cytokines at different concentrations and for different durations on the expression of Gdf5 and MMP need to be further clarified. In addition, we selected IL-6 to simulate TMJ-OA for the following three reasons: Zhao et al35 confirmed high expression levels of IL-6 expression in the TMJ-OA induced by UAC model. Thus, we used IL-6 to simulate the TMJ-OA environment; the effect of IL-6 on joint cartilage is similar to that of IL-1β and tumour necrosis factor alpha (TNFα), which causes a decrease in the production of Col-II and an increase in the production of MMP enzymes.36 One study has suggested that IL-6 can cause OA through angiogenesis by increasing the expression of vascular endothelial growth factor (VEGF),35 which will be investigated in our further research.
The association between chondrocytes and the ECM attracted our attention. MCCs secrete cell matrix components and are involved in regulating many biological processes that are highly important for the homeostasis of the matrix environment and repair of articular cartilage via ECM attachment.37 A decrease in matrix synthesis and the mobilization of catabolic enzymes causes the reductions in the levels of ECM components and even influences the progression of OA. Among these enzymes, MMP13 and ADAMTS5 play a unique role because they exhibit a strong capacity for matrix degradation. In the current study, we first confirmed that knockout of MiR21 had a protective effect on MCCs by negatively controlling the expression of MMPs and aggrecanases and consequently upregulating the production of matrix components in vivo and in vitro. The transfection results show that downregulation of Gdf5 significantly increased the levels of MMPs and accelerated matrix degradation (Figure 7a), while treatment with exogenous Gdf5 resulted in the opposite changes. The above findings suggest that Gdf5 can affect ECM homeostasis by regulating the expression of MMPs to alleviate OA progression; moreover, these findings could supplement the results of previous studies, as Gdf5 was originally recognized as a mediator of cell growth and differentiation during chondrogenesis.38,39 Therefore, colony formation assays and cytometric analyses should be performed. After the proliferation and apoptosis of chondrocytes are characterized, we can evaluate changes in cytoplasmic synthesis in OA chondrocytes.
The results of the animal experiments showed that the histopathological manifestations of TMJ-OA in the KO-OA group were milder than those in the WT-OA group. However, we are not confident about the restorative changes in the KO-OA group and WT-OA group. Therefore, a longer investigation period ranging from three to eight weeks is needed to further observe the histological changes between the groups and to determine whether the two groups exhibit different restorative trends after three weeks.
In conclusion, the present study demonstrates that the knockout of MiR21 plays a vital role in blocking cartilage matrix degradation to affect the progression of TMJ-OA. Gdf5, as the target gene of MiR21, exhibited decreased expression in TMJ-OA mice and downregulated the expression of MMPs to mitigate the degradation process. Our study sheds light on the potential effects of MiR21 and Gdf5 and raises possibilities for utilizing these molecules as prospective indicators of and therapeutic targets in TMJ-OA.
References
1. Izawa T , Mori H , Shinohara T , et al. Rebamipide attenuates mandibular condylar degeneration in a murine model of TMJ-OA by mediating a chondroprotective effect and by downregulating RANKL-mediated osteoclastogenesis . PLoS One . 2016 ; 11 ( 4 ): e0154107 . Crossref PubMed Google Scholar
2. Li H , Yang HH , Sun ZG , Tang HB , Min JK . Whole-transcriptome sequencing of knee joint cartilage from osteoarthritis patients . Bone Joint Res . 2019 ; 8 ( 7 ): 290 – 303 . Crossref PubMed Google Scholar
3. Zhang R-K , Li G-W , Zeng C , et al. Mechanical stress contributes to osteoarthritis development through the activation of transforming growth factor beta 1 (TGF-β1) . Bone Joint Res . 2018 ; 7 ( 11 ): 587 – 594 . Crossref PubMed Google Scholar
4. Kuroda S , Tanimoto K , Izawa T , et al. Biomechanical and biochemical characteristics of the mandibular condylar cartilage . Osteoarthritis Cartilage . 2009 ; 17 ( 11 ): 1408 – 1415 . Crossref PubMed Google Scholar
5. He A , Ning Y , Wen Y , et al. Use of integrative epigenetic and mRNA expression analyses to identify significantly changed genes and functional pathways in osteoarthritic cartilage . Bone Joint Res . 2018 ; 7 ( 5 ): 343 – 350 . Crossref PubMed Google Scholar
6. Tanaka E , Detamore MS , Mercuri LG . Degenerative disorders of the temporomandibular joint: etiology, diagnosis, and treatment . J Dent Res . 2008 ; 87 ( 4 ): 296 – 307 . Crossref PubMed Google Scholar
7. Zhang Y , Jia J , Yang S , et al. Microrna-21 controls the development of osteoarthritis by targeting GDF-5 in chondrocytes . Exp Mol Med . 2014 ; 46 ( 2 ): e79 . Crossref PubMed Google Scholar
8. Wang X-B , Zhao F-C , Yi L-H , et al. MicroRNA-21-5p as a novel therapeutic target for osteoarthritis . Rheumatology . 2019 : 1485 – 1497 . Crossref PubMed Google Scholar
9. Lu J , Ji M-L , Zhang X-J , et al. MicroRNA-218-5p as a potential target for the treatment of human osteoarthritis . Mol Ther . 2017 ; 25 ( 12 ): 2676 – 2688 . Crossref PubMed Google Scholar
10. Song J , Ahn C , Chun C-H , Jin E-J . A long non-coding RNA, GAS5, plays a critical role in the regulation of miR-21 during osteoarthritis . J Orthop Res . 2014 ; 32 ( 12 ): 1628 – 1635 . Crossref PubMed Google Scholar
11. Faiyaz-Ul-Haque M , Faqeih EA , Al-Zaidan H , Al-Shammary A , Zaidi SHE . Grebe-type chondrodysplasia: a novel missense mutation in a conserved cysteine of the growth differentiation factor 5 . J Bone Miner Metab . 2008 ; 26 ( 6 ): 648 – 652 . Crossref PubMed Google Scholar
12. Reynard LN , Bui C , Canty-Laird EG , Young DA , Loughlin J . Expression of the osteoarthritis-associated gene Gdf5 is modulated epigenetically by DNA methylation . Hum Mol Genet . 2011 ; 20 ( 17 ): 3450 – 3460 . Crossref PubMed Google Scholar
13. Miyamoto Y , Mabuchi A , Shi D , et al. A functional polymorphism in the 5’ UTR of GDF5 is associated with susceptibility to osteoarthritis ; 39 ( 4 ): 529 – 533 . Google Scholar
14. Jin L , Li X . Growth differentiation factor 5 regulation in bone regeneration . Curr Pharm Des . 2013 ; 19 ( 19 ): 3364 – 3373 . Crossref PubMed Google Scholar
15. Wang M , Sampson ER , Jin H , et al. Mmp13 is a critical target gene during the progression of osteoarthritis . Arthritis Res Ther . 2013 ; 15 ( 1 ): R5 . Crossref PubMed Google Scholar
16. Park SJ , Cheon EJ , Lee MH , Kim HA . MicroRNA-127-5p regulates matrix metalloproteinase 13 expression and interleukin-1β-induced catabolic effects in human chondrocytes . Arthritis Rheum . 2013 ; 65 ( 12 ): 3141 – 3152 . Crossref PubMed Google Scholar
17. Glasson SS , Askew R , Sheppard B , et al. Deletion of active ADAMTS5 prevents cartilage degradation in a murine model of osteoarthritis . Nature . 2005 ; 434 ( 7033 ): 644 – 648 . Crossref PubMed Google Scholar
18. Majumdar MK , Askew R , Schelling S , et al. Double-Knockout of ADAMTS-4 and ADAMTS-5 in mice results in physiologically normal animals and prevents the progression of osteoarthritis . Arthritis Rheum . 2007 ; 56 ( 11 ): 3670 – 3674 . Crossref PubMed Google Scholar
19. Lu L , Huang J , Zhang X , et al. Changes of temporomandibular joint and semaphorin 4D/Plexin-B1 expression in a mouse model of incisor malocclusion . J Oral Facial Pain Headache . 2014 ; 28 ( 1 ): 68 – 79 . Crossref PubMed Google Scholar
20. Liu Y-D , Liao L-F , Zhang H-Y , et al. Reducing dietary loading decreases mouse temporomandibular joint degradation induced by anterior crossbite prosthesis . Osteoarthritis Cartilage . 2014 ; 22 ( 2 ): 302 – 312 . Crossref PubMed Google Scholar
21. Onur T , Wu R , Metz L , Dang A . Characterisation of osteoarthritis in a small animal model of type 2 diabetes mellitus . Bone Joint Res . 2014 ; 3 ( 6 ): 203 – 211 . Crossref PubMed Google Scholar
22. Pritzker KPH , Gay S , Jimenez SA , et al. Osteoarthritis cartilage histopathology: grading and staging . Osteoarthritis Cartilage . 2006 ; 14 ( 1 ): 13 – 29 . Crossref PubMed Google Scholar
23. Si H-B , Zeng Y , Liu S-Y , et al. Intra-Articular injection of microRNA-140 (miRNA-140) alleviates osteoarthritis (oa) progression by modulating extracellular matrix (ECM) homeostasis in rats . Osteoarthritis Cartilage . 2017 ; 25 ( 10 ): 1698 – 1707 . Crossref PubMed Google Scholar
24. No authors listed . Miranda database . 2020 . http://www.microrna.org/microrna/home.do (date last accessed 7 October 2020 ). Google Scholar
25. Guo Y , Min Z , Jiang C , et al. Downregulation of HS6ST2 by miR-23b-3p enhances matrix degradation through p38 MAPK pathway in osteoarthritis . Cell Death Dis . 2018 ; 9 ( 6 ): 699 . Crossref PubMed Google Scholar
26. Alomar X , Medrano J , Cabratosa J , et al. Anatomy of the temporomandibular joint . Semin Ultrasound CT MR . 2007 ; 28 ( 3 ): 170 – 183 . Google Scholar
27. Liz J , Esteller M . IncRNAs and microRNAs with a role in cancer development . Biochimica et Biophysica Acta (BBA) - Gene Regulatory Mechanisms . 1859 ; 2016 ( 1 ): 169 – 176 . Google Scholar
28. McManus DD , Freedman JE . Micrornas in platelet function and cardiovascular disease . Nat Rev Cardiol . 2015 ; 12 ( 12 ): 711 – 717 . Crossref PubMed Google Scholar
29. Lu X , Lin J , Jin J , Qian W , Weng X . Hsa-miR-15a exerts protective effects against osteoarthritis by targeting aggrecanase-2 (ADAMTS5) in human chondrocytes . Int J Mol Med . 2016 ; 37 ( 2 ): 509 – 516 . Crossref PubMed Google Scholar
30. Bartel DP . MicroRNAs: target recognition and regulatory functions . Cell . 2009 ; 136 ( 2 ): 215 – 233 . Crossref PubMed Google Scholar
31. Shyu A-B , Wilkinson MF , van Hoof A . Messenger RNA regulation: to translate or to degrade . Embo J . 2008 ; 27 ( 3 ): 471 – 481 . Google Scholar
32. Jackson RJ , Standart N . How do microRNAs regulate gene expression? Sci STKE . 2007 ; 2007 ( 367 ): re1 . Crossref PubMed Google Scholar
33. Swingler TE , Niu L , Smith P , et al. The function of microRNAs in cartilage and osteoarthritis . Clin Exp Rheumatol . 2019 ; 120 ( 5 ): 40 – 47 . PubMed Google Scholar
34. Tilg H , Dinarello CA , Mier JW . Il-6 and APPs: anti-inflammatory and immunosuppressive mediators . Immunol Today . 1997 ; 18 ( 9 ): 428 – 432 . Crossref PubMed Google Scholar
35. Zhao H , Liu S , Ma C , et al. Estrogen-Related receptor γ induces angiogenesis and extracellular matrix degradation of temporomandibular joint osteoarthritis in rats . Front Pharmacol . 2019 ; 10 : 1290 . Crossref PubMed Google Scholar
36. Porée B , Kypriotou M , Chadjichristos C , et al. Interleukin-6 (IL-6) and/or soluble IL-6 receptor down-regulation of human type II collagen gene expression in articular chondrocytes requires a decrease of Sp1.Sp3 ratio and of the binding activity of both factors to the COL2A1 promoter . J Biol Chem . 2008 ; 283 ( 8 ): 4850 – 4865 . Google Scholar
37. Gao Y , Liu S , Huang J , et al. The ECM-cell interaction of cartilage extracellular matrix on chondrocytes . Biomed Res Int . 2014 ; 2014 : 1 – 8 . Crossref PubMed Google Scholar
38. Yeh L-CC , Mallein-Gerin F , Lee JC . Differential effects of osteogenic protein-1 (BMP-7) on gene expression of BMP and GDF family members during differentiation of the mouse MC615 chondrocyte cells . J Cell Physiol . 2002 ; 191 ( 3 ): 298 – 309 . Crossref PubMed Google Scholar
39. Zeng Q , Li X , Choi L , et al. Recombinant growth/differentiation factor-5 stimulates osteogenic differentiation of fat-derived stromal cells in vitro . Connect Tissue Res . 2006 ; 47 ( 5 ): 264 – 270 . Crossref PubMed Google Scholar
Author contributions
A. Zhang: Designed the research, Drafted the manuscript, Conducted the experiments, Collected and analyzed the data.
S. Ma: Conducted the experiments, Collected and analyzed the data.
L. Yuan: Drafted the manuscript, Collected and analyzed the data.
S. Wu: Drafted the manuscript, Collected and analyzed the data.
S. Liu: Designed the research.
X, Wei: Collected and analyzed the data.
L. Chen: Provided the reagents, materials, and analysis tools.
C. Ma: Designed the research, Provided the reagents, materials, and analysis tools.
H. Zhao: Drafted the manuscript, Provided the reagents, materials, and analysis tools.
Funding statement
This work was supported by the National Natural Science Foundation of China (61771290, 61871393), the Science and Technology Development Plans of Shandong province (Grant 2018GSF118196), Taishan Schloars (tsqn201812137), Natural Science Foundation of Shandong Province (No. ZR2018PH022, ZR2019PH015), China Postdoctoral Science Foundation (No. 2019M652408), Jinan Science and Technology Plan (No. 201907098), and Fundamental Research Funds of Shandong University (No. 2019GN091). No benefits in any form have been received or will be received from a commercial party related directly or indirectly to the subject of this article.
Acknowledgements
We really appreciate Prof. Fabin Han's team's support for our work, whose laboratory named the Institute for Tissue Engineering and Regenerative Medicine is situated in Liaocheng People's Hospital. We are also quite grateful to Prof. Yi Liu's team for their support and help for us, who are affiliated to the Pediatric Research Institute from Qilu Children's Hospital of Shandong University.
Ethical review statement
The whole experimental procedure was approved by the Institutional Animal Care Committee (Protocol GR2018017).
Supplementary material
Representative figures for the identification of knockout mice and primary mandibular condylar chondrocytes (MCCs) in mice with corresponding descriptions, and a table showing GV141 plasmid location and sequences used for the transfection of Gdf5. The structural image of GV141 plasmid is also provided.
© 2020 Author(s) et al. This is an open-access article distributed under the terms of the Creative Commons Attribution Non-Commercial No Derivatives (CC BY-NC-ND 4.0) licence, which permits the copying and redistribution of the work only, and provided the original author and source are credited. See https://creativecommons.org/licenses/by-nc-nd/4.0/.
