


Abstract
Aims
Parathyroid hormone (PTH) (1-34) exhibits potential in preventing degeneration in both cartilage and subchondral bone in osteoarthritis (OA) development. We assessed the effects of PTH (1-34) at different concentrations on bone and cartilage metabolism in a collagenase-induced mouse model of OA and examined whether PTH (1-34) affects the JAK2/STAT3 signalling pathway in this process.
Methods
Collagenase-induced OA was established in C57Bl/6 mice. Therapy with PTH (1-34) (10 μg/kg/day or 40 μg/kg/day) was initiated immediately after surgery and continued for six weeks. Cartilage pathology was evaluated by gross visual, histology, and immunohistochemical assessments. Cell apoptosis was analyzed by TUNEL staining. Microcomputed tomography (micro-CT) was used to evaluate the bone mass and the microarchitecture in subchondral bone.
Results
Enhanced matrix catabolism, increased apoptosis of chondrocytes in cartilage, and overexpressed JAK2/STAT3 and p-JAK2/p-STAT3 were observed in cartilage in this model. All of these changes were prevented by PTH (1-34) treatment, with no significant difference between the low-dose and high-dose groups. Micro-CT analysis indicated that bone mineral density (BMD), bone volume/trabecular volume (BV/TV), and trabecular thickness (Tb.Th) levels were significantly lower in the OA group than those in the Sham, PTH 10 μg, and PTH 40 μg groups, but these parameters were significantly higher in the PTH 40 μg group than in the PTH 10 μg group.
Conclusion
Intermittent administration of PTH (1-34) exhibits protective effects on both cartilage and subchondral bone in a dose-dependent manner on the latter in a collagenase-induced OA mouse model, which may be involved in regulating the JAK2/STAT3 signalling pathway.
Cite this article: Bone Joint Res 2020;9(10):675–688.
Article focus
-
We assessed the effects of parathyroid hormone (PTH) (1-34) at different concentrations on bone and cartilage metabolism in a collagenase-induced mouse model of osteoarthritis (OA) and examined whether PTH (1-34) affects the JAK2/STAT3 signalling pathway in this process.
Key messages
-
PTH (1-34) exhibits protective effects on both cartilage and subchondral bone in the development of osteoarthritis (OA).
-
PTH (1-34) protects subchondral bone in a dose-dependent manner but not cartilage in a collagenase-induced OA mouse model.
-
PTH (1-34) could simultaneously downregulate the p-JAK2/JAK2 and p-STAT3/STAT3 protein levels.
Strengths and limitations
-
This study provides some evidence for treating OA.
-
The results explain the effects of PTH on OA from both cartilage and subchondral bone.
-
Lack of evidence on molecular level to elucidate the exact role of JAK2/STAT3 in the preventive effects of PTH (1-34) on OA.
Introduction
Osteoarthritis (OA) is the most common form of arthritis and is generally characterized by degradation of cartilage, synovial inflammation, and abnormal bone remodelling.1 Currently, anti-inflammatory drugs, analgesics, and lubricating supplements are primarily used for the treatment of OA,2 but there is still no disease-modifying treatment for OA. In view of the parallel roles of cartilage and subchondral bone in OA development, some agents that affect both cartilage and subchondral bone are promising for OA treatment, including parathyroid hormone (PTH) (1-34), which is primarily used for the treatment of osteoporosis in clinical practice.2
It has been widely recognized that intermittent administration of PTH (1-34) has an ‘anabolic window’.3,4 In the anabolic window, intermittent PTH (1-34) exhibits promoting effects on bone formation1,5,6 in a dose-dependent fashion.7–9 On the other hand, recent studies suggest that intermittent administration of PTH (1-34) works directly on cartilage by preventing its degradation through promoting chondrocyte proliferation and extracellular matrix production,2,10,11 but it is unclear whether the protective effect of intermittent PTH (1-34) on cartilage is dose-dependent, and the involved signalling pathway and the precise network are still unknown.
Previous studies have shown that the JAK2/STAT3 signalling pathway is involved in the degeneration of the cartilage in OA.12–14 However, regarding the effect of intermittent PTH (1-34) on cartilage in the progression of OA, there is little knowledge about the involvement of the JAK2/STAT3 pathway.
We therefore hypothesize that intermittent administration of PTH (1-34) has a protective effect on both the cartilage and subchondral bone, and we performed the present study to explore the changes in cartilage and subchondral bone in a collagenase-induced OA mouse model in response to different concentrations of PTH (1-34) and provide some primary data focused on the role of the JAK2/STAT3 signalling pathway in this process.
Methods
Animals
The experiment was approved by the Institutional Animal Care and Use Committee of North China University of Science and Technology (LX2019034), Tangshan, China. The experiments were performed on 24 12-week-old male C57Bl/6 mice. Animals were randomly divided into four groups of six animals in each: the Sham group, the collagenase injection group (OA group), the low dose of PTH (1-34) treatment group (PTH 10 μg group), and the high dose of PTH (1-34) treatment group (PTH 40 μg group). Animals were fed a standard rodent diet, housed in the Medical Research Animal Centre of North China University of Science and Technology, and maintained on a 12 hours light/12 hours dark cycle.
Induction of experimental OA and drug treatment
The induction of experimental OA replicated previously validated procedures.15 The OA, PTH 10 μg, and PTH 40 μg groups were injected with type VII collagenase (Sigma-Aldrich, St. Louis, Missouri, USA) from the patellar ligament with a microsyringe on days 0 and 2, as previously described,15 and saline was given in the Sham group. Animals in the PTH 10 μg and PTH 40 μg groups received subcutaneous injections of 10 μg/kg/day or 40 μg/kg/day (five days weekly) of PTH (1-34) (Sigma-Aldrich), respectively. Saline was given as a placebo to animals in the Sham and OA groups. The treatment lasted for six weeks. All animals were euthanized with CO2 to harvest the entire knee joints.
Macroscopic findings in cartilage
After disarticulation, the right tibiae were cleaned, and their gross visual appearance was photographed with a Canon 550D digital camera (Canon, Tokyo, Japan) and fixed in 4% formalin. Medial tibiae were evaluated according to a previous grading system, as follows: grade 0 (normal); grade 1 (surface roughening); grade 2 (fibrillation and fissures); grade 3 (large erosions extending down to the subchondral bone); and grade 4 (larger erosions down to the subchondral bone).16
Histology
The left knees were fixed in 4% formalin solution for 48 hours and decalcified with 10% disodium salt dihydrate (Na2EDTA) for six weeks. Then, the samples were sequentially dehydrated, embedded in paraffin, and finally cut into 6 μm sections. The sections from each group were stained with toluidine blue. Degenerative changes of the medial tibial plateau were evaluated according to an Osteoarthritis Research Society International (OARSI) grading system (Table I).17 The thickness of the calcified layers and articular cartilage at the medial tibiae was measured further in these sections. The ratio of calcified layers to total cartilage was also measured. The scoring and measurement processes were also performed as previously described.5
Table I.
The Osteoarthritis Research Society International scoring systems for assessing the severity of osteoarthritis.
| Classification | Parameter | Score |
| A | Articular cartilage structure | |
| Normal | 0 | |
| Slight surface irregularities or surface slightly disturbed | 1 | |
| Moderate surface irregularities or surface roughened | 2 | |
| Severe surface irregularities (disruption < 10% depth) | 3 | |
| Fissures to transitional zone (disruption < 1/3 depth) | 4 | |
| Fissures to radial zone (disruption < 2/3 depth) | 5 | |
| Fissures to calcified zone (full depth) | 6 | |
| Erosion to mid zone (< 1/3 depth) | 7 | |
| Erosion to deep zone (< 2/3 depth) | 8 | |
| Erosion to calcified zone (full depth) | 9 | |
| Erosion to subchondral bone | 10 | |
| B | Chondrocyte density | |
| Normal | 0 | |
| Slight decrease | 1 | |
| Moderate decrease | 2 | |
| Severe decrease | 3 | |
| No cells | 4 | |
| C | Cell cloning | |
| Normal | 0 | |
| Several doublets | 1 | |
| Many doublets | 2 | |
| Doublets and triplets | 3 | |
| Multiple cell nests | 4 | |
| D | Interterritorial Toluidine blue | |
| Normal | 0 | |
| Decreased staining to mid zone (< 1/3 depth) | 1 | |
| Decreased staining to deep zone (< 2/3 depth) | 2 | |
| Decreased staining to calcified zone (full depth) | 3 | |
| No staining | 4 | |
| E | Tidemark | |
| Intact and single tidemark | 0 | |
| Duplicated tidemark | 1 | |
| Blood vessels through subchondral bone plate to calcified cartilage | 2 | |
| Crossed by vessels of tidemark | 3 |
Immunohistochemical assessments
Paraffin sections were routinely deparaffinized, rehydrated, and repaired by 0.05% trypsin and inactivation of endogenous peroxidases with hydrogen peroxide (H2O2) at room temperature for ten minutes. Subsequently, incubation with the antibodies was performed overnight at 4°C. The expression levels of collagen-II (Col-II) (1 μg/ml; DSHB Hybridoma Product II-II6B3, from Linsenmayer TF at Tufts University School of Medicine, Boston, Massachusetts, USA), aggrecan (AGG) (2.85 μg/ml; Gene Tex, San Antonio, Texas, USA), caspase-3 (0.667 μg/ml; Boster, Wuhan, China), a disintegrin and metalloproteinase with thrombospondin motifs (ADAMTS)-4 (2 μg/ml; Abcam, Cambridge, UK), ADAMTS-5 (2 μg/ml; Bioss, Beijing, China), matrix metalloproteinase-13 (MMP-13) (1 μg/ml; Gene Tex), JAK2 (2.267 μg/ml; Proteintech, Wuhan, China), STAT3 (1.933 μg/ml; Proteintech), p-JAK2 (2.5 μg/ml; Boster), and p-STAT3 (2.5 μg/ml; Boster) in the cartilage were analyzed. Finally, the colour brown developed with DAB staining (ZSGB-BIO Corporation, Beijing, China). All sections were measured by Image Pro Plus (IPP) version 6.0 software (Media Cybernetics, Rockville, Maryland, USA). Then, the mean intensity of optical density (IOD) was measured as previously described.5,18
TUNEL staining
We used the ApopTag peroxidase in situ apoptosis detection kit (Merck Millipore, Burlington, Massachusetts, USA), which utilizes DNA fragments utilizing terminal deoxynucleotidyl transferase (TdT) by specific staining to observe apoptotic chondrocytes in cartilage. The sections were heated at 59°C and deparaffinized in three changes of xylene and alcohol, and washed once with phosphate-buffered saline (PBS) for three minutes. Then, the sections were treated with proteinase K (20 μg/ml, Apoptosis Detection Kit; Merck Millipore) to digest the samples for 15 minutes at room temperature, after which the sections were washed twice with distilled water (dH2O) for three minutes each, followed by quenching of endogenous peroxidase in 3% H2O2 for five minutes and adding equilibration buffer directly onto the specimen. The sections were treated with TdT enzyme at 37°C for one hour and washed with working strength stop/wash buffer, after which anti-digoxigenin conjugate (Apoptosis Detection Kit; Merck Millipore) was added for 30 minutes. The sections were then washed three times in PBS. Peroxidase substrate was applied to completely cover the specimen, and finally the sections were dyed with haematoxylin. Apoptotic cells were detected by the percentage of TUNEL-positive cells in the cartilage, as previously described.19,20
Micro-CT imaging
The right knees were scanned using a micro-CT system (SkyScan1176 Software: Version 1.1, build 6; Bruker, Kontich, Belgium). Data were collected at 50 KeV of energy, with a 270-μA current and 8.96580 μm cubic resolution. The region of interest was defined as the epiphysis bone of the tibia to study subchondral bone.21 The following architectural parameters were calculated to describe the bone mass and structure: bone mineral density (BMD, mg/cm3), bone volume/trabecular volume (BV/TV, %), trabecular thickness (Tb.Th, μm), and structure model index (SMI).
Data analysis and statistics
All data are expressed as the mean and SD. One-way analysis of variance (ANOVA) was used to test the differences in data with a Gaussian distribution between groups. Fisher's least significant difference (LSD) t-test or Dunnett's T3 test was used for pairwise comparisons, which depends on homogeneity of variance. OARSI scores and non-Gaussian distributed data were analyzed by Kruskal-Wallis H test, then Mann-Whitney U test was used to compare pairwise comparisons. Two-tailed p-values < 0.05 were considered statistically significant. Statistical analysis data were measured by using SPSS software (SPSS v20.0; IBM, Armonk, New York, USA).
Results
Macroscopic findings
The macroscopic findings, shown in Figure 1, indicated that the articular surfaces of the OA group were slightly rough. However, total scores were not significantly different between any two groups (p > 0.05, Mann-Whitney U test).
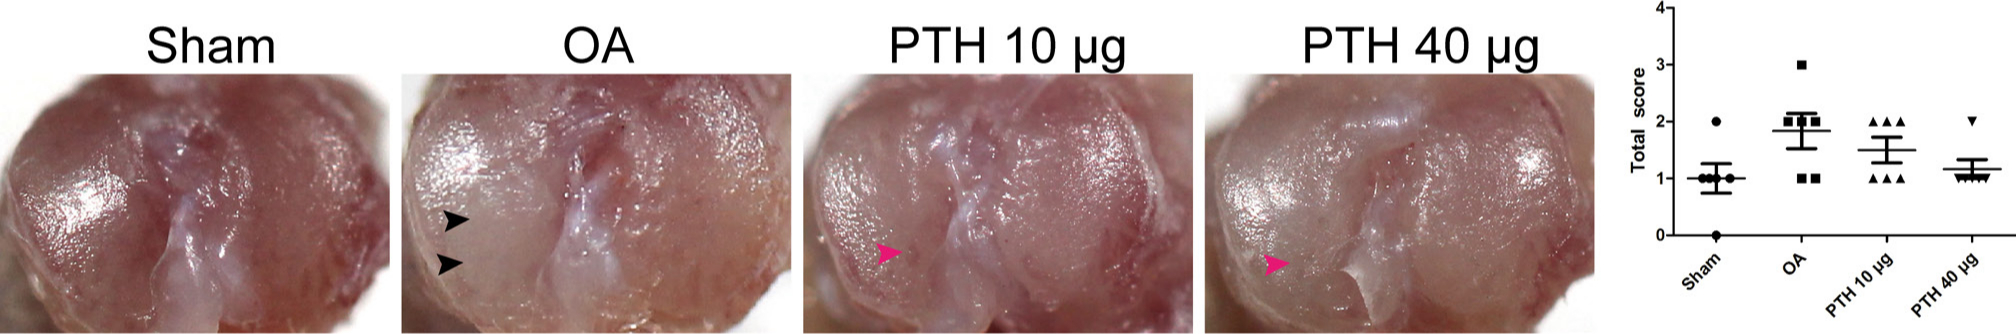
Fig. 1
Outline of the tibial plateau of samples and macroscopic scoring between groups. Black arrows indicate fibrillation of the tibial plateau, and pink arrows indicate surface roughening. Data are presented as the mean (SD), p-values measured using Mann-Whitney U test. OA, osteoarthritis; PTH, parathyroid hormone.
Histological observation and OARSI scoring of cartilage
Histological observation and OARSI scoring of cartilage are shown in Figures 2a and 2b. The Sham group demonstrated almost no degeneration of articular cartilage. There were more obvious histological changes in the OA group, including cartilage surface irregularities, reduced chondrocyte density, and toluidine blue staining of the hyaline chondrocyte layer. The PTH 10 μg and PTH 40 μg groups mainly exhibited cartilage degradation, including slight surface disturbances and increased cell cloning. The total OARSI score in the OA group was significantly higher than that in the Sham group (p = 0.002, Mann-Whitney U test), while the PL and PH groups showed lower scores than those of the OA group (PTH 10 μg group vs OA group: p = 0.004; PTH 40 μg group vs OA group: p = 0.002, both Mann-Whitney U test). There was no significant difference between the PTH 10 μg and PTH 40 μg groups (p > 0.05, Mann-Whitney U test).
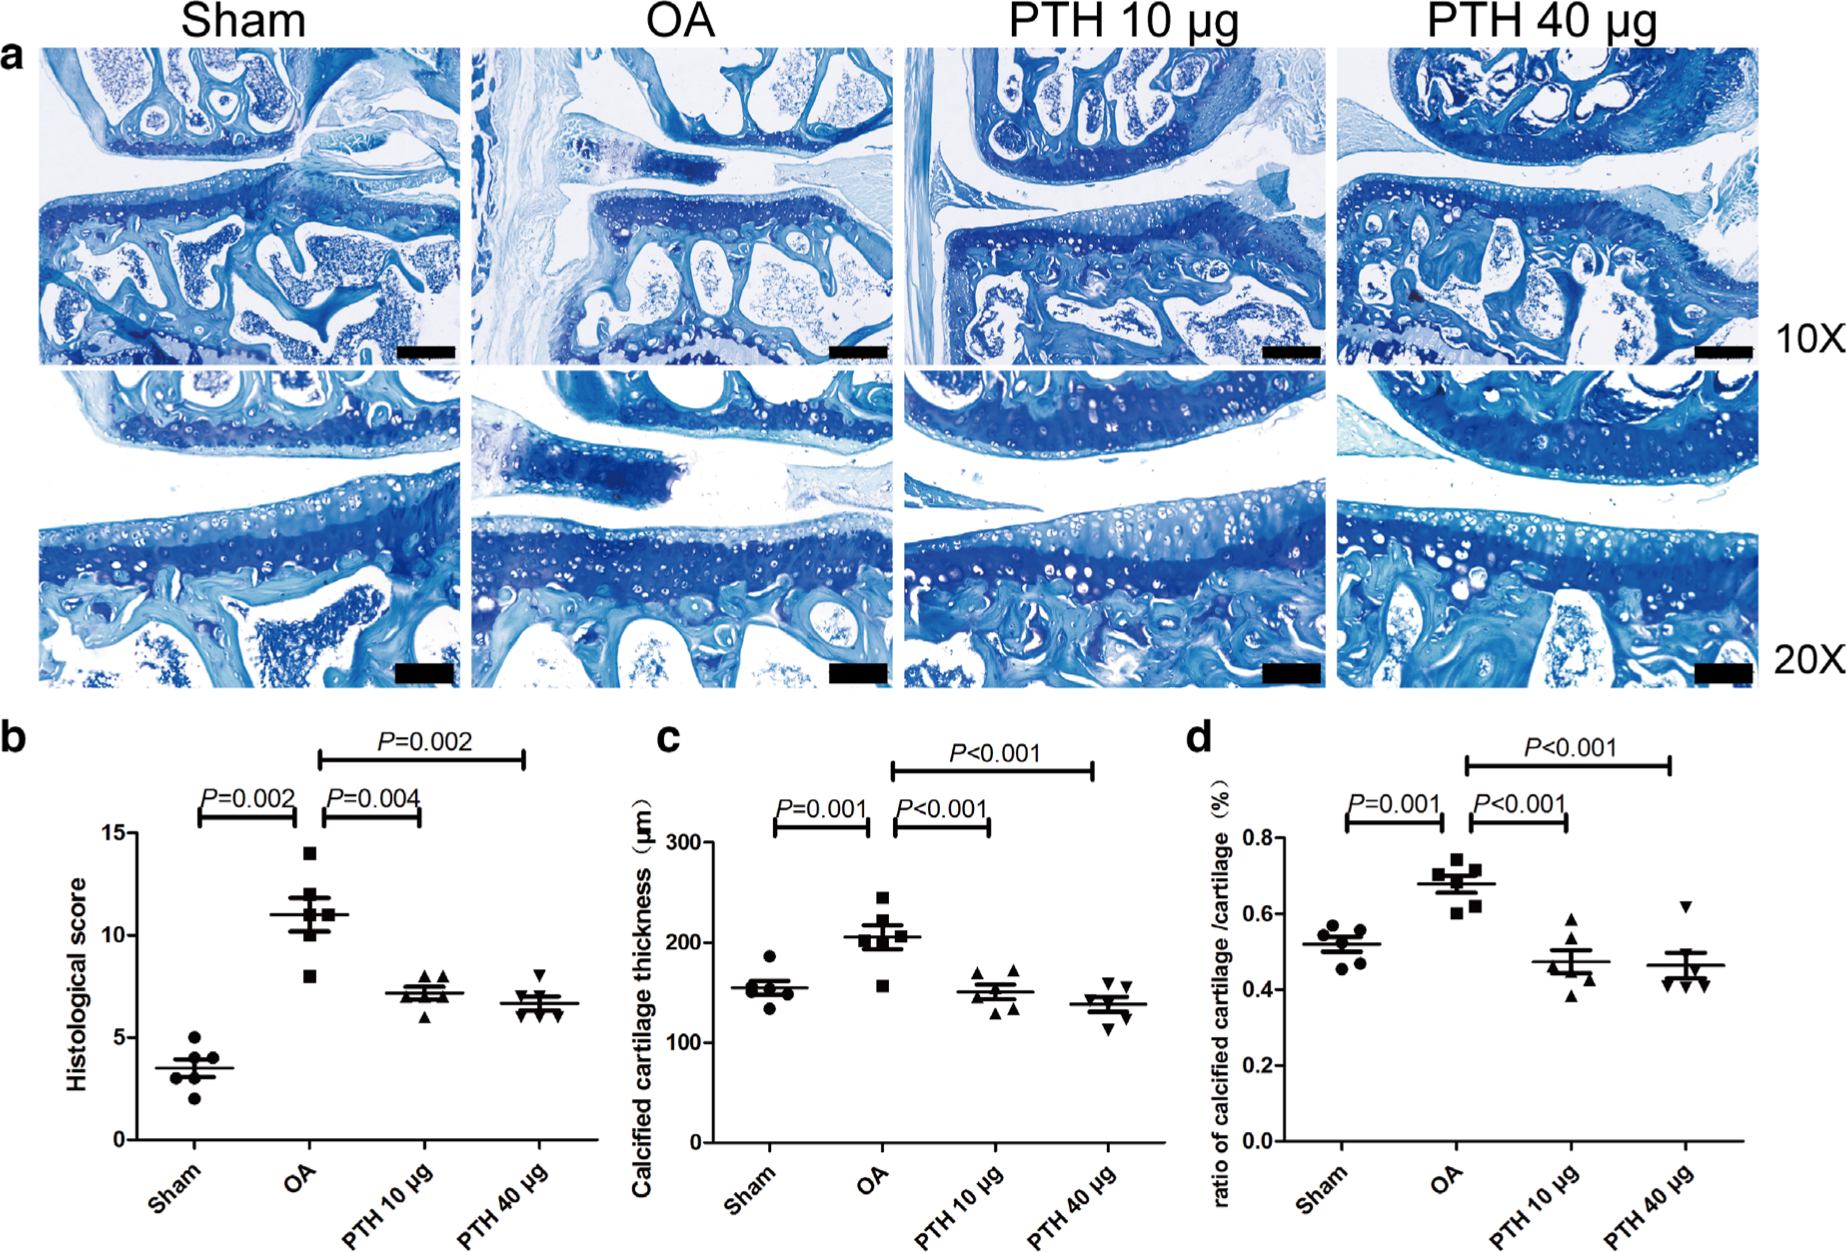
Fig. 2
Histological analysis of the medial tibial plateau and OARSI microscopic scoring between groups. a) Toluidine blue staining of the medial tibial plateau. b) Histological score of the medial tibial plateau in different groups. c) Thickness of calcified cartilage of the medial tibia in different groups. d) Ratio of calcified cartilage/cartilage in different groups. Data are presented as the mean (SD). The difference of OARSI scores between any two groups was analyzed using the Mann–Whitney U test. Thickness of calcified cartilage and ratio of calcified cartilage/cartilage was analyzed using the one-way analysis of variance (ANOVA). Thin bars = 200 μm. Thick bars = 100 μm. OA, osteoarthritis; PTH, parathyroid hormone.
Measurements of articular cartilage
Quantification of total cartilage thickness by histology revealed no significant difference between any two groups at the medial tibial plateau (p > 0.05, one-way ANOVA). However, a difference in the calcified cartilage thicknesses was noted: the OA group had significantly thicker calcified cartilage than that of the Sham, PTH 10 μg, and PTH 40 μg groups (p = 0.001, p < 0.001, and p < 0.001, respectively, all measured with one-way ANOVA) (Figure 2c), and the ratio of the calcified cartilage to total cartilage was significantly higher in the OA group than that in the Sham, PTH 10 μg, and PTH 40 μg groups (p = 0.001, p < 0.001, and p < 0.001, respectively, all measured with one-way ANOVA) (Figure 2d). Thicknesses of calcified cartilage and the ratio of the calcified cartilage to total cartilage were not significantly different between the PTH 10 μg and PTH 40 μg groups (p > 0.05, one-way ANOVA).
Immunohistochemical assessments
In the cartilage, Col-II expression (Figures 3b and 3d) was significantly downregulated in the OA group compared with that of the Sham, PTH 10 μg, and PTH 40 μg groups (p = 0.019, p = 0.023, and p = 0.005, respectively, all measured with one-way ANOVA). The Col-II expression level was not significantly different between the PTH 10 μg and PTH 40 μg groups (p > 0.05, one-way ANOVA). The AGG expression level showed no significant differences between any two groups (p > 0.05, one-way ANOVA) (Figures 3a and 3c).
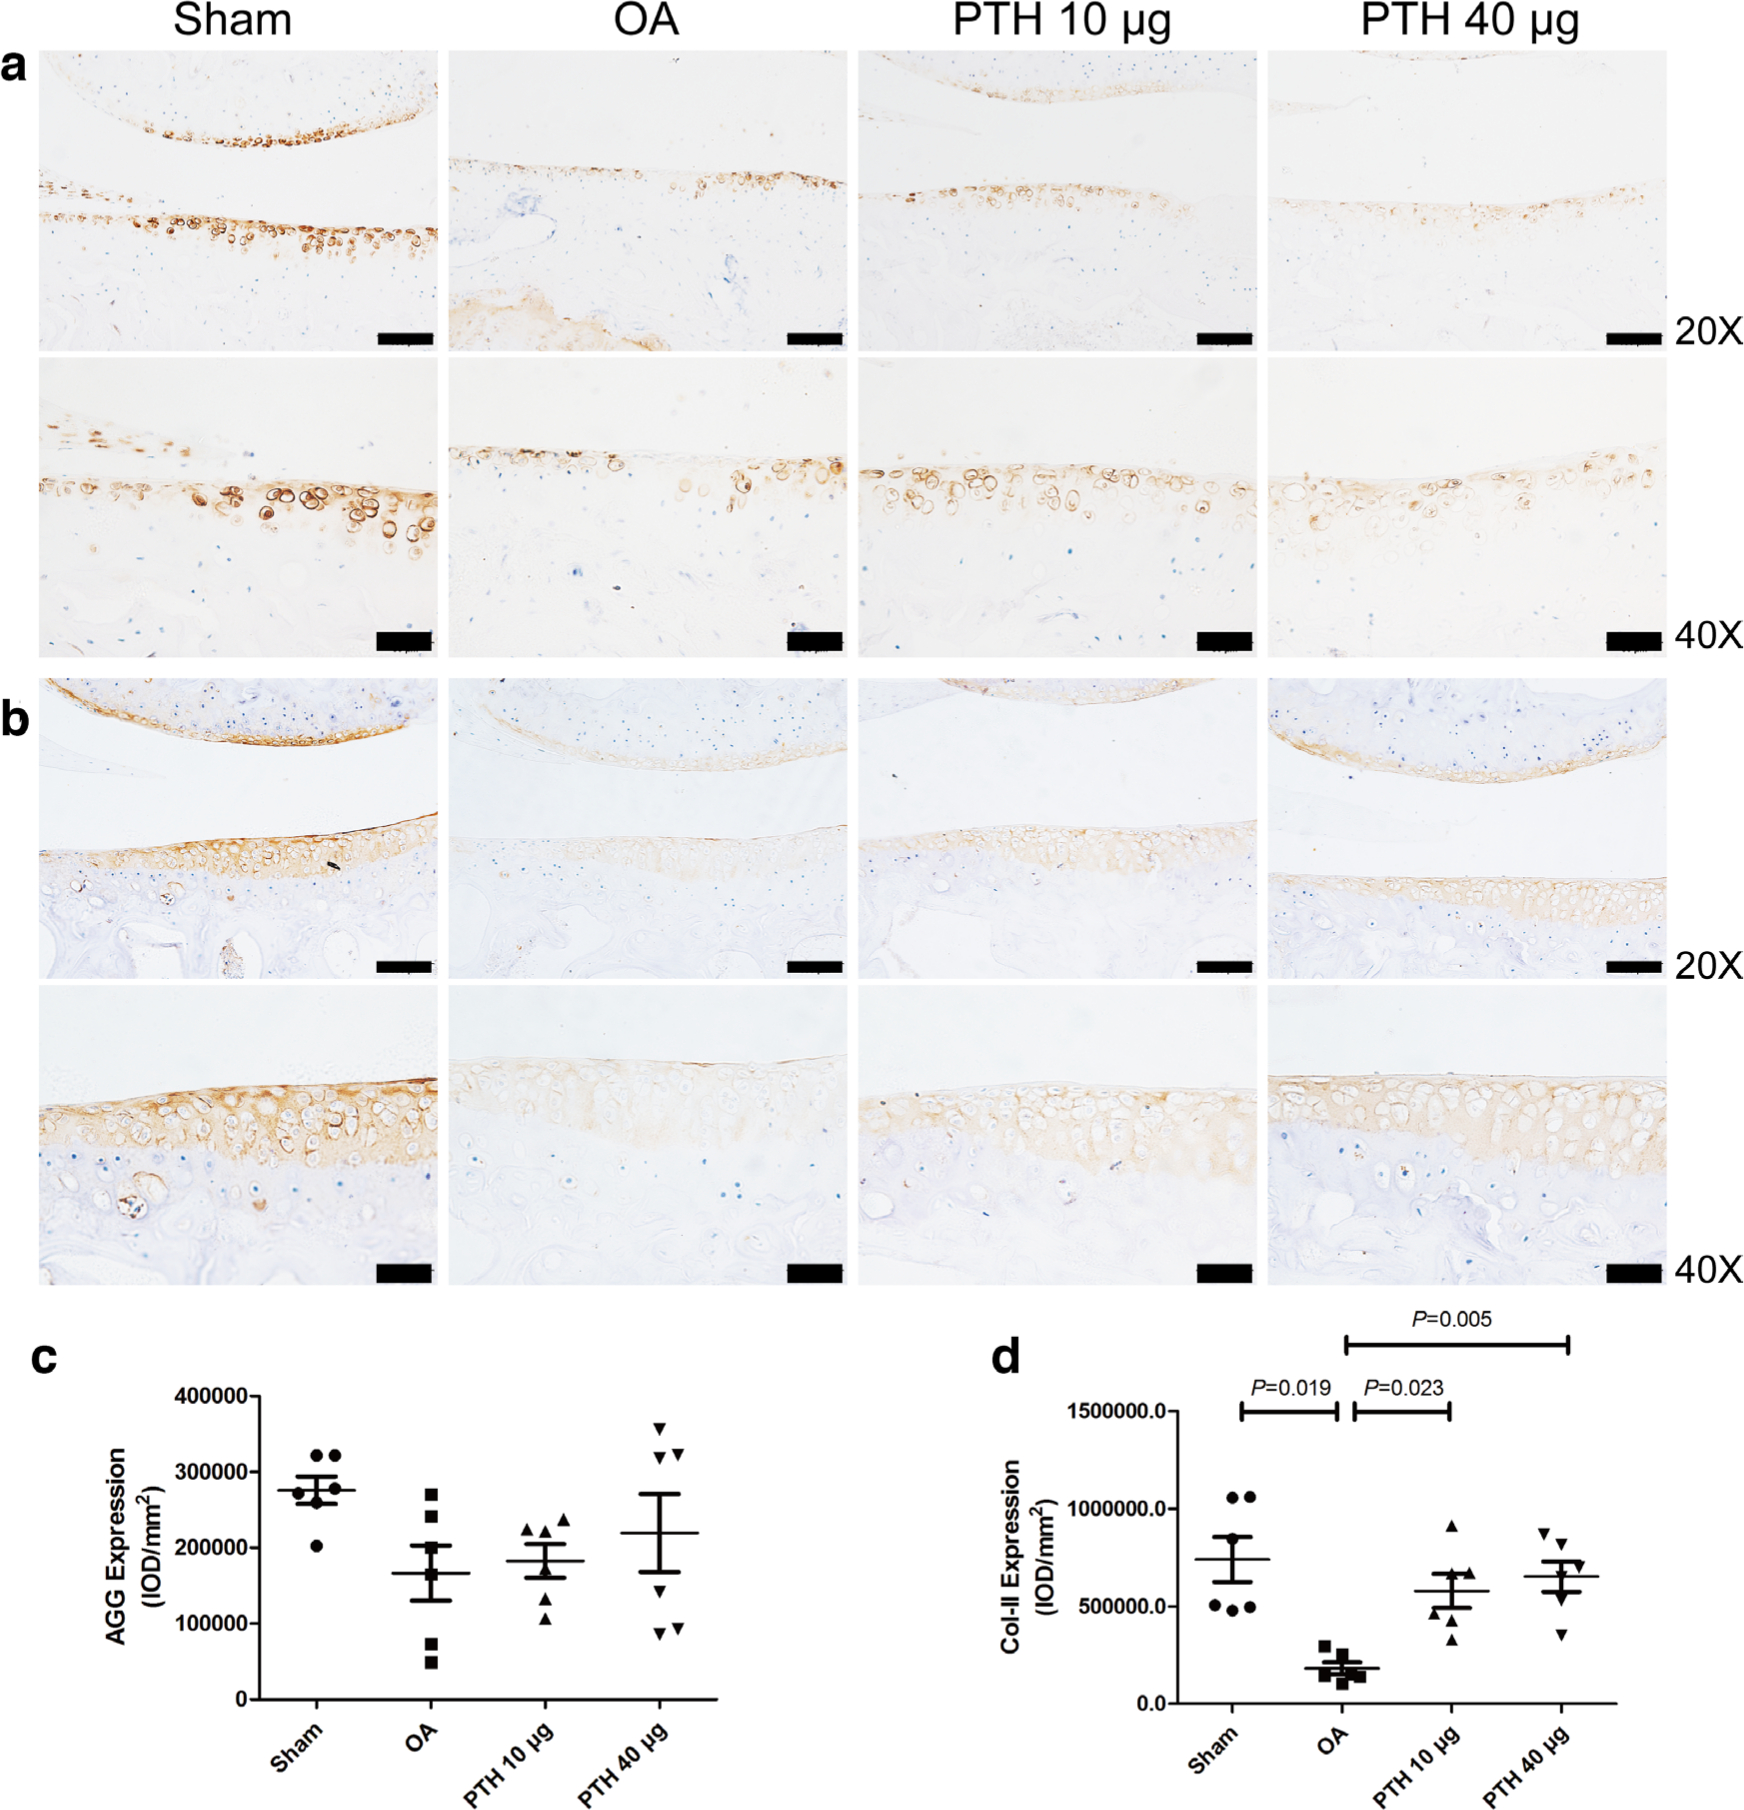
Fig. 3
Immunohistochemical assay for a) aggrecan (AGG) and b) collagen-II (Col-II) in each group. c) Intensity of optical density (IOD) values of AGG in different groups. d) IOD values of Col-II in different groups. Data are presented as the mean (SD), all p-values were measured using one-way analysis of variance (ANOVA). Thin bars = 100 μm. Thick bars = 50 μm. OA, osteoarthritis; PTH, parathyroid hormone.
In the OA group, ADAMTS-4 (Figures 4a and 4c), ADAMTS-5 (Figure 5), MMP-13 (Figures 4b and 4d), and caspase-3 (Figures 6a and 6c) expression levels were significantly higher than those in the Sham group (p = 0.009, p = 0.013, p < 0.001, and p = 0.002, respectively, all measured with one-way ANOVA). Compared with the protein expression in the OA group, ADAMTS-4, ADAMTS-5, MMP-13, and caspase-3 expression levels were significantly lower in the PTH 10 μg group (p = 0.011, p = 0.021, p = 0.001, and p = 0.001, respectively, all measured with one-way ANOVA) and the PTH 40 μg group (p = 0.014, p = 0.017, p < 0.001, and p = 0.005, respectively, all measured with one-way ANOVA). ADAMTS-4, MMP-13, ADAMTS-5, and caspase-3 expression levels were not significantly different between the PTH 10 μg group and PTH 40 μg group (p > 0.05, one-way ANOVA).
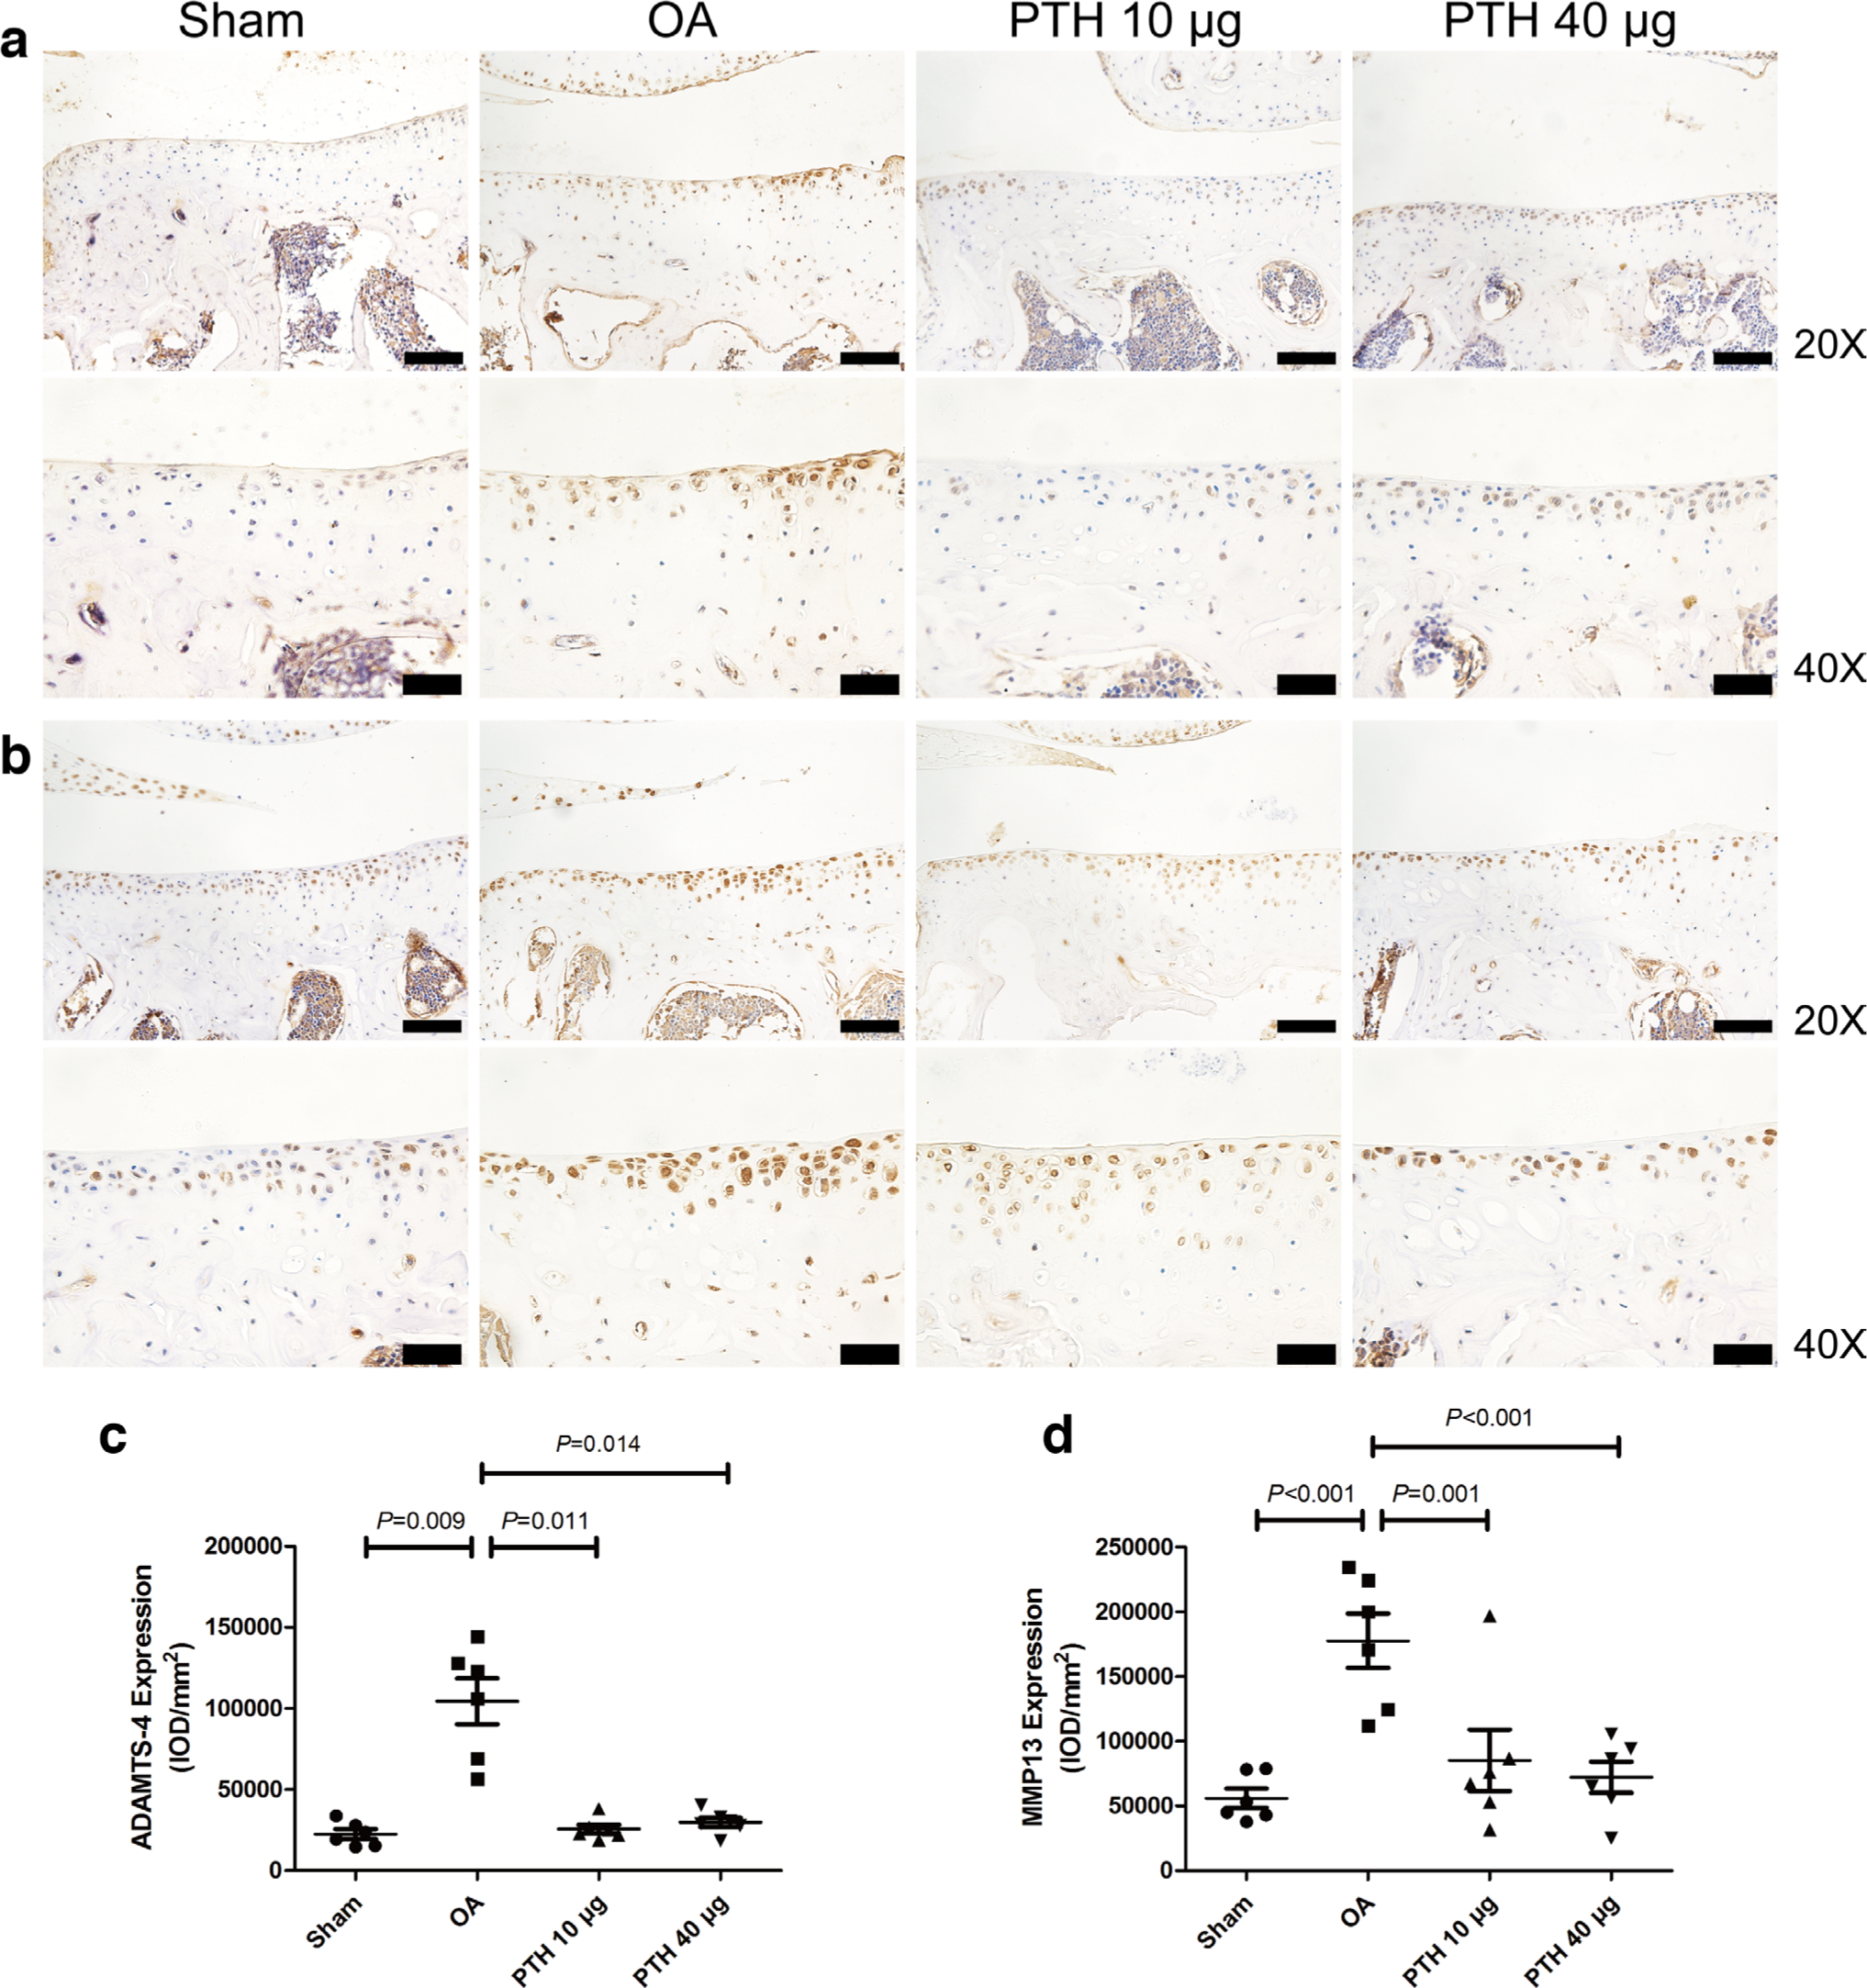
Fig. 4
Immunohistochemical assay for a) a disintegrin and metalloproteinase with thrombospondin motifs-4 (ADAMTS-4) and b) matrix metalloproteinase-13 (MMP-13) in each group. c) Intensity of optical density (IOD) values of ADAMTS-4 in different groups. d) IOD values of MMP-13 in different groups. Data are presented as the mean (SD), all p-values measured using one-way analysis of variance (ANOVA). Thin bars = 100 μm. Thick bars = 50 μm. OA, osteoarthritis; PTH, parathyroid hormone.
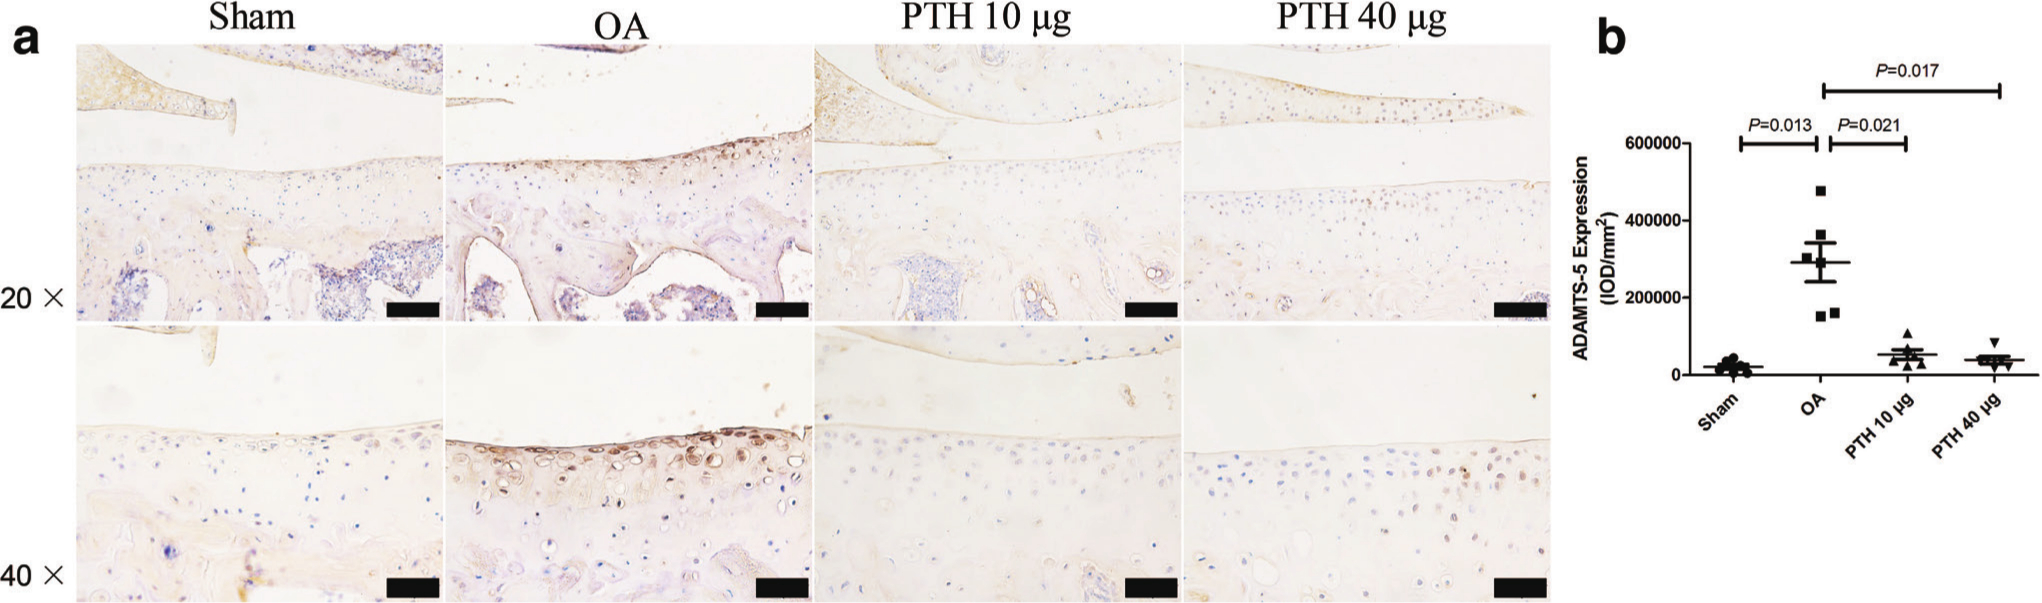
Fig. 5
Immunohistochemical assay for a) a disintegrin and metalloproteinase with thrombospondin motifs (ADAMTS)-5 in each group. b) Intensity of optical density (IOD) values of ADAMTS-5 in different groups. Data are presented as the mean (SD), all p-values measured using one-way analysis of variance (ANOVA). Thin bars = 100 μm. Thick bars = 50 μm. OA, osteoarthritis; PTH, parathyroid hormone.
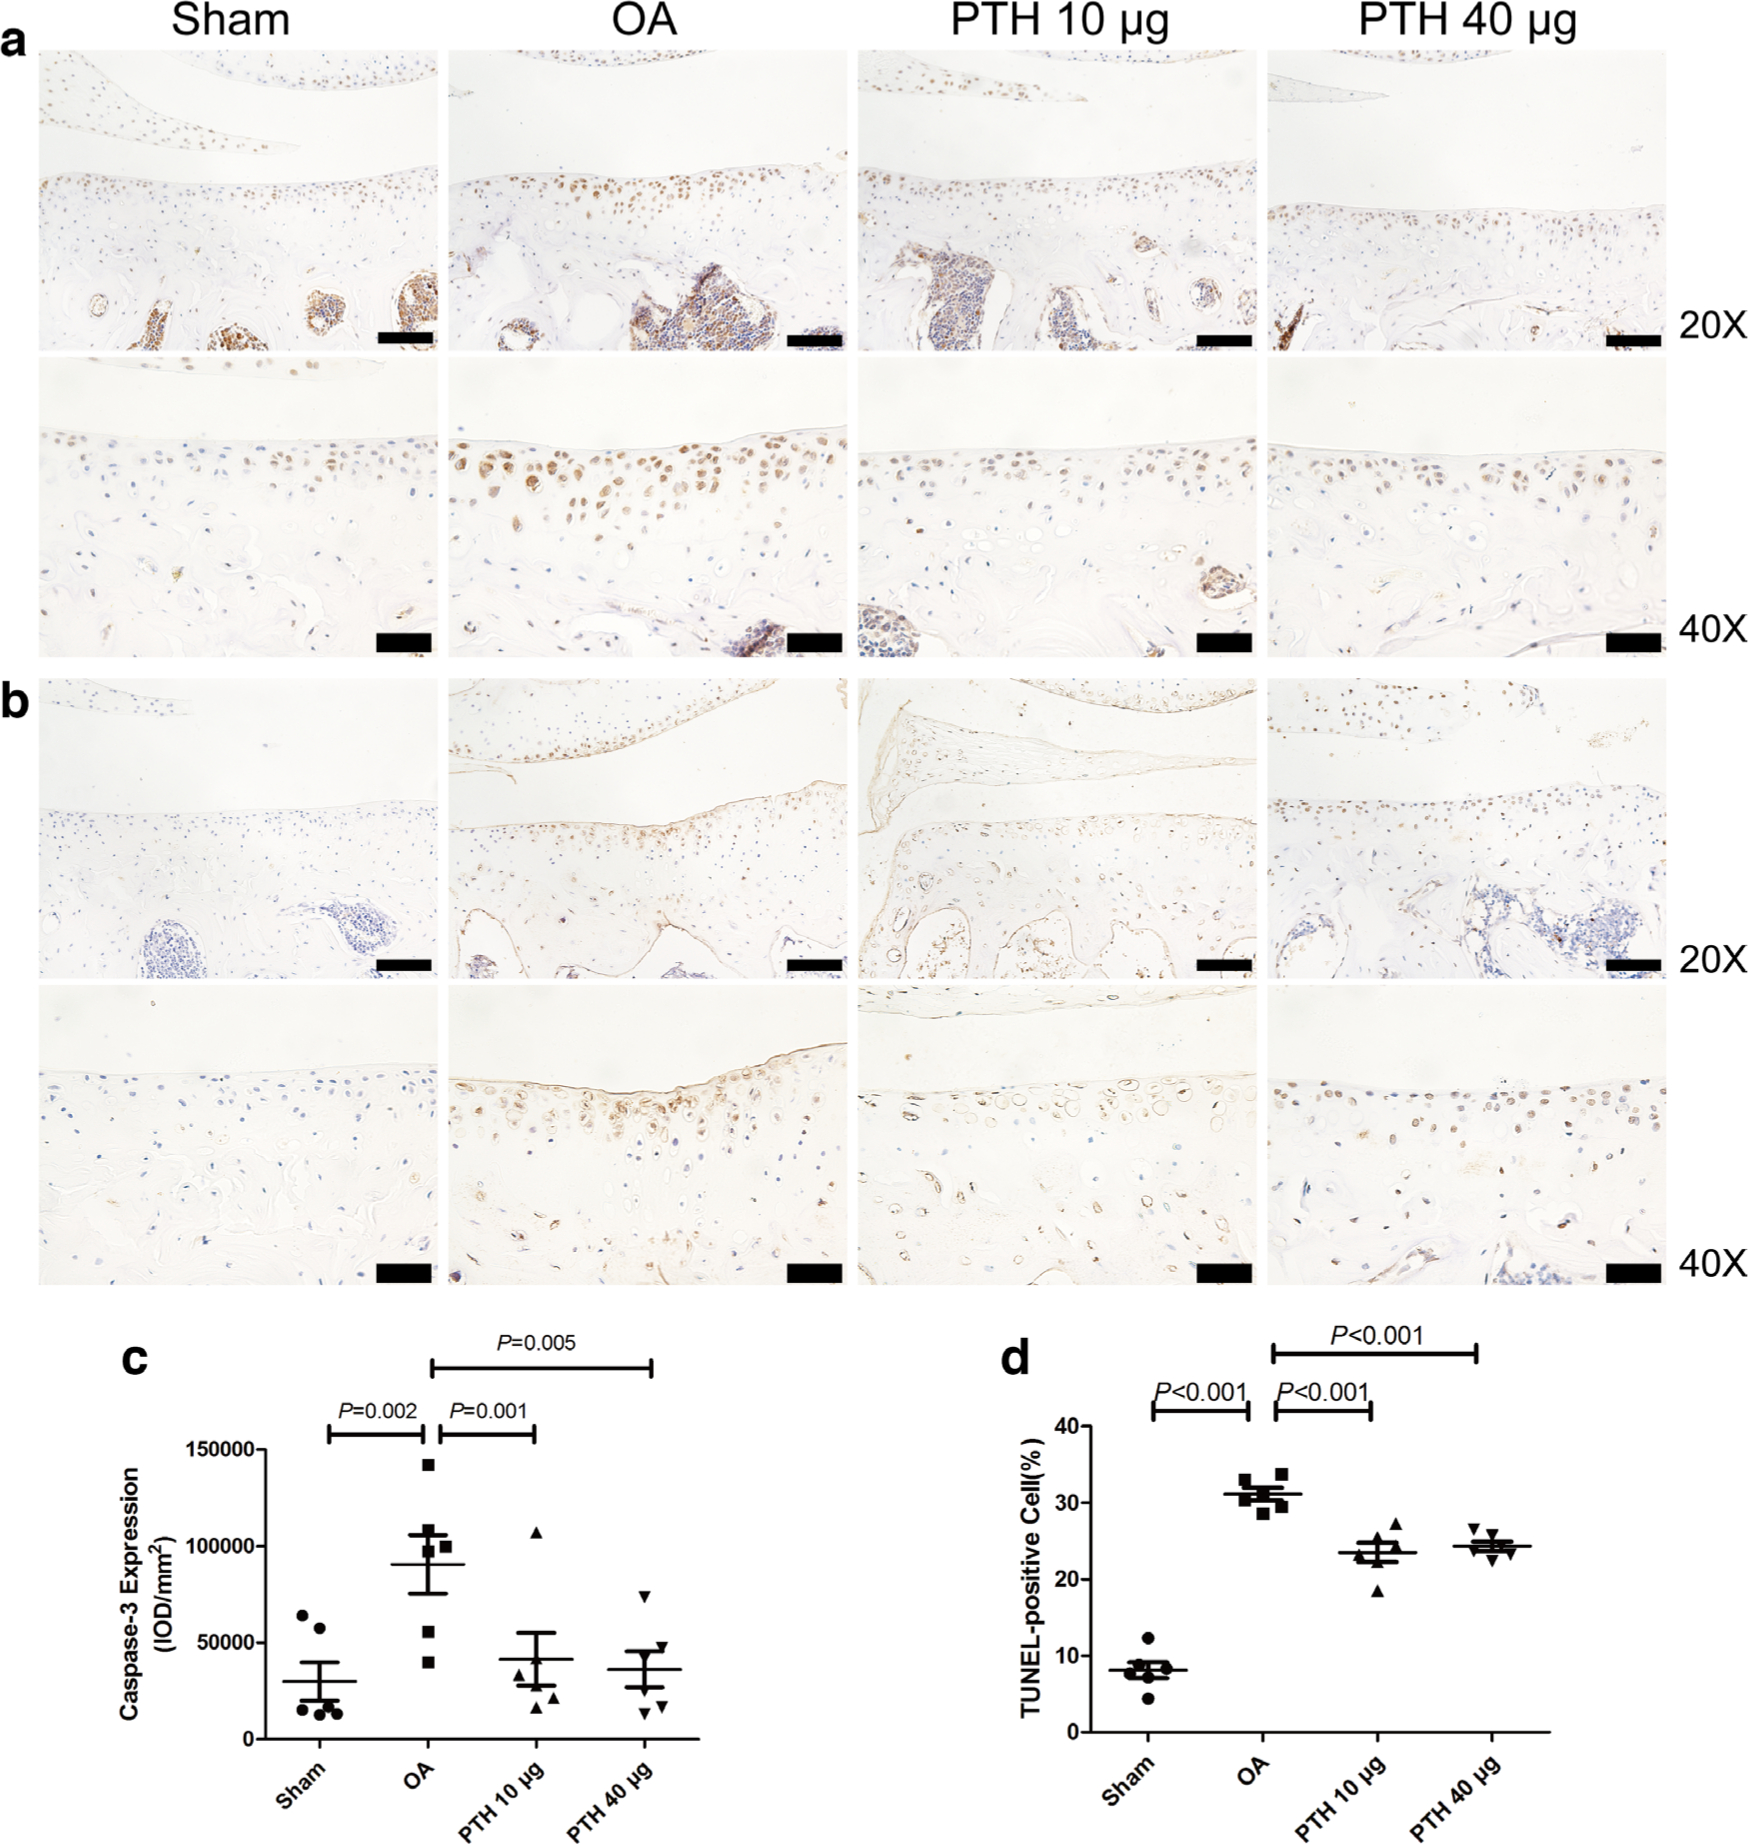
Fig. 6
Photomicrographs of the immunohistochemistry for a) caspase-3 and b) TUNEL staining for cell apoptosis in the cartilage of the medial tibial plateau. c) Intensity of optical density (IOD) values of caspase-3 in different groups. d) The percentage of TUNEL-positive cells in different groups. Data are presented as the mean (SD), all p-values measured using one-way analysis of variance (ANOVA). Thin bars = 100 μm. Thick bars = 50 μm. OA, osteoarthritis; PTH, parathyroid hormone.
In the cartilage, the expression of p-JAK2 (Figures 7b and 7d) was significantly higher in the OA group than that in the Sham, PTH 10 μg, and PTH 40 μg groups (p = 0.034, p = 0.043, and p = 0.048, respectively, all measured with one-way ANOVA). In the OA group, p-STAT3 (Figures 8b and 8d) expression level was higher than that in the Sham group and PTH 10 μg and PTH 40 μg groups (all p < 0.001, one-way ANOVA). The p-JAK2 and p-STAT3 expression levels showed no significant difference between the PTH 10 μg group and PTH 40 μg group (p > 0.05, one-way ANOVA). However, there was no significant difference in the p-JAK2/JAK2 (Figure 7e) and p-STAT3/STAT3 (Figure 8e) ratio among the groups.
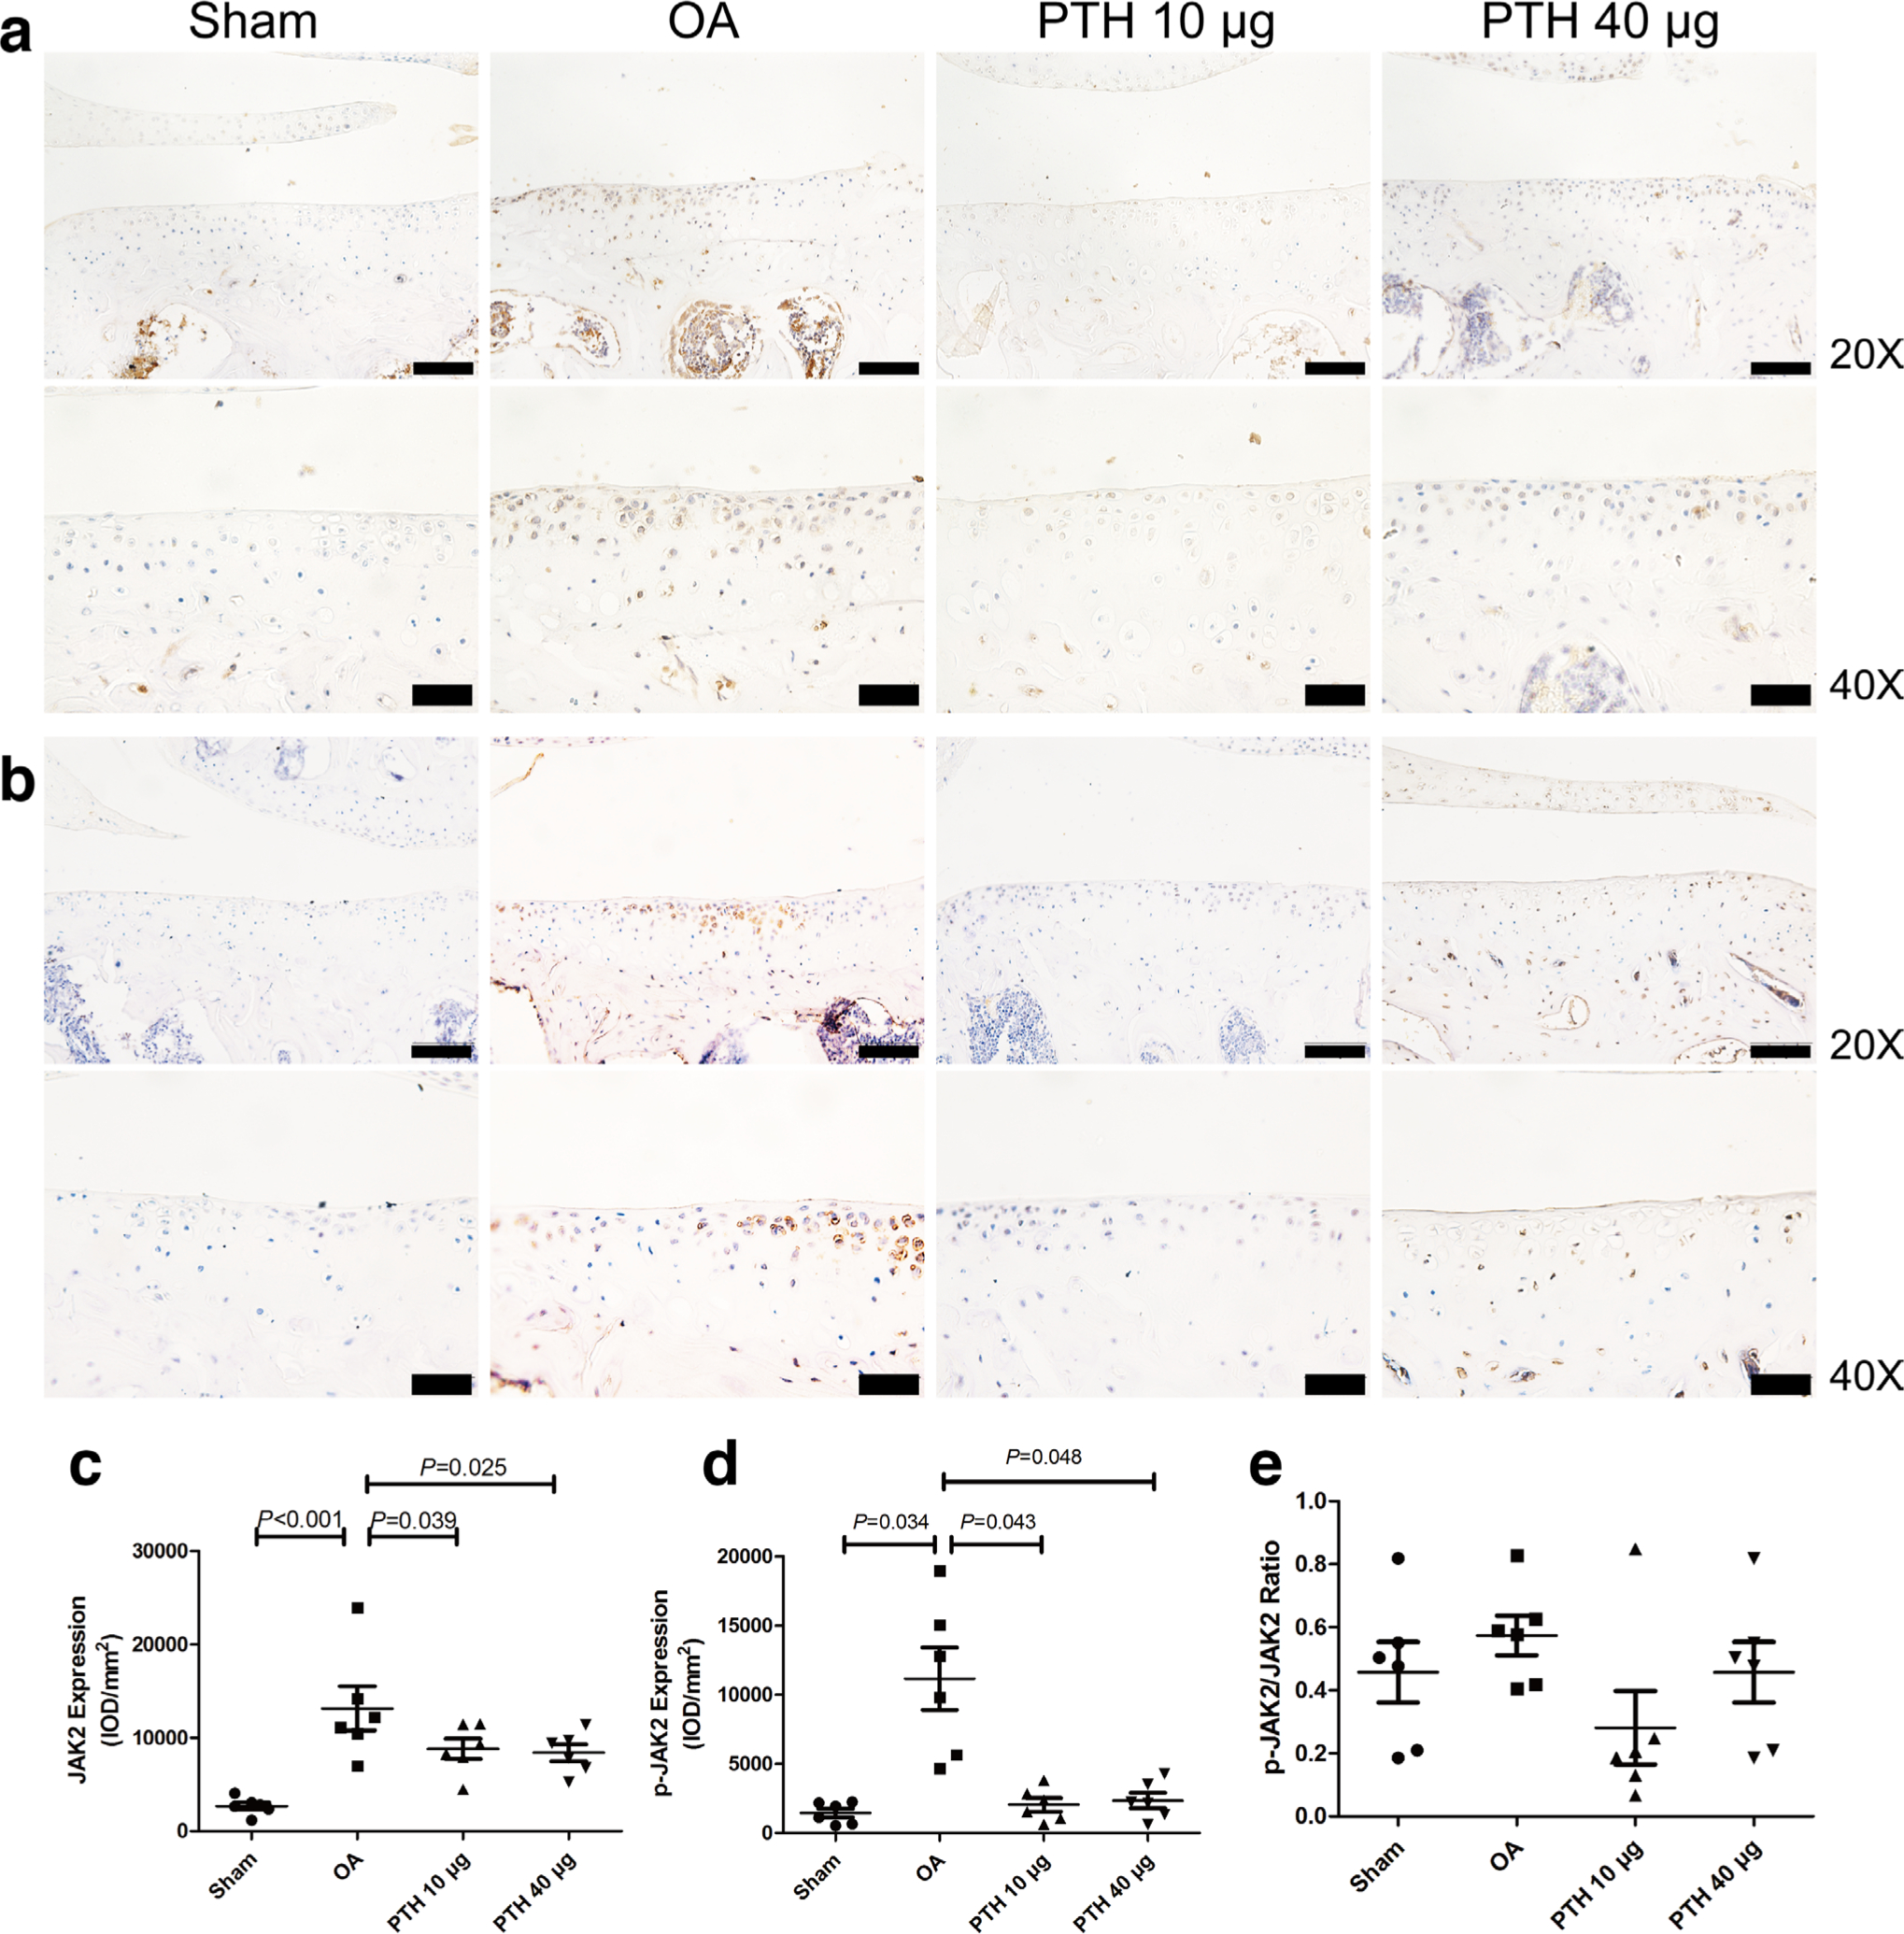
Fig. 7
Immunohistochemical assay for a) JAK2 and b) p-JAK2 in each group. c) Intensity of optical density (IOD) values of JAK2 in different groups. d) IOD values of p-JAK2 in different groups. e) Ratio of p-JAK2/JAK2 in different groups. Data are presented as the mean (SD), all p-values measured using one-way analysis of variance (ANOVA). Thin bars = 100 μm. Thick bars = 50 μm. OA, osteoarthritis; PTH, parathyroid hormone.
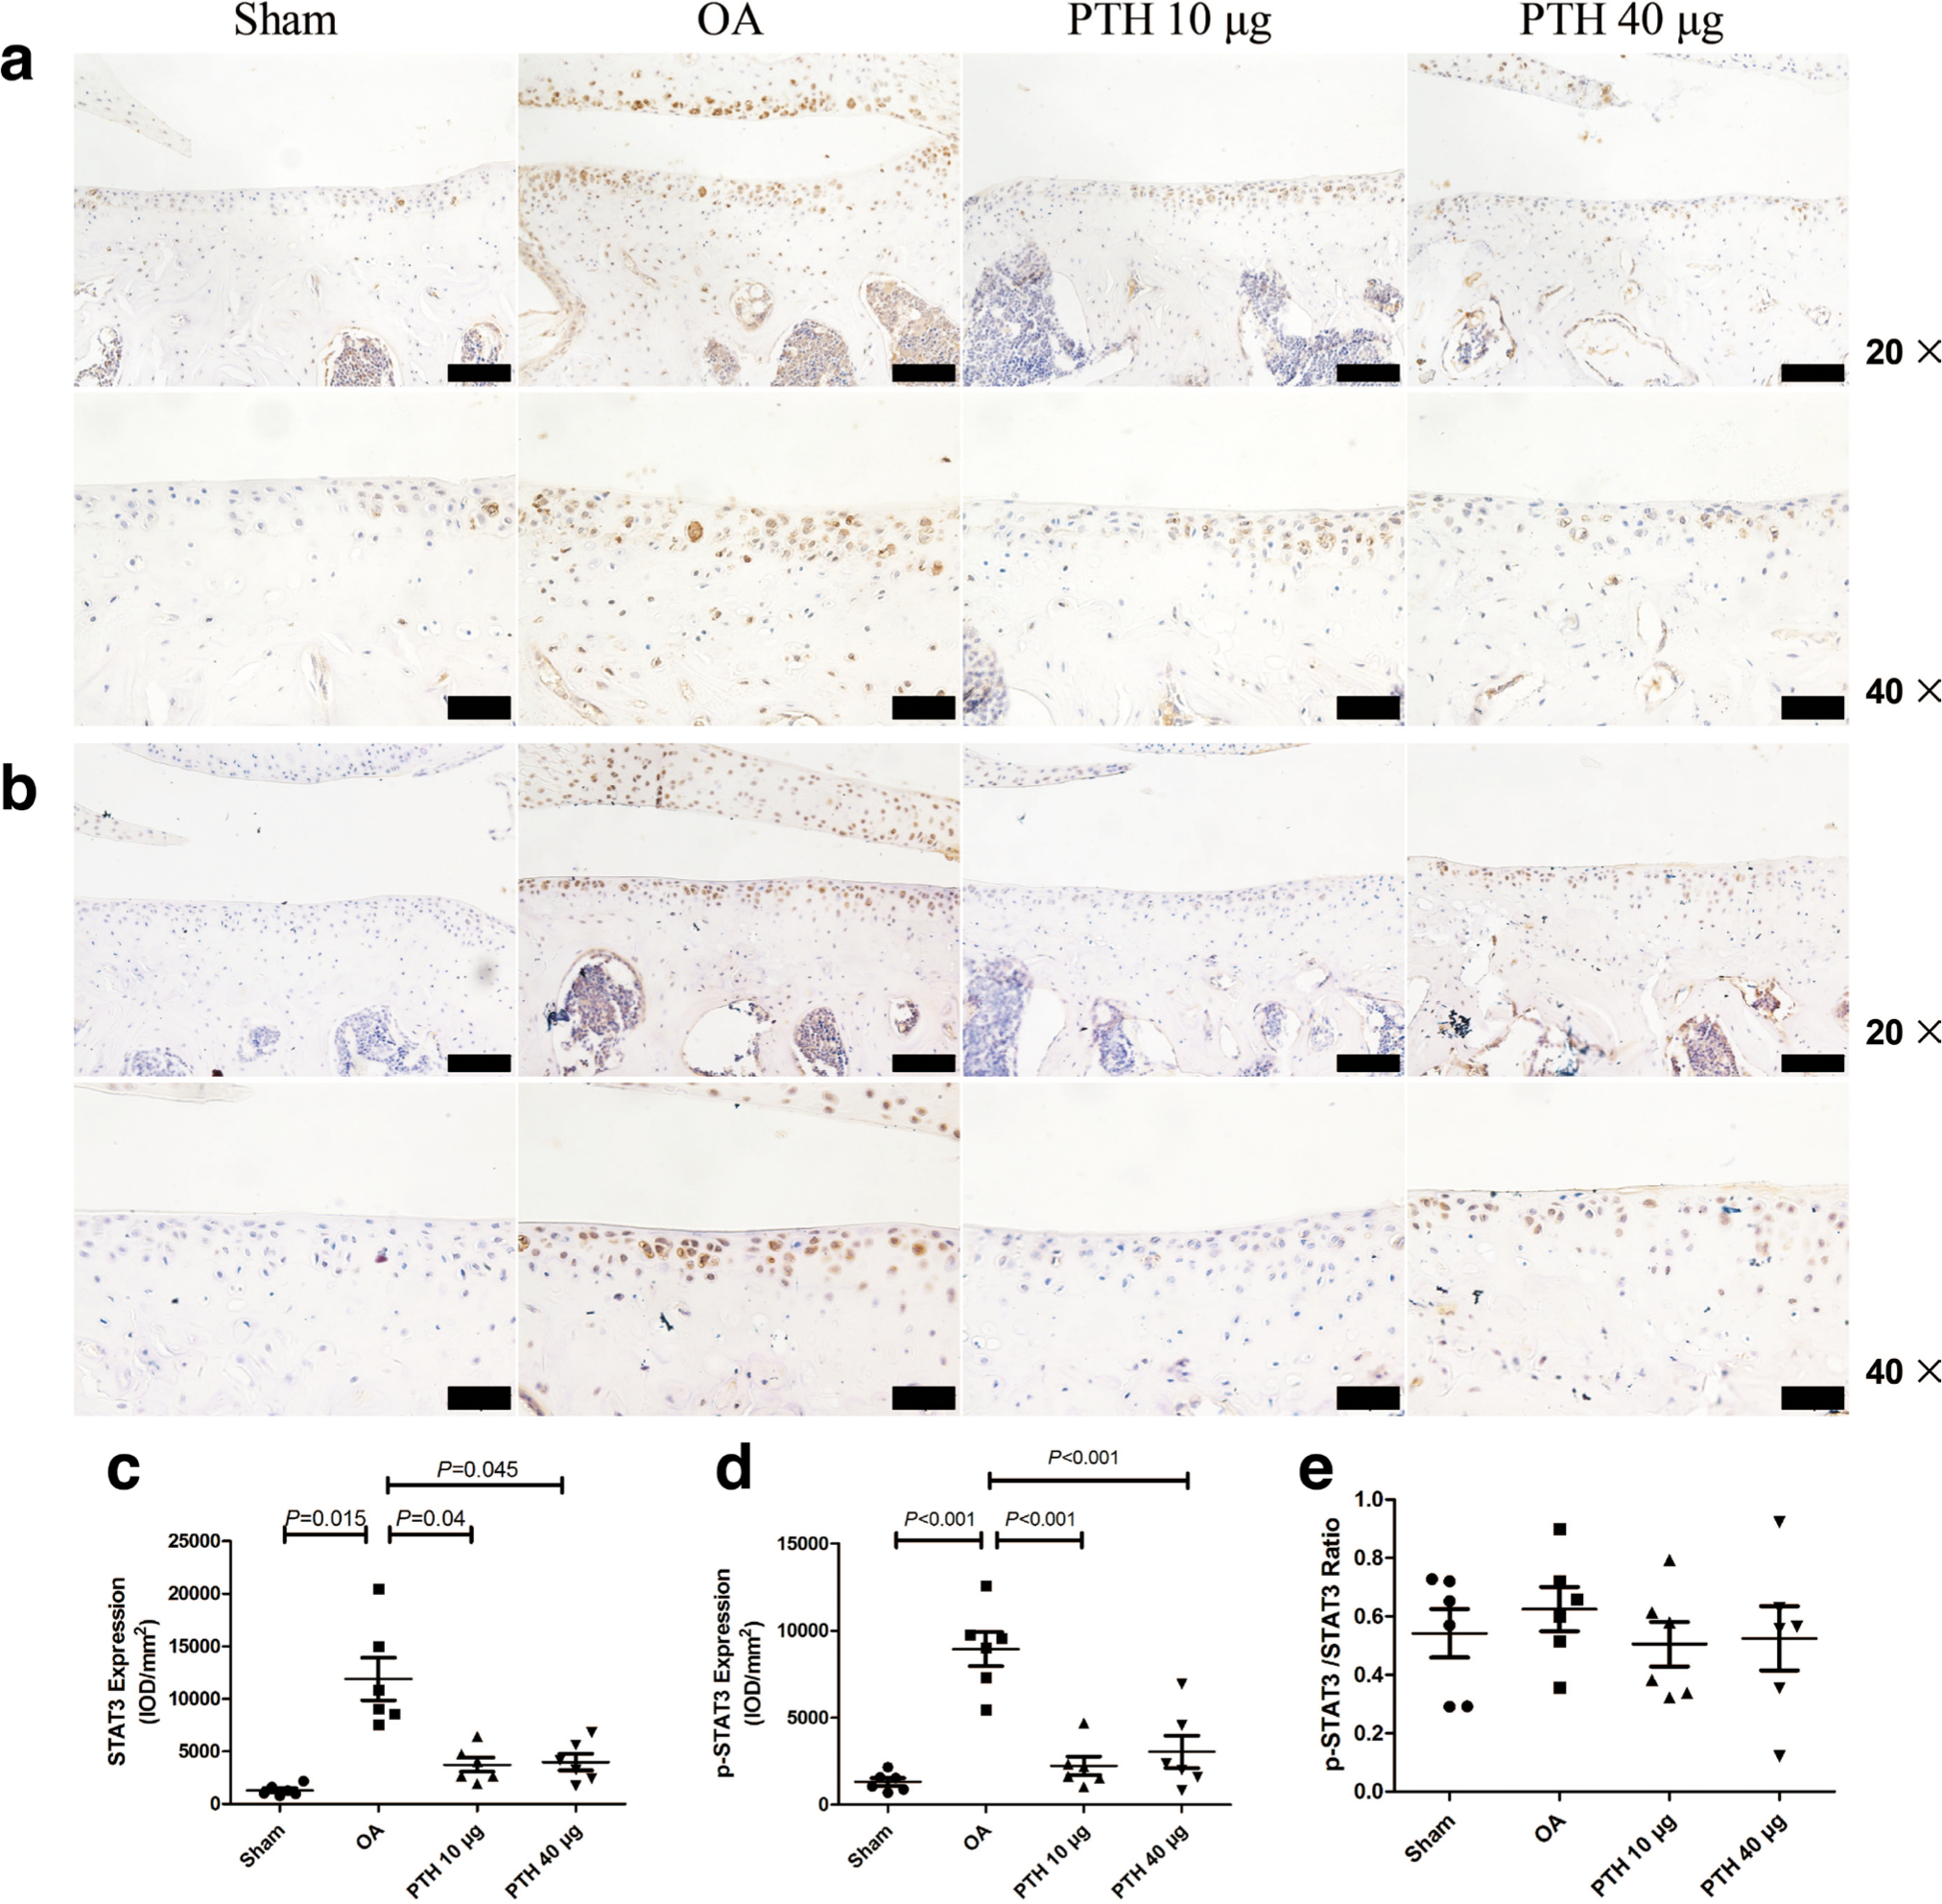
Fig. 8
Immunohistochemical assay for a) STAT3 and b) p-STAT3 in each group. c) Intensity of optical density (IOD) values of STAT3 in different groups. d) IOD values of p-STAT3 in different groups. e) Ratio of p-JAK2/JAK2 in different groups. Data are presented as the mean (SD), all p-values measured using one-way analysis of variance (ANOVA). Thin bars = 100 μm. Thick bars = 50 μm. OA, osteoarthritis; PTH, parathyroid hormone.
In the cartilage, the expression of JAK2 (Figures 7a and 7c) was significantly higher in the OA group than that in the Sham, PTH 10 μg, and PTH 40 μg groups (p < 0.001, p = 0.039, and p = 0.025, respectively, all measured with one-way ANOVA). In the OA group, STAT3 (Figures 8a and 8c) expression level was higher than that in the Sham group and PTH 10 μg and PTH 40 μg groups (p = 0.015, p = 0.04, and p = 0.045, respectively, all measured with one-way ANOVA). The JAK2 and STAT3 expression levels showed no significant difference between the PTH 10 μg group and PTH 40 μg group (p > 0.05, one-way ANOVA).
TUNEL staining
The percentage of TUNEL-positive cells (Figures 6b and 6d) in cartilage was significantly higher in the OA group than that in the Sham group (p < 0.001, one-way ANOVA), but the percentage of TUNEL-positive cells was significantly lower in the PTH 10 μg group or PTH 40 μg group than that in the OA group (both p < 0.001, one-way ANOVA). However, the percentage of apoptotic chondrocytes was not significantly different between the PTH 10 μg and PTH 40 μg groups (p > 0.05, one-way ANOVA).
Micro-CT imaging
Micro-CT imaging is shown in Figure 9a. In the epiphyseal trabeculae, the results indicated that the OA group had significantly less BMD (Figure 9b), BV/TV (Figure 9c), and Tb.Th (Figure 9d) than the Sham group (p = 0.006, p = 0.016, and p = 0.008, respectively, all measured with one-way ANOVA). The PTH 10 μg group displayed significantly higher BMD, BV/TV, and Tb.Th values than those of the OA group (p < 0.001, p < 0.001, and p = 0.001, respectively, all measured with one-way ANOVA). The PTH 40 μg group exhibited higher BMD, BV/TV, and Tb.Th values than those of the OA group (p < 0.001, p < 0.001, and p = 0.001, respectively, all measured with one-way ANOVA). Additionally, in the PTH 40 μg group, the BMD and BV/TV were significantly higher than those in the PTH 10 μg group (p = 0.014 and p = 0.010, respectively, both measured with one-way ANOVA). In contrast, in the OA group, the SMI (Figure 9e) was significantly higher than that in the Sham group, PL group, and PTH 40 μg group (p = 0.001, p < 0.001, and p < 0.001, respectively, all measured with one-way ANOVA). SMI was significantly lower in the PTH 40 μg group than in the PTH 10 μg group (p = 0.001, one-way ANOVA) (Figure 7).
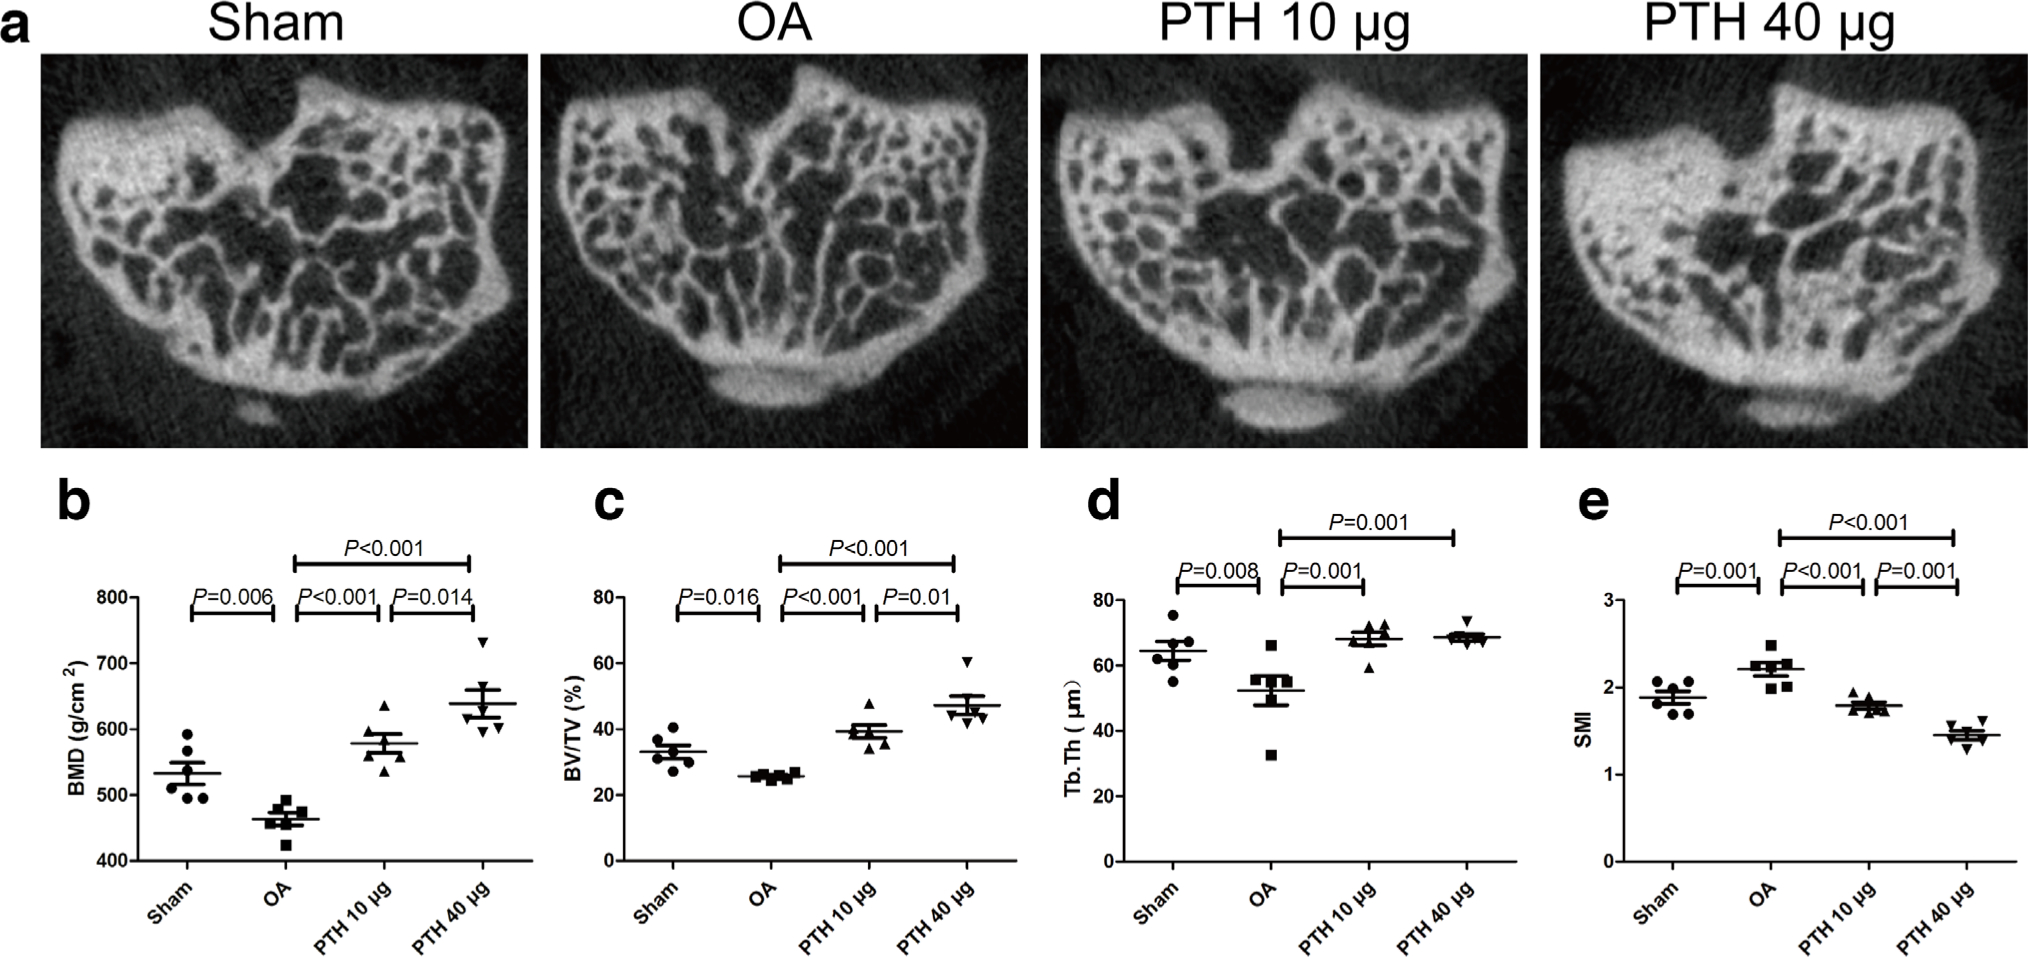
Fig. 9
a) Microcomputed tomography (micro-CT) images of the subchondral bone in each group. b) Bone mineral density (BMD) of the subchondral bone analyzed by micro-CT. c) Bone volume/trabecular volume (BV/TV) of the subchondral bone analyzed by micro-CT. d) Trabecular thickness (Tb.Th) of the subchondral bone analyzed by micro-CT. e) Structure model index (SMI) of the subchondral bone analyzed by micro-CT. Data are presented as the mean (SD), all p-values measured using one-way analysis of variance (ANOVA). OA, osteoarthritis; PTH, parathyroid hormone.
Discussion
In the present study, we found that intermittent injection of PTH (1-34) showed therapeutic effects in a collagenase-induced OA mouse model, resulting from restraining the deterioration of cartilage and maintaining subchondral bone microarchitecture.
Topically, injection of collagenase is one of the most accepted methods to establish an animal model of OA, with mild damage to the articular surface;21,22 as we observed in the present study, no significant difference was found between the OA and Sham groups in the macroscopic score, which is consistent with some previous studies from other groups.21,23 However, further histological analysis indicated the cartilage degeneration in this model, as shown by the markedly higher score in OA animals, regarding the appearance of cartilage upper layer irregularities, reduced chondrocyte density, and toluidine blue staining of the hyaline chondrocyte layer. Additionally, the thickness of calcified cartilage was significantly higher in the OA group than in the Sham group, which is considered to be a deterioration of biomechanical properties and therefore accelerated cartilage degeneration.5
This study proved that in the development of OA, Col-II expression decreased in the cartilage, whereas MMP-13, ADAMTS-4, ADAMTS-5, and caspase-3 expression and the percentage of TUNEL-positive cells increased. These results are consistent with previous studies.1,5,20,24 Col-II is the main component of articular cartilage, and its reduction is the major feature of OA.25–27 MMP-13 and ADAMTS-4 play important roles in the degradation process of cartilage.1,5 Overexpression of caspase-3 can cause chondrocyte apoptosis,28,29 and TUNEL-positive cells were significantly increased.20 Unfortunately, the AGG expression level was not significantly different between any two groups. The loss of AGG is a marker of OA development. However, the relative contribution of ADAMTS and AGG to cartilage destruction during OA has not been completely resolved.30 van Dalen et al31 found that the change in AGG is significantly weaker than that of ADAMTS-4, ADAMTS-5, and MMP-13 in the collagenase-induced OA model. Our present study found a similar result that AGG had an unmarkedly downward trend in the OA group, which may be due to, on the one hand, the above-mentioned relatively weak response to collagenase, which we used a lower dose of in the present study. On the other hand, we only observed these changes in one timepoint at an early stage. Therefore, our results reveal that cartilage degeneration mainly results from enhanced catabolism of cartilage and increased apoptosis of chondrocytes.
Currently, there is a widely accepted point of view that the effect of intermittent PTH (1-34) on OA has an anabolic window.32 Intermittent administration of PTH (1-34) can prevent cartilage degradation and preserve subchondral bone microarchitecture during the anabolic window.1,5 Additionally, the dosage of PTH (1-34) varies considerably among experimental investigations. The effect of different doses of PTH (1-34) on subchondral bone has been studied,8,9 but the effect of different doses of PTH (1-34) on cartilage has rarely been studied. We therefore explored the protective effect of different doses of PTH (1-34) with intermittent administration on cartilage. The clinical dose of PTH (1–34) used for osteoporosis therapy is 20 μg/day.33 In mice, a PTH (1–34) dose of 10 μg/kg/day was similar with 20 μg in patients.33,34 A PTH (1–34) dose of 40 μg/kg/day is commonly used in animal experiments.7,9,35,36 Previous studies have reported that the dose of PTH above 80 μg/kg/day when given intermittently induced hypercalcaemia and resulted in death when given by continuous infusion.35,37,38 Previous studies also reported that intermittent administration of PTH (1-34) (10 or 40 μg/kg/day) increases bone mass and protects the cartilage.34,39 We therefore chose 10 μg/kg/day as the low dose and 40 μg/kg/day as the high dose.
This study demonstrates that PTH (1-34) exhibits protective effects on cartilage in a mouse model. In our study, the histological scores of the PTH 10 μg and PTH 40 μg groups were lower than those of the OA group. In the PTH 10 μg and PTH 40 μg groups, the cartilage surface was barely damaged, and chondrocyte density and interterritorial toluidine blue staining were increased. In addition, PTH (1-34) reduced the thickness of calcified cartilage. In this way, restoration of the calcified cartilage may provide cartilage with greater compressive capacity and show cartilage degradation.5 The above results show that PTH (1-34) has a protective effect on cartilage.
Our results also show that PTH (1-34) significantly increased Col-II expression and reduced MMP-13 and ADAMTS-4 expression in the cartilage of collagenase-induced OA mice. It has been previously reported that the application of PTH (1-34) can prevent the progression of cartilage degradation by increasing Col-II in animal models of OA.1 Previous studies have shown that PTH (1-34) prevents cartilage degradation by inhibiting both ADAMTS-4 and MMP-13 in guinea pigs with spontaneous OA and meniscectomized guinea pigs.5,39 These findings show that PTH (1-34) can protect cartilage by inhibiting catabolism and promoting anabolism in cartilage. Cartilage degeneration caused by chondrocyte apoptosis plays an important role in the development of OA.40 PTH (1-34) treatment reduces articular chondrocyte apoptosis.41,42 Chang et al2 found that the percentage of TUNEL-positive cells was reversed by treatment with PTH (1-34).2 Previous findings indicate that parathyroid hormone-related protein (PTHrP) is related to decreased lipid oxidative damage and caspase-3.43 Dai et al5 proved that PTH (1-34) can decrease caspase-3 expression in chondrocytes. In our study, caspase-3 expression and the percentage of TUNEL-positive cells were significantly inhibited by PTH (1-34). These results indicate that PTH (1-34) can protect the cartilage matrix and chondrocytes.
These findings demonstrated that PTH (1-34), at both low or high doses, could prevent cartilage degeneration in this model by reducing the thickness of calcified cartilage, inhibiting the catabolism of cartilage matrix, and preventing chondrocyte apoptosis. To further confirm whether JAK2/STAT3 signalling is involved in the process by which PTH (1-34) affects the cartilage, we observed the protein expression levels in this model by immunohistochemistry analysis, which showed that p-JAK2, JAK2, p-STAT3, and STAT3 expression increased in articular cartilage after OA. Previous studies have shown that MMPs and ADAMTS are increased in cartilage after STAT3 expression enhancement, and using the selective JAK2 inhibitor AG490 inhibits the increase in MMPs and ADAMTS.13,44 However, as far as we know there is no direct research on the relationship between PTH (1-34) and the JAK2/STAT3 signalling pathway in OA. In the cartilage, the expression of p-JAK2 and p-STAT3 was significantly higher in the OA group than in the control group, and was reversed by PTH treatment, which is consistent with the trend of total JAK2 and STAT3 levels. However, there was no significant difference in the p-JAK2/JAK2 and p-STAT3/STAT3 ratios among the groups. Previous studies have proved that in the development of OA, the expression of p-JAK2 and p-STAT3 was upregulated,13,45 and total JAK2 and STAT3 levels were upregulated too.20,46 Notably, both the upregulation induced by OA and the downregulation induced by PTH (1-34) of total or phosphorylated JAK2 and STAT3 occurred in a parallel manner. We therefore speculate that PTH (1-34) may mainly affect the transcription and translation but not the phosphorylation of JAK2 and STAT3. Therefore, PTH (1-34) may protect cartilage by downregulating p-JAK2/JAK2 and p-STAT3/STAT3 protein levels in parallel firstly and then restraining the expression of MMPs and ADAMTS. However, further molecular studies are needed to prove the exact role of the JAK2/STAT3 signalling pathway during the action of PTH (1-34) on OA. In addition, multiple models of OA are helpful to comprehensively clarify the preventive effect of PTH (1-34) on OA. It is interesting that no significant differences were found between the low-dose and high-dose groups with respect to all these beneficial effects of PTH (1-34) on cartilage in this model. Previous studies proved that in the OA model, the histological score decreased approximately 47% (10 μg/kg/day)34,47 and 43% (40 μg/kg/day) after PTH (1-34) treatment.48 MMP-13 expression decreased by 50% after treatment with different concentrations of PTH (1-34).1,5 These results indicate that in the dosages we chose and used in the above-mentioned studies, the protective effect of PTH (1-34) on the cartilage is not dose-dependent, while further study is needed to uncover the underlying reason.
In the present study, we found that bone loss in the subchondral bone occurred in the OA mice, which was totally prevented by PTH (1-34), with both lower and higher dose. As reported, subchondral bone is closely related to the progression of OA.5,49 Recent observations have suggested that OA is related to early loss of bone owing to increased bone remodelling, then slow turnover leading to densification of the subchondral plate and loss of cartilage, and subchondral densification is a late event in OA.50 Bone loss may place abnormal stress on the cartilage, and the integrity of cartilage or changes in cartilage metabolism are also due to the altered mechanics.51 The present experiments and a previous study support the conclusion that the beneficial effect of PTH (1-34) on cartilage is, at least in part, caused by ameliorating subchondral bone microarchitecture.5,36
In contrast to the effects on cartilage, the positive effect of PTH (1-34) on the epiphyseal trabeculae is dose-dependent. Our result is consistent with the finding that PTH (1-34) dose dependently stimulates bone formation.9 Unparallel effects of different doses of PTH (1-34) on cartilage and subchondral bone degeneration in a collagenase-induced OA model in mice may be mainly due to the tissue-specific difference in blood supply between cartilage and subchondral bone.52 PTH (1-34) could act directly on the subchondral bone as blood supply in subchondral bone is abundant,53 while transport of PTH (1-34) to cartilage was much less as there is no blood vessel in cartilage.54 In addition, the expression of the type 1 PTH/PTHrP receptor (PTH1R) decreases in chondrocytes in animals with OA.55 These reasons may lead to the unparalleled effects of different doses of PTH (1-34) on cartilage and subchondral bone degeneration in a collagenase-induced OA mouse model.
In conclusion, our findings show that intermittent administration of PTH (1-34) displays a protective effect on cartilage and improves the subchondral bone microstructure in the collagenase-induced OA mouse model, and the JAK2/STAT3 signalling pathway may be involved in these effects. This protective effect of PTH (1-34) on this model is dose-dependent in the subchondral bone but not in cartilage.
References
1. Yan JY , Tian FM , Wang WY , et al. Parathyroid hormone (1-34) prevents cartilage degradation and preserves subchondral bone micro-architecture in guinea pigs with spontaneous osteoarthritis . Osteoarthritis Cartilage . 2014 ; 22 ( 11 ): 1869 – 1877 . Crossref PubMed Google Scholar
2. Chang J-K , Chang L-H , Hung S-H , et al. Parathyroid hormone 1-34 inhibits terminal differentiation of human articular chondrocytes and osteoarthritis progression in rats . Arthritis Rheum . 2009 ; 60 ( 10 ): 3049 – 3060 . Crossref PubMed Google Scholar
3. Canalis E , Giustina A , Bilezikian JP . Mechanisms of anabolic therapies for osteoporosis . N Engl J Med . 2007 ; 357 ( 9 ): 905 – 916 . Crossref PubMed Google Scholar
4. Rubin MR , Bilezikian JP . The anabolic effects of parathyroid hormone therapy . Clin Geriatr Med . 2003 ; 19 ( 2 ): 415 – 432 . Crossref PubMed Google Scholar
5. Dai M-W , Chu J-G , Tian F-M , et al. Parathyroid hormone(1-34) exhibits more comprehensive effects than celecoxib in cartilage metabolism and maintaining subchondral bone micro-architecture in meniscectomized guinea pigs . Osteoarthritis Cartilage . 2016 ; 24 ( 6 ): 1103 – 1112 . Crossref PubMed Google Scholar
6. Osagie-Clouard L , Sanghani-Kerai A , Coathup M , et al. The influence of parathyroid hormone 1-34 on the osteogenic characteristics of adipose- and bone-marrow-derived mesenchymal stem cells from juvenile and ovarectomized rats . Bone Joint Res . 2019 ; 8 ( 8 ): 397 – 404 . Crossref PubMed Google Scholar
7. Leder BZ , O'Dea LSL , Zanchetta JR , et al. Effects of abaloparatide, a human parathyroid hormone-related peptide analog, on bone mineral density in postmenopausal women with osteoporosis . J Clin Endocrinol Metab . 2015 ; 100 ( 2 ): 697 – 706 . Crossref PubMed Google Scholar
8. Tsunori K , Sato S , Hasuike A , et al. Effects of intermittent administration of parathyroid hormone on bone augmentation in rat calvarium . Implant Dent . 2015 ; 24 ( 2 ): 142 – 148 . Crossref PubMed Google Scholar
9. Tang Z-L , Bai S , Zhu P-N , et al. An examination of differences in the new bone formation promoted by different doses of recombinant human parathyroid hormone during mandibular distraction osteogenesis . Plast Reconstr Surg . 2016 ; 137 ( 2 ): 347e – 354 . Crossref PubMed Google Scholar
10. Harrington EK , Coon DJ , Kern MF , Svoboda KKH . PTH stimulated growth and decreased Col-X deposition are phosphotidylinositol-3,4,5 triphosphate kinase and mitogen activating protein kinase dependent in avian sterna . Anat Rec . 2010 ; 293 ( 2 ): 225 – 234 . Crossref PubMed Google Scholar
11. Kakar S , Einhorn TA , Vora S , et al. Enhanced chondrogenesis and Wnt signaling in PTH-treated fractures . J Bone Miner Res . 2007 ; 22 ( 12 ): 1903 – 1912 . Crossref PubMed Google Scholar
12. Wu X , Cao L , Li F , et al. Interleukin-6 from subchondral bone mesenchymal stem cells contributes to the pathological phenotypes of experimental osteoarthritis . Am J Transl Res . 2018 ; 10 ( 4 ): 1143 – 1154 . PubMed Google Scholar
13. Latourte A , Cherifi C , Maillet J , et al. Systemic inhibition of IL-6/Stat3 signalling protects against experimental osteoarthritis . Ann Rheum Dis . 2017 ; 76 ( 4 ): 748 – 755 . Crossref PubMed Google Scholar
14. Hayashi S , Fujishiro T , Hashimoto S , et al. p21 deficiency is susceptible to osteoarthritis through STAT3 phosphorylation . Arthritis Res Ther . 2015 ; 17 : 314 . Crossref PubMed Google Scholar
15. ter Huurne M , Schelbergen R , Blattes R , et al. Antiinflammatory and chondroprotective effects of intraarticular injection of adipose-derived stem cells in experimental osteoarthritis . Arthritis Rheum . 2012 ; 64 ( 11 ): 3604 – 3613 . Crossref PubMed Google Scholar
16. Guingamp C , Gegout-Pottie P , Philippe L , et al. Mono-iodoacetate-induced experimental osteoarthritis: a dose-response study of loss of mobility, morphology, and biochemistry . Arthritis Rheum . 1997 ; 40 ( 9 ): 1670 – 1679 . Crossref PubMed Google Scholar
17. Little CB , Smith MM , Cake MA , et al. The OARSI histopathology initiative - recommendations for histological assessments of osteoarthritis in sheep and goats . Osteoarthritis Cartilage . 2010 ; 18 ( Suppl 3 ): S80 – S92 . Crossref PubMed Google Scholar
18. Gou Y , Tian F , Kong Q , et al. Salmon calcitonin attenuates degenerative changes in cartilage and Subchondral bone in lumbar facet joint in an experimental rat model . Med Sci Monit . 2018 ; 24 : 2849 – 2857 . Crossref PubMed Google Scholar
19. Iijima H , Aoyama T , Ito A , et al. Effects of short-term gentle treadmill walking on subchondral bone in a rat model of instability-induced osteoarthritis . Osteoarthritis Cartilage . 2015 ; 23 ( 9 ): 1563 – 1574 . Crossref PubMed Google Scholar
20. Bei M , Tian F , Liu N , et al. A novel rat model of Patellofemoral osteoarthritis due to patella Baja, or low-lying patella . Med Sci Monit . 2019 ; 25 : 2702 – 2717 . Crossref PubMed Google Scholar
21. Botter SM , van Osch GJVM , Waarsing JH , et al. Cartilage damage pattern in relation to subchondral plate thickness in a collagenase-induced model of osteoarthritis . Osteoarthritis Cartilage . 2008 ; 16 ( 4 ): 506 – 514 . Crossref PubMed Google Scholar
22. Blom AB , van Lent PL , Libregts S , et al. Crucial role of macrophages in matrix metalloproteinase-mediated cartilage destruction during experimental osteoarthritis: involvement of matrix metalloproteinase 3 . Arthritis Rheum . 2007 ; 56 ( 1 ): 147 – 157 . Crossref PubMed Google Scholar
23. van Dalen SCM , Kruisbergen NNL , Walgreen B , et al. The role of NOX2-derived reactive oxygen species in collagenase-induced osteoarthritis . Osteoarthritis Cartilage . 2018 ; 26 ( 12 ): 1722 – 1732 . Crossref PubMed Google Scholar
24. Gou Y , Tian F , Dai M , et al. Salmon calcitonin exerts better preventive effects than celecoxib on lumbar facet joint degeneration and long-term tactile allodynia in rats . Bone . 2019 ; 127 : 17 – 25 . Crossref PubMed Google Scholar
25. Zhang M , Egan B , Wang J . Epigenetic mechanisms underlying the aberrant catabolic and anabolic activities of osteoarthritic chondrocytes . Int J Biochem Cell Biol . 2015 ; 67 : 101 – 109 . Crossref PubMed Google Scholar
26. van den Berg WB . Osteoarthritis year 2010 in review: pathomechanisms . Osteoarthritis Cartilage . 2011 ; 19 ( 4 ): 338 – 341 . Crossref PubMed Google Scholar
27. Lin EA , Liu C-J . The role of ADAMTSs in arthritis . Protein Cell . 2010 ; 1 ( 1 ): 33 – 47 . Crossref PubMed Google Scholar
28. Salvesen GS . Caspases: opening the boxes and interpreting the arrows . Cell Death Differ . 2002 ; 9 ( 1 ): 3 – 5 . Crossref PubMed Google Scholar
29. Xue H , Tu Y , Ma T , et al. Lactoferrin inhibits IL-1β-induced chondrocyte apoptosis through AKT1-Induced CREB1 activation . Cell Physiol Biochem . 2015 ; 36 ( 6 ): 2456 – 2465 . Crossref PubMed Google Scholar
30. Verma P , Dalal K . ADAMTS-4 and ADAMTS-5: key enzymes in osteoarthritis . J Cell Biochem . 2011 ; 112 ( 12 ): 3507 – 3514 . Crossref PubMed Google Scholar
31. van Dalen SCM , Blom AB , Slöetjes AW , et al. Interleukin-1 is not involved in synovial inflammation and cartilage destruction in collagenase-induced osteoarthritis . Osteoarthritis Cartilage . 2017 ; 25 ( 3 ): 385 – 396 . Google Scholar
32. Osagie-Clouard L , Sanghani A , Coathup M , et al. Parathyroid hormone 1-34 and skeletal anabolic action: the use of parathyroid hormone in bone formation . Bone Joint Res . 2017 ; 6 ( 1 ): 14 – 21 . Crossref PubMed Google Scholar
33. Komatsu DE , Brune KA , Liu H , et al. Longitudinal in vivo analysis of the region-specific efficacy of parathyroid hormone in a rat cortical defect model . Endocrinology . 2009 ; 150 ( 4 ): 1570 – 1579 . Crossref PubMed Google Scholar
34. Bellido M , Lugo L , Roman-Blas JA , et al. Improving subchondral bone integrity reduces progression of cartilage damage in experimental osteoarthritis preceded by osteoporosis . Osteoarthritis Cartilage . 2011 ; 19 ( 10 ): 1228 – 1236 . Crossref PubMed Google Scholar
35. Hock JM , Gera I . Effects of continuous and intermittent administration and inhibition of resorption on the anabolic response of bone to parathyroid hormone . J Bone Miner Res . 1992 ; 7 ( 1 ): 65 – 72 . Crossref PubMed Google Scholar
36. Bellido M , Lugo L , Roman-Blas JA , et al. Subchondral bone microstructural damage by increased remodelling aggravates experimental osteoarthritis preceded by osteoporosis . Arthritis Res Ther . 2010 ; 12 ( 4 ): R152 . Crossref PubMed Google Scholar
37. Gunness-Hey M , Hock JM . Increased trabecular bone mass in rats treated with human synthetic parathyroid hormone . Metab Bone Dis Relat Res . 1984 ; 5 ( 4 ): 177 – 181 . Crossref PubMed Google Scholar
38. Hock JM , Gera I , Fonseca J , Raisz LG . Human parathyroid hormone-(1-34) increases bone mass in ovariectomized and orchidectomized rats . Endocrinology . 1988 ; 122 ( 6 ): 2899 – 2904 . Crossref PubMed Google Scholar
39. Sampson ER , Hilton MJ , Tian Y , et al. Teriparatide as a chondroregenerative therapy for injury-induced osteoarthritis . Sci Transl Med . 2011 ; 3 ( 101 ): 101ra93 . Crossref PubMed Google Scholar
40. Chen Q , Zhang B , Yi T , Xia C . Increased apoptosis in human knee osteoarthritis cartilage related to the expression of protein kinase B and protein kinase Cα in chondrocytes . Folia Histochem Cytobiol . 2012 ; 50 ( 1 ): 137 – 143 . Google Scholar
41. Fu X , Wang W , Zhang L . [Progress of parathyroid hormone and parathyroid hormone-related protein on normal and osteoarthritis cartilages] . Zhongguo Xiu Fu Chong Jian Wai Ke Za Zhi . 2011 ; 25 ( 3 ): 299 – 302 . Article in ChinesePubMed Google Scholar
42. Chang L-H , Wu S-C , Chen C-H , et al. Parathyroid hormone 1-34 reduces dexamethasone-induced terminal differentiation in human articular chondrocytes . Toxicology . 2016 ; 368-369 : 116 – 128 . Crossref PubMed Google Scholar
43. Portal-Núñez S , Ardura JA , Lozano D , et al. Parathyroid hormone-related protein exhibits antioxidant features in osteoblastic cells through its N-terminal and osteostatin domains . Bone Joint Res . 2018 ; 7 ( 1 ): 58 – 68 . Crossref PubMed Google Scholar
44. Behera AK , Thorpe CM , Kidder JM , et al. Borrelia burgdorferi-induced expression of matrix metalloproteinases from human chondrocytes requires mitogen-activated protein kinase and Janus kinase/signal transducer and activator of transcription signaling pathways . Infect Immun . 2004 ; 72 ( 5 ): 2864 – 2871 . Crossref PubMed Google Scholar
45. Qiao Z , Tang J , Wu W , Tang J , Liu M . Acteoside inhibits inflammatory response via JAK/STAT signaling pathway in osteoarthritic rats . BMC Complement Altern Med . 2019 ; 19 ( 1 ): 264 . Crossref PubMed Google Scholar
46. Huang C-Y , Lai K-Y , Hung L-F , et al. Advanced glycation end products cause collagen II reduction by activating Janus kinase/signal transducer and activator of transcription 3 pathway in porcine chondrocytes . Rheumatology . 2011 ; 50 ( 8 ): 1379 – 1389 . Crossref PubMed Google Scholar
47. Orth P , Cucchiarini M , Zurakowski D , et al. Parathyroid hormone [1-34] improves articular cartilage surface architecture and integration and subchondral bone reconstitution in osteochondral defects in vivo . Osteoarthritis Cartilage . 2013 ; 21 ( 4 ): 614 – 624 . Google Scholar
48. Chen C-H , Ho M-L , Chang L-H , et al. Parathyroid hormone-(1-34) ameliorated knee osteoarthritis in rats via autophagy . J Appl Physiol . 2018 ; 124 ( 5 ): 1177 – 1185 . Crossref PubMed Google Scholar
49. Sun Y , Kiraly AJ , Sun AR , et al. Effects of a phosphocitrate analogue on osteophyte, subchondral bone advance, and bone marrow lesions in Hartley guinea pigs . Bone Joint Res . 2018 ; 7 ( 2 ): 157 – 165 . Crossref PubMed Google Scholar
50. Burr DB , Gallant MA . Bone remodelling in osteoarthritis . Nat Rev Rheumatol . 2012 ; 8 ( 11 ): 665 – 673 . Crossref PubMed Google Scholar
51. Henak CR , Kapron AL , Anderson AE , et al. Specimen-specific predictions of contact stress under physiological loading in the human hip: validation and sensitivity studies . Biomech Model Mechanobiol . 2014 ; 13 ( 2 ): 387 – 400 . Crossref PubMed Google Scholar
52. Crane JL , Cao X . Bone marrow mesenchymal stem cells and TGF-β signaling in bone remodeling . J Clin Invest . 2014 ; 124 ( 2 ): 466 – 472 . Crossref PubMed Google Scholar
53. Lu J , Zhang H , Cai D , et al. Positive-feedback regulation of subchondral H-type vessel formation by chondrocyte promotes osteoarthritis development in mice . J Bone Miner Res . 2018 ; 33 ( 5 ): 909 – 920 . Crossref PubMed Google Scholar
54. Ebihara G , Sato M , Yamato M , et al. Cartilage repair in transplanted scaffold-free chondrocyte sheets using a minipig model . Biomaterials . 2012 ; 33 ( 15 ): 3846 – 3851 . Crossref PubMed Google Scholar
55. Becher C , Szuwart T , Ronstedt P , et al. Decrease in the expression of the type 1 PTH/PTHrP receptor (PTH1R) on chondrocytes in animals with osteoarthritis . J Orthop Surg Res . 2010 ; 5 : 28 . Crossref PubMed Google Scholar
Author contributions
L. Shao: Wrote the manuscript, Conducted the experiment.
Y. Gou: Conducted the experiment, Analyzed the data.
J. Fang: Conducted the experiment, Analyzed the data.
Y. Hu: Conducted the experiment, Analyzed the data.
Q. Lian: Conducted the experiment, Analyzed the data.
Y. Zhang: Conducted the experiment, Analyzed the data.
Y. Wang: Conducted the experiment, Analyzed the data.
F. Tian: Conducted the experiment, Edited the manuscript.
L. Zhang: Designed the experiment, Edited the manuscript.
L-t. Shao and F-m. Tian are co-first authors.
Funding statement
The study was supported by the Natural Science Foundation of Hebei Province (H2016209176; H2019209550), the National Natural Science Foundation of China (NSFC 31671235 and 81874029), the Youth Talent Support Program of Hebei Province (JI-2016-10), and the One-Hundred Innovative Talents Support Fundation of Hebei Province (JJK-2019-14). No benefits in any form have been received or will be received from a commercial party related directly or indirectly to the subject of this article.
ICMJE COI statement
None declared.
Acknowledgements
All the authors thank Hong Xu and Ming-jian Bei for providing technical support during the data analysis.
Ethical review statement
Approval was obtained from the Institutional Animal Care and Use Committee of North China University of Science and Technology (LX2019034), Tangshan, China.
Supplementary material
Text describing the quantification methods related to the histology, immunohistochemical assessments, and TUNEL staining conducted in this study.
© 2020 Author(s) et al. This is an open-access article distributed under the terms of the Creative Commons Attribution Non-Commercial No Derivatives (CC BY-NC-ND 4.0) licence, which permits the copying and redistribution of the work only, and provided the original author and source are credited. See https://creativecommons.org/licenses/by-nc-nd/4.0/.
