


Abstract
Objectives
An important measure for the diagnosis and monitoring of knee osteoarthritis is the minimum joint space width (mJSW). This requires accurate alignment of the x-ray beam with the tibial plateau, which may not be accomplished in practice. We investigate the feasibility of a new mJSW measurement method from stereo radiographs using 3D statistical shape models (SSM) and evaluate its sensitivity to changes in the mJSW and its robustness to variations in patient positioning and bone geometry.
Materials and Methods
A validation study was performed using five cadaver specimens. The actual mJSW was varied and images were acquired with variation in the cadaver positioning. For comparison purposes, the mJSW was also assessed from plain radiographs. To study the influence of SSM model accuracy, the 3D mJSW measurement was repeated with models from the actual bones, obtained from CT scans.
Results
The SSM-based measurement method was more robust (consistent output for a wide range of input data/consistent output under varying measurement circumstances) than the conventional 2D method, showing that the 3D reconstruction indeed reduces the influence of patient positioning. However, the SSM-based method showed comparable sensitivity to changes in the mJSW with respect to the conventional method. The CT-based measurement was more accurate than the SSM-based measurement (smallest detectable differences 0.55 mm versus 0. 82 mm, respectively).
Conclusion
The proposed measurement method is not a substitute for the conventional 2D measurement due to limitations in the SSM model accuracy. However, further improvement of the model accuracy and optimisation technique can be obtained. Combined with the promising options for applications using quantitative information on bone morphology, SSM based 3D reconstructions of natural knees are attractive for further development.
Cite this article: E. A. van IJsseldijk, E. R. Valstar, B. C. Stoel, R. G. H. H. Nelissen, N. Baka, R. van’t Klooster, B. L. Kaptein. Three dimensional measurement of minimum joint space width in the knee from stereo radiographs using statistical shape models. Bone Joint Res 2016;320–327. DOI: 10.1302/2046-3758.58.2000626.
Article focus
-
A new method is proposed to measure the knee minimum space joint width (mJSW) from planar imaging using a 3D reconstruction.
-
A validation is done using a cadaver experiment in which the measurement sensitivity and accuracy is compared with the conventional measurement.
Key messages
-
Due to a modelling error, the method proposed is not a substitute for the conventional mJSW measurement.
-
Further development on more accurate modelling and optimisation techniques is recommended to overcome this limitation.
Strengths and limitations
-
Innovative study that employs statistical shape models and reconstruction techniques to enable model-based measurements of the knee in planar radiographs.
-
Validation is done against the conventional measurement to immediately assess improvement in accuracy and reproducibility.
-
A limited number of cadavers were used, due to which shape-specific characteristics have a large influence over the general outcome.
Introduction
Osteoarthritis (OA) of the knee imposes a major burden on health care with a reported prevalence of more than 18% in the 65 years to 74 years age group in the European Union.1 OA is associated with cartilage degeneration and loss, joint inflammation and swelling of the joint. Patients experience pain, stiffness and limited mobility.2
OA progression is frequently evaluated using plain radiographs, as they are low cost and readily available. A variety of features are used to assess the stage of OA, such as the appearance of osteophytes and subchondral sclerosis.3,4 Cartilage loss associated with OA is estimated by detecting joint space narrowing (JSN). This is measured based on longitudinal changes in the minimum joint space width (mJSW), i.e., the shortest visible distance between the femoral condyle and the tibial plateau.
A limitation of plain radiographs is that measurements are conducted in projection views that are prone to parallax effects. As a result, alignment of the x-ray beam with the surface of the medial tibial plateau (MTP) is crucial in order to obtain a reliable reading of the joint space.5,6 Standardisation protocols have been developed to optimise alignment, such as the fixed-flexion (FF) view, the metatarsophalangeal view and the modified Lyon Schuss view.7,8
An alternative measurement approach could be to reconstruct the 3D bone geometry around the knee joint from planar images. This reconstruction has the advantage that geometric measurements such as the mJSW are invariant to the projection angle. This reduces the influence of variation in patient positioning or bone geometry and improves the accuracy and precision of the measurement.
We therefore developed a technique, in which this 3D reconstruction is created from 3D shape models of the tibia and femur and 2D/3D matching in Roentgen stereophotogrammetric analysis (RSA).9,10 Afterwards, the mJSW between the 3D models is measured with a similar technique used for the measurement of polyethylene wear in total knee prostheses.11 With this technique, the condyles of the tibia model are retrieved and the shortest perpendicular distance to the femoral model is measured. A particular challenge of this 3D reconstruction is that patient-specific 3D models of the tibia and femur are not readily available. To solve this, 3D statistical shape models (SSMs) of the tibia and femur were developed. An SSM is a deformable model that incorporates shape variations of an object class from a training set of examples. These models could be used to produce accurate reconstructions of 3D patient-specific bone shapes based on 2D image information.12
In this study, the feasibility of this newly developed mJSW measurement technique was investigated. A validation experiment was conducted using cadaver specimens, for which the actual mJSW could be varied using a micromanipulator. With this experiment the accuracy and robustness of variations in knee positioning and bone geometry were assessed. For comparison, the mJSW was also measured in conventional plain radiographs with optimised medial tibial plateau alignment, using an image-based semi-automatic measurement technique.13 To study the influence of model accuracy, the 3D mJSW measurement was repeated with bone models obtained from CT scans and with the SSMs.
Materials and Methods
Data
In total, five human, cadaveric legs with no visible pathology were selected from the Department of Anatomy of the Leiden University Medical Centre (Table I). All ligaments and soft tissues including cartilage were dissected so that only the bare tibia and femur remained.
Table I.
Main characteristics of the cadaveric specimen
| Index | Gender | Age (yrs) | Leg side |
|---|---|---|---|
| 1 | Female | 91 | Right |
| 2 | Male | 98 | Right |
| 3 | Female | 63 | Right |
| 4 | Female | 93 | Left |
| 5 | Male | 84 | Right |
Models-3D CT models from cadaver bones
3D surface models of the cadaveric bones were created from helical CT scans (Toshiba Aquilion 64, Toshiba Medical Systems Ltd., Tokyo, Japan). The bones were arranged in such a way that their long axes were aligned parallel to the CT table. The bones were separated using foam padding in order to simplify the digital delineation of the bones. The scans were obtained at 120 kV and 130 mA with a slice thickness of 1.0 mm and a pitch of 0.8 mm per revolution. The scans had a resolution of 512 × 512 × 641 voxels with a voxel size of 0.78 × 0.78 × 0.8 mm.
Image segmentation was employed using Amira software (FEI Visualization Science Group, Bordeaux, France). A voxel mask was created to separate the bones from the background in the CT images using a threshold-based approach. The mask was converted into a triangulated surface model using a marching cube algorithm.14 The mean triangle edge length of the models was 1.7 mm.
Models-statistical shape models
An SSM is a deformable model of shape that learns the mean shape and likely shape variations of an object class based on a training set. It can generate new shapes using the formula,
In this work two SSMs were used to model the distal femoral and proximal tibial bones, truncated to the region near the knee joint (each approximately 12 cm in length). The two models originate from a previous study where they are described in detail.16 The training sets consisted of 62 polygonal surface models (62 femurs and 62 tibias) that were created from CT data using a level-set segmentation. Correspondence in the training sets was achieved using a non-rigid registration with the Elastix software.17 Note that the five cadaver bones from this study are not included in the training set.
The eigenvector sets of the SSMs were truncated so that only those modes remained that describe 95% of the eigenvalue sum. For both models 33 modes of variation remained. For each mode j, the corresponding shape parameter bj was allowed to vary between three times the standard deviation (sd) of the corresponding eigenvalue (-3SDj ≤ bj ≤ 3SDj) when generating new shapes.
To test the goodness of fit, the models were fitted to each of the cadaver bones using 3D/3D matching and the root mean square point-to-surface distance was computed. The root mean square point-to-surface distances ranged between 0.49 mm and 0.74 mm, which indicates that results are similar to earlier studies using SSMs.16
mJSW measurement methods
The mJSW measurement methods include the SSM-based measurement, the conventional 2D measurement and the CT based measurement (Fig. 1).

Fig. 1
Schematic view of the intermediate steps of the measurement methods. The steps start with the original images and end with the feature that is used to compute the mJSW. *The 3D reconstruction step also includes the model optimisation, which differs between the SSM-based and CT-based measurements.
mJSW measurement methods-SSM-based measurement
The SSM-based measurement is conducted using RSA image pairs. In essence, a 3D reconstruction of the femur and tibia is created, in which the mJSW is measured.
First, image calibration and edge delineation are done using a standard analysis in Model-based RSA software (v4.0, LUMC, Leiden, Netherlands). In this analysis, candidate edges are detected with a canny-edge-detection algorithm and a selection is made semi-automatically. To avoid correspondence problems, only those edges were selected that a) represented the outer object contours and b) belonged to the region that the SSM could represent (i.e. the distal part of the femur and proximal part of the tibia).
The next step is to optimise the shape parameters as well as the pose parameters of the tibiae and femora. This optimisation step is done in MATLAB (R2011a, Mathworks, Natick, Massachusetts) using a 2D/3D matching algorithm. Validation of this algorithm in previous work found a root-mean-square error of 1.86 mm (sd 0.29) for the femoral model.18 The tibial bone was not included in this experiment.
Lastly, the mJSW is computed as the minimum distance between the tibia and the femur model. This distance is measured in the direction perpendicular to a 0.2 mm by 0.2 mm measurement grid residing in the transverse plane beneath the medial condyle (Fig. 2). The construction of the measurement grid and the coordinate system of the tibia are based on three landmark regions manually defined on the tibial SSM model. As these regions transform with the shape optimisation, this manual procedure is required only once.
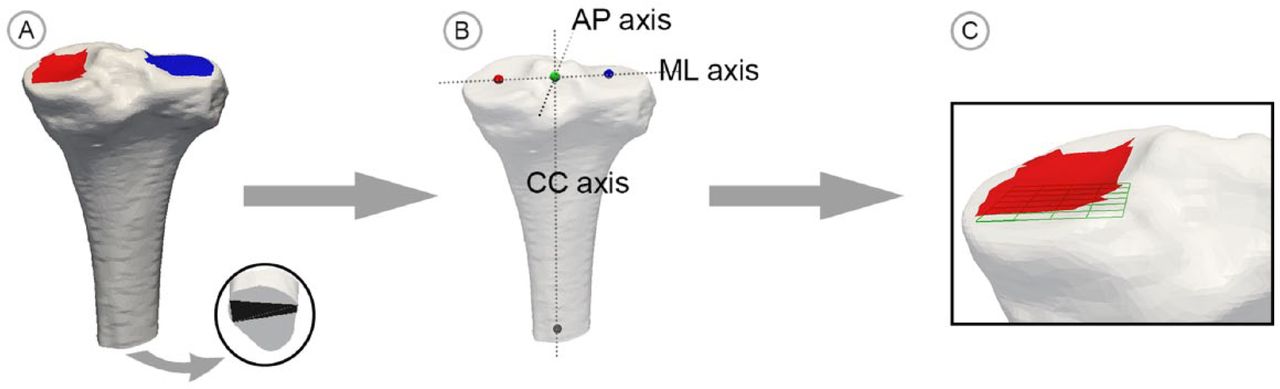
Fig. 2
Illustration of the grid construction process; a) three tibia surfaces areas are selected by the user; b) the geometric means of these locations are used to define the coordinate system; c) the measurement grid is constructed beneath the medial condylar surface area aligned with the coordinate system.
mJSW measurement methods-2D measurement
The 2D measurement was performed with an automatic technique which has been validated for mJSW measurements in hand radiographs.19,20 The smallest detectible difference (SDD = 1.96 × sd) ranged between 0.05 mm and 0.354 mm depending on the joint shape.13 This technique was adopted for the current measurement in terms of image contrast and joint size. Hereto, the proximal (femoral) and distal (tibial) margins of the medial knee joint are delineated using a semi-automatically algorithm specialised for these structures.13 The user selects the centre point of the medial tibial plateau in the image and the algorithm returns the edges of the margins in a 20 mm range. Optionally, the user can provide additional guiding points to correct these edges manually. The shortest perpendicular distance within the interval of delineation divided by image magnification was stored as the mJSW.
mJSW measurement methods-CT-based measurement
A CT-based measurement was used to study the influence of model accuracy. This measurement used models based on CT scans instead of the SSM models. The calibration and edge selection for the CT-based measurement are similar to the SSM-based measurement. In the 2D/3D matching step however, the pose parameters (position, orientation, isotropic scale) of the CT models of the tibiae and femora are optimised using the default 2D/3D matching algorithm in Model-based RSA software.
Experiments
A validation experiment was done using a set-up in which the actual medial mJSW of the cadavers could be controlled with a micro manipulator (Fig. 3) as part of a positioning device (accuracy 0.01 mm). This set-up was used to acquire both plain radiographs and RSA images under equal, controlled circumstances.

Fig.
a) Schematic view of the positioning device and manipulation of the actual mJSW; b) effect of manipulating the X-ray tube offset parameter; c) effect of manipulating the internal rotation of the positioning device.
The plain radiographs were acquired with an x-ray imaging system at the Leiden University Medical Centre (CXDI-series, 169dpi, 12BPP, Canon, New York, New York). A standing anterior-posterior (AP) view was used with a focus-film distance of 1.2 m. The image magnification factor was 110%, based on measurements of the bone to detector distances. For the RSA images a mobile x-ray system with the same device qualifications was added. The detectors were placed in a carbon calibration box (LUMC, Leiden, The Netherlands). The x-ray sources were positioned at 1.5 m from the detectors and the angle between the x-ray beams was approximately 40°. For both imaging modes the positioning device was placed as close to the detectors as possible.
For each cadaver, first a plain radiograph was acquired with the actual mJSW at 0 mm, i.e. in which there was contact between the medial femoral condyle and the tibial plateau. For this acquisition, the medial tibial plateau was aligned with the x-ray beam. This was achieved by optimising the positioning of the tibia in the phantom and by adjusting the height of the x-ray tube until the centre of the beam (laser guidance) just skimmed the edges of the plateau. Since alignment was optimised for the medial plateau, the lateral mJSW was not measured in this validation study.
After the first acquisition at 0 mm, the actual mJSW was increased to 2 mm, 4 mm and 6 mm. These values are representative for diseased and healthy adult knees. For each of these distances, three exposures were made with varying x-ray tube heights (-5 cm, 0 cm, 5 cm) and three exposures were made with varying rotations of the cadaver (-10°, 0°, 10°). Note that when one parameter was varied, the other parameter was in neutral position and the exposure with zero tube height and zero rotation is made twice. In total, 19 exposures were made per cadaver. A schematic with the function of these parameters is shown in Figure 3. The range of the parameters was considered representative for actual variations in patient positioning during follow-up studies.
The above procedure was repeated acquiring RSA image pairs for each cadaver bone. The mJSW was measured using the 2D measurement in plain radiographs and using the SSM-based and CT-based measurements for the RSA image pairs, resulting in 285 measurements in total.
Statistical analysis
From the experimental data, the relative measurement errors were computed as the measured mJSW minus the actual mJSW. To analyse the robustness of the measurements against the variations in position applied in the experiment, the measurement errors per method are shown in a boxplot (Fig. 4). Significant differences between the dispersion are tested with Levene’s test.
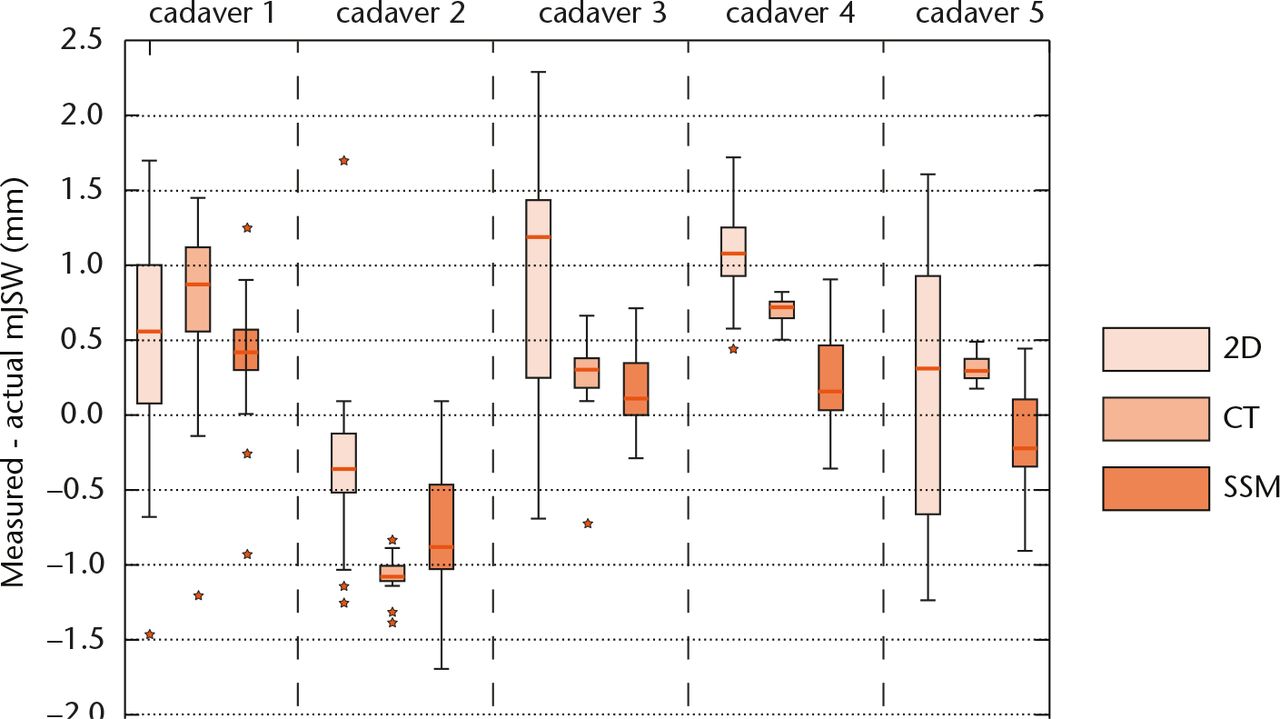
Fig. 4
Boxplots presenting the difference between the actual mJSW and measured mJSW in the validation experiment for each method and cadaver shape (n = 19 for each boxplot). The horizontal lines within the boxplots indicate the median differences. The whiskers are set at 1.5 times the interquartile range.
The sensitivity was evaluated based on the data with mJSW variation only. Measurements with a mJSW of 0 mm and with any tube offset or rotation were excluded, (n = 6 measurements per cadaver). Standard deviations and the SDD were computed. The SDD is a relevant outcome for OA research, representing the minimum JSN that could be detected.4,21 Between-cadaver differences were analysed with a univariate linear model with the shape index as random factor. Last, data trends were analysed by plotting the measurement errors against the actual mJSW.
Results
In the robustness analysis, the measurement errors showed a large difference in dispersion between the measurement methods (Fig. 4). Generally, the smallest dispersion was found for the CT-based measurement, next for the SMM-based measurement and last for the 2D measurement. These differences were statistically significant for cadavers 2 to 5 (Levene’s test, p < 0.01).
No significant differences or trends were found between the measurement errors versus the actual mJSW (Fig. 5). The results in Table II show that the SDDs differed significantly between the cadavers for all measurement methods (analysis of variance (ANOVA), p < 0.01). More specifically, the SDD of cadaver 1 was relatively high for all measurement methods. The last table column shows the SDDs corrected for between-cadaver effects with the univariate linear model. This shows the corrected SDD is smallest for the CT-based measurement method, followed by the 2D measurement and the SSM-based measurement method respectively.

Fig. 5
Bland-Altman plot showing the measurement errors as a function of the actual mJSW (tube offset 0 cm, rotation 0°). To improve the readability of the plot, the dots have a slight horizontal offset based on the index of the cadaver bones as illustrated at mJSW = 2 mm.
Table II.
The standard deviations and smallest detectable differences of the three measurement methods (with tube offset 0 cm, and rotation 0°). In the columns, values are first shown per cadaver and then for the whole dataset
| Single cadavers (1 to 5) |
Whole dataset* |
||||||
|---|---|---|---|---|---|---|---|
| n = 6 | n = 6 | n = 6 | n = 6 | n = 6 | n = 30 | ||
| Standard deviation (mm) | 2D | 0.59 | 0.10 | 0.12 | 0.17 | 0.21 | 0.36 |
| 3D – CT | 0.95 | 0.03 | 0.44 | 0.04 | 0.10 | 0.28 | |
| 3D – SSM | 0.74 | 0.44 | 0.14 | 0.36 | 0.46 | 0.42 | |
| Smallest detectible difference (mm) | 2D | 1.15 | 0.20 | 0.23 | 0.34 | 0.40 | 0.70 |
| 3D – CT | 1.85 | 0.07 | 0.87 | 0.07 | 0.19 | 0.55 | |
| 3D – SSM | 1.45 | 0.85 | 0.27 | 0.70 | 0.90 | 0.82 | |
-
*
Based on the least square error in the univariate analysis.
Discussion
The purpose of this study was to investigate the application of a SSM reconstruction of the knee to conduct mJSW measurements and assess the feasibility of this measurement method. In a validation study, its sensitivity to changes in the mJSW was evaluated as well as its robustness to variations in knee positioning and bone geometry. For comparison, the mJSW was also measured in conventional plain radiographs. The measurement was repeated with bone models obtained from CT scans to study the influence of model accuracy.
In comparison with the conventional 2D mJSW measurement from plain radiographs, the method is more robust (Fig. 4), but with a similar sensitivity over the whole dataset (Table II). Thus, 3D reconstruction reduces the influence of knee positioning as expected. However, we could not establish an improvement in sensitivity, since the SDD of the SSM-based measurement was higher than that of the conventional measurement and CT-based measurement (SDD = 0.82mm, 0.7 mm and 0.55 mm, respectively). The higher error in the SSM-based measurement can originate from different sources: image calibration error, edge detection error, fitting error (i.e. not finding the global minimum) and modelling error. The comparison of the results between the SSM-based and CT-based measurement showed that the CT-based measurement results were more accurate than those of the SSM-based measurement. This indicates that modelling error is probably an important contributor. The modelling error could be reduced by increasing the training set of the shape models. Another option is to improve the 2D/3D fitting and optimisation. For example, edge detection can be inaccurate or incomplete when parts of the femoral and tibial silhouettes overlap. This could be solved by searching for better edge candidates in the neighbourhood of the SSM silhouette during optimisation. In addition, the edge orientation can be used to discriminate between the femoral and tibial edges, which is a technique that already has been studied.18 Moreover, in clinical practice follow-up images are available. These can be exploited to limit the search space in which the optimisation is performed.
The validation experiment showed that a 3D reconstruction improves the robustness of the measurements against variations in patient positioning, which was simulated using different tube offsets and rotation angles of the knee. Although this comparison is useful, the robustness found for the 2D measurement cannot be extrapolated directly to clinical practice as measurement protocols are often employed reducing variability. Also, images that violate certain specifications (such as a high inter-margin distance) are retaken, further reducing variations in viewing angles. These protocols reduce variations in patient positioning and viewing angles by reducing inaccuracies in mJSW measurements in clinical practice.
A curious finding was that cadaver 1 showed relatively high measurement errors for all methods. This could be caused by bone abnormalities in the medial joint shape. A bulge was present in the femoral bone as well as a large inter-margin difference in the tibial plateau. Although the CT-based measurement does incorporate this bulge, results still show high measurement errors, indicating that other factors influence the measurement results.
The reproducibility of the 2D mJSW measurement has been evaluated in several other studies. Dupuis et al22 found an sd of 0.08 mm to 0.11 mm in a cadaver study, which is a remarkably high precision. Conrozier et al5 reported an sd of 0.14 mm for the reproducibility when fluoroscopy-assisted radiographs were used. Except for the first cadaver specimen, the results in our study are comparable with an sd ranging between 0.10 mm and 0.20 mm.
Only cadaver knees without signs of OA were used in this feasibility assessment. For patients with OA, modelling the femoral and tibial bones will be more challenging, because of abnormal shapes and the formation of osteocytes. The optimisation of shape and pose parameters in the SSM-based measurement can be adjusted for such aberrations. For example, semi-automatic or automatic detection of the corresponding regions can be introduced, followed by the assignment of different weights to these regions in the 2D/3D matching algorithm.
More sophisticated imaging techniques such as MRI and CT are considered as a more reliable alternative than planar radiographs for the estimation of cartilage loss.23,24 However, these methods are more costly, more time-consuming and require experience and special equipment. Given that the modelling error can be further improved, the SSMs can provide a beneficial alternative. Moreover, SSMs can provide quantitative information on the bone morphology. This has proven its value in the identification of risks and in the diagnosis of skeletal diseases.12,25 For example, the risks for hip fractures, the progression of osteoarthritis of the hip and the need for total hip replacement can be estimated by analysing the shape of the femur using a SSM model.26-28 Likewise, a SSM-based reconstruction of the knee can be used to combine shape analyses and geometric measurements such as the mJSW, which can be valuable for OA-related research.29
This study focused on the feasibility of an mJSW measurement with an SSM-based 3D reconstruction. Yet the 3D reconstruction allows for other measurement possibilities as well. For example, the 3D location of the mJSW could be determined and correlations between progression of joint space narrowing and (changes in) the 3D bone geometry can be studied. Also, alternative metrics such as the median or mean joint space distance could be investigated. These metrics are probably less susceptible to noise or outliers than the mJSW, but often do require a standardised definition of the tibial margin based and deviate from the current definition of JSW.
In conclusion, the proposed measurement method is currently not a substitute for the conventional 2D measurement. The marginal improvement in measurement accuracy does not outweigh the increase in measurement complexity. However, further improvement of the model accuracy and optimisation technique can be obtained. Combined with the promising options for applications using quantitative information on the bone morphology, SSM based 3D reconstructions of natural knees are attractive for further development.
Funding Statement
None declared.
ICMJE conflict of interest
The authors declare funding was given to their institution from the Dutch Arthritis Foundation and support was given from Anna Fonds for this study.
E. R. Valstar and B. Kaptein declare funding received from the Dutch Arthritis Foundation, ZonMw, Depuy, Stryker and Zimmer unrelated to this work and that they are an employee of LUMC. B. Stoel declares that they have carried out consultancy work for CSL Behring, Baxter and BioClinica unrelated to the study. R. G. H. Neilsson declares funding received from the Dutch Arthritis Foundation, ZonMw, Depuy, Stryker, Zimmer and the Dutch Implant Repository unrelated to this work and that they are an employee of LUMC. Van t’Klooster declares that they are an employee of Quantib B. V.
References
1 Schaap LA , PeetersGM, DennisonEM, et al.. European Project on OSteoArthritis (EPOSA): methodological challenges in harmonization of existing data from five European population-based cohorts on aging. BMC Musculoskelet Disord2011;12:272.CrossrefPubMed Google Scholar
2 Shapiro JR , ByersPH, GlorieuxFH, SponsellerP, eds. Osteogenesis imperfecta: A translational approach to brittle bone disease. First ed. Cambridge:Academic Press, 2013. Google Scholar
3 Buckland-Wright C . Which radiographic techniques should we use for research and clinical practice?Best Pract Res Clin Rheumatol2006;20:39-55.CrossrefPubMed Google Scholar
4 Guermazi A , BursteinD, ConaghanP, et al.. Imaging in osteoarthritis. Rheum Dis Clin North Am2008;34:645-687. Google Scholar
5 Conrozier T , FavretH, MathieuP, et al.. Influence of the quality of tibial plateau alignment on the reproducibility of computer joint space measurement from Lyon schuss radiographic views of the knee in patients with knee osteoarthritis. Osteoarthritis Cartilage2004;12:765-770.CrossrefPubMed Google Scholar
6 Mazzuca SA , BrandtKD, DieppePA, et al.. Effect of alignment of the medial tibial plateau and x-ray beam on apparent progression of osteoarthritis in the standing anteroposterior knee radiograph. Arthritis Rheum. 2001;44:1786-1794.CrossrefPubMed Google Scholar
7 Buckland-Wright JC , WolfeF, WardRJ, FlowersN, HayneC. Substantial superiority of semiflexed (MTP) views in knee osteoarthritis: a comparative radiographic study, without fluoroscopy, of standing extended, semiflexed (MTP), and schuss views. J Rheumatol1999;26:2664-2674.PubMed Google Scholar
8 Mazzuca SA , HellioLe, GraverandM-P, VignonE, et al.. Performance of a non-fluoroscopically assisted substitute for the Lyon schuss knee radiograph: quality and reproducibility of positioning and sensitivity to joint space narrowing in osteoarthritic knees. Osteoarthritis Cartilage2008;16:1555-1559.CrossrefPubMed Google Scholar
9 Kaptein BL , ValstarER, StoelBC, RozingPM, ReiberJHC. A new model-based RSA method validated using CAD models and models from reversed engineering. J Biomech2003;36:873-882.CrossrefPubMed Google Scholar
10 Ryd L , AlbrektssonBE, CarlssonL, et al.. Roentgen stereophotogrammetric analysis as a predictor of mechanical loosening of knee prostheses. J Bone Joint Surg [Br]1995;77-B:377-383.PubMed Google Scholar
11 van Ijsseldijk EA , ValstarER, StoelBC, et al.. The robustness and accuracy of in vivo linear wear measurements for knee prostheses based on model-based RSA. J Biomech2011;44:2724-2727.CrossrefPubMed Google Scholar
12 Sarkalkan N , WeinansH, ZadpoorAA. Statistical shape and appearance models of bones. Bone2014;60:129-140.CrossrefPubMed Google Scholar
13 Huétink K , van’t, KloosterR, KapteinBL, et al.. Automatic radiographic quantification of hand osteoarthritis; accuracy and sensitivity to change in joint space width in a phantom and cadaver study. Skeletal Radiol2012;41:41-49.CrossrefPubMed Google Scholar
14 Lorensen WE , ClineHE. Marching cubes: A high resolution 3D surface construction algorithm. In: SIGGRAPH ‘87 Proceedings of the 14th annual conference on Computer graphics and interactive techniquesNew York:ACM, 1987:163-169. Google Scholar
15 Cootes TF , HillA, TaylorCJ, HaslamJ. Use of active shape models for locating structures in medical images. Image Vis Comput1994;12:355-365. Google Scholar
16 Baka N , KapteinBL, GiphartJE, et al.. Evaluation of automated statistical shape model based knee kinematics from biplane fluoroscopy. J Biomech2014;47:122-129.CrossrefPubMed Google Scholar
17 Klein S , StaringM, MurphyK, ViergeverMA, PluimJP. Elastix: a toolbox for intensity-based medical image registration. Medical Imaging IEEE Transactions on2010;29:196-205.CrossrefPubMed Google Scholar
18 Baka N , KapteinBL, de BruijneM, et al.. 2D-3D shape reconstruction of the distal femur from stereo X-ray imaging using statistical shape models. Med Image Anal2011;15:840-850.CrossrefPubMed Google Scholar
19 No authors listed. Division of Image Processing. www.lkeb.nl (date last accessed 13 July 2016).[[bibmisc]] Google Scholar
20 van ’t Klooster R , HendriksEA, WattI, et al.. Automatic quantification of osteoarthritis in hand radiographs: validation of a new method to measure joint space width. Osteoarthritis Cartilage2008;16:18-25.CrossrefPubMed Google Scholar
21 Bland JM , AltmanDG. Measurement error. BMJ1996;313:744.CrossrefPubMed Google Scholar
22 Dupuis DE , BeynnonBD, RichardMJ, et al.. Precision and accuracy of joint space width measurements of the medial compartment of the knee using standardized MTP semi-flexed radiographs. Osteoarthritis Cartilage2003;11:716-724.CrossrefPubMed Google Scholar
23 Eckstein F , MosherT, HunterD. Imaging of knee osteoarthritis: data beyond the beauty. Curr Opin Rheumatol2007;19:435-443.CrossrefPubMed Google Scholar
24 Wirth W , DuryeaJ, Hellio Le GraverandMP, et al.. Direct comparison of fixed flexion, radiography and MRI in knee osteoarthritis: responsiveness data from the Osteoarthritis Initiative. Osteoarthritis Cartilage2013;21:117-125.CrossrefPubMed Google Scholar
25 Heimann T , MeinzerH-P. Statistical shape models for 3D medical image segmentation: a review. Med Image Anal2009;13:543-563.CrossrefPubMed Google Scholar
26 Barr RJ , GregoryJS, ReidDM, et al.. Predicting OA progression to total hip replacement: can we do better than risk factors alone using active shape modelling as an imaging biomarker?Rheumatology (Oxford)2012;51:562-570.CrossrefPubMed Google Scholar
27 Gregory JS , TestiD, StewartA, et al.. A method for assessment of the shape of the proximal femur and its relationship to osteoporotic hip fracture. Osteoporos Int2004;15:5-11.CrossrefPubMed Google Scholar
28 Lynch JA , ParimiN, ChagantiRK, et al.. The association of proximal femoral shape and incident radiographic hip OA in elderly women. Osteoarthritis Cartilage2009;17:1313-1318.CrossrefPubMed Google Scholar
29 Felson DT , NeogiT. Osteoarthritis: is it a disease of cartilage or of bone?Arthritis Rheum2004;50:341-344. Google Scholar
