


Abstract
Objectives
The purpose of this study was to clarify the appearance of the reparative tissue on the articular surface and to analyse the properties of the reparative tissue after hemicallotasis osteotomy (HCO) using MRI T1ρ and T2 mapping.
Methods
Coronal T1ρ and T2 mapping and three-dimensional gradient-echo images were obtained from 20 subjects with medial knee osteoarthritis. We set the regions of interest (ROIs) on the full-thickness cartilage of the medial femoral condyle (MFC) and medial tibial plateau (MTP) of the knee and measured the cartilage thickness (mm) and T1ρ and T2 relaxation times (ms). Statistical analysis of time-dependent changes in the cartilage thickness and the T1ρ and T2 relaxation times was performed using one-way analysis of variance, and Scheffe’s test was employed for post hoc multiple comparison.
Results
The cartilage-like repair tissue appeared on the cartilage surface of the medial compartment post-operatively, and the cartilage thickness showed a significant increase between the pre-operative and one-year post-operative time points (MFC; p = 0.003, MTP; p < 0.001). The T1ρ values of the cartilage-like repair tissue showed no difference over time, however, the T2 values showed a significant decrease between the pre-operative and one-year post-operative time points (MFC; p = 0.004, MTP; p = 0.040).
Conclusion
This study clarified that the fibrocartilage-like repair tissue appeared on the articular surface of the medial compartment after HCO as evidenced by MRI T1ρ and T2 mapping.
Cite this article: H. Nishioka, E. Nakamura, J. Hirose, N. Okamoto, S. Yamabe, H. Mizuta. MRI T1ρ and T2 mapping for the assessment of articular cartilage changes in patients with medial knee osteoarthritis after hemicallotasis osteotomy. Bone Joint Res 2016;5:294–300. DOI: 10.1302/2046-3758.57.BJR-2016-0057.R1.
Article focus
-
This study performed morphological and qualitative evaluations of the MRI appearance of repair tissue on the articular surface of the medial compartment in the affected knee after hemicallotasis osteotomy (HCO).
Key messages
-
The cartilage-like repair tissue appeared on the articular surface of the medial compartment after HCO.
-
Our study using T1ρ and T2 mapping revealed that the repair tissue was likely to be fibrocartilage.
Strengths and limitations
-
This study is the first to elucidate that cartilage-like repair tissue occurred on the articular surface of the medial compartment after HCO.
-
One limitation is that the evaluation of repair tissue using T1ρ and T2 mapping was performed only up to one year following HCO.
-
A further limitation is that no histological examination by biopsy of the repair tissue was carried out in our study.
Introduction
High tibial osteotomy (HTO) is one of the treatment options in patients with medial knee osteoarthritis. The purpose of HTO is to disperse an excessive load applied to the medial compartment using the correction of lower limb alignment, which results from outward displacement of the mechanical axis of the leg. Previous research on the closing-wedge HTO (CWHTO) reported the appearance of cartilage-like repair tissue on the articular surface of the medial compartment because of the reduction of the load on the medial compartment with proper leg alignment.1-3 Significant correlations were also observed between the cartilage-like repair tissue and clinical evaluation in cases of cartilage-like repair tissue appearing on the medial compartment.1,2
Hemicallotasis osteotomy (HCO) is one type of opening-wedge HTO (OWHTO).4,5 Advantages of the HCO are that it is easy to obtain a correct alignment using post-operative gradual correction, and patients begin to walk with early weight-bearing because of the rigid fixation that is obtained using a low-invasive external fixator.4,6 HCO is also an excellent method because it results in less deformation of the proximal tibia than other methods of performing the OWHTO.4 We reported good clinical results and alignment maintenance in 19 patients who were available for review more than ten years post-operatively.7 However, it is not yet clear whether the repair of cartilage-like tissue occurs in the articular surface of the medial compartment after HCO.
The remarkable progress of MRI techniques enables excellent quantitative evaluation of cartilage and the usefulness of MRI as the rating system for cartilage lesions has increased remarkably. Several recent studies revealed that T1ρ and T2 mapping images reflect the changes in the cartilage matrix, which are similar to delayed gadolinium enhanced MRI of cartilage (dGEMRIC), and demonstrated the effectiveness of these techniques for qualitative evaluation of articular cartilage.8-13 An ex vivo study of bovine cartilage revealed that T1ρ values increased in correlation with a decrease in glycosaminoglycan (GAG) content.9,10 T2 values also reflected changes in water content and collagen anisotropy.11 Clinical studies using T1ρ and T2 mapping images demonstrated that T1ρ and T2 values correlated with the degree of cartilage degeneration.12,13
This study performed morphological evaluations of the appearance of repair tissue on the articular surface of the medial compartment in the affected knee after HCO using 3D T1-weighted fast field echo with water-selective excitation (3D WATS) and performed a qualitative evaluation using T1ρ and T2 mapping to analyse the properties of the repair tissue.
Patients and Methods
Patients
The cohort consisted of patients who underwent HCO with a diagnosis of medial knee osteoarthritis from March 2009 to June 2011. A total of 20 patients (six male and 14 female, with a mean age at surgery of 61.6 years (53 to 72)) participated in this study. A physician (EN) specialising in knee joints with 20 years of experience performed the surgeries according to the procedure described in a previous report.4 This study complied with the Declaration of Helsinki after we obtained approval from the Institutional Review Board of our institution. All patients provided written informed consent to participate in the study. The following exclusion criteria were used: contraindication for undergoing MRI, patients with severe osteoarthritis in the lateral compartment of the femorotibial joint or patellofemoral joint and patients with a history of knee surgery or knee injury within the previous three months on the affected knee. All patients underwent radiographic and MRI examinations pre-operatively and at six months and one year after surgery.
Radiographic evaluation
Radiographic evaluation was performed by the surgeon (EN) pre-operatively and at six months and one year after surgery. The hip-knee-ankle (HKA) angle14 was measured using standing anteroposterior radiographs of the lower leg.
MR imaging protocol
All MR examinations were performed on a 3-Tesla MRI Scanner (Achieva 3 Tesla, Philips Medical Systems International B.V., Best, The Netherlands) using an eight-channel SENSE knee coil (Philips). The affected limb was fixed at 15° of flexion in a neutral position of rotation when installing the knee coil for MR imaging to eliminate the influence of body movement. All imaging was performed in the coronal plane, and the coronal slice was set parallel to the tibial posterior condylar axis, which is connected to the posterior edge of the medial and lateral tibial condyles. The MR imaging protocol included three sequences, and the acquisition parameters used can be seen in Table I. We chose the central slice through the central point surrounded by the anterior and posterior margins of the meniscus using the sagittal image (scout view) to match the slices in the three imaging sequences.
Table I.
MR imaging parameters for articular cartilage evaluation
| Sequence | |||
|---|---|---|---|
| Imaging parameter | 3D WATS | T1ρ | T2 |
| TR (ms) | 10 | 4.7 | 4,613 |
| TE (ms) | 4.7 | 2.3 | 16 × n (n = 1–7) |
| Flip angle (º) | 20 | 35 | 90 |
| Matrix size | 400 × 400 | 256 × 256 | 320 × 320 |
| Field of view (cm) | 14 | 14 | 14 |
| Section thickness (mm) | 1.5 | 4 | 4 |
| Spin-lock pulse (Hz) | 440 | ||
| TSL (ms) | 1, 10, 20, 30, 40 | ||
| Bandwidth (kHz/pixel) | 0.7 | ||
| Scan time (minute:second) | 4:10 | 15:45 | 14:50 |
-
3D WATS, 3D T1-weighted fast field echo with water-selective excitation; TR, repetition time; TE, echo time; TSL, time of the spin-lock pulse
MR imaging analysis
Imaging analysis was performed after transferring the data to an offline personal computer (Apple Computer, Inc., Cupertino, California). T1ρ and T2 mappings were constructed using Philips Research Integrated Development Environment (PRIDE) software (Philips) written in an Interactive Data Language (RSI, Inc., Boulder, Colorado) according to the following mono-exponential fitting algorithm:
where TSL is the time of spin-lock, and S is the signal intensity on T1ρ-weighted images with a given TSL, and
where S is the signal intensity on the T2-weighted image with a given TE.
Evaluation of articular cartilage was performed on regions of interest (ROIs) set at weight-bearing full-thickness cartilage of the medial femoral condyle (MFC) and medial tibial plateau (MTP) in a coronal slice. We selected a coronal central slice (white dashed line, Fig. 1b) that was passed through the centre of the weight-bearing cartilage surrounded by the anterior and posterior margins of the meniscus in the sagittal scout image (Fig. 1a). We also added the two slices (white dotted line) that neighboured the central slice anteriorly and posteriorly (Fig. 1a). In addition, we measured the ROIs as the signal value of normal cartilage according to the method of Welsch et al.15 A region of morphologically normal-appearing cartilage in the same knee joint was selected as the normal cartilage on 3D WATS images. We chose three ROIs (mean number of pixels, 105; 77 to 101) from the normal cartilage region that was consistent with non-injured cartilage of the lateral compartment in arthroscopic findings (arthroscopy performed at the time of HCO surgery). T1ρ and T2 relaxation times (ms) in the ROIs that were set to each image were measured using ImageJ software (National Institutes of Health, Bethesda, Maryland) for T1ρ mapping and PRIDE software for T2 mapping. We calculated the average T1ρ and T2 relaxation times of three slices. Cartilage thickness was also measured at the centre of each ROI using 3D WATS images. All MRI evaluations were performed by a musculoskeletal expert who was blinded to clinical and radiographic results and to the order of image acquisitions (pre-operatively, at six months and one year after surgery). We demonstrated good reliability in the ROI settings in previous studies.12,16,17

Fig.
Sagittal slice of three-dimensional T1-weighted fast field echo with water-selective excitation (3D WATS) images for selection of the coronal slices and the regions of interest (ROIs) setting; a) in a Sagittal slice of 3D WATS images, we select a central slice (white dotted line) that is passed through the centre of the weight-bearing cartilage (blue line) surrounded by the anterior and posterior margins of the meniscus (yellow line). In addition to the central slice, we added two slices neighboring the central slice anteriorly and posteriorly. b) The ROI was set at weight-bearing full-thickness cartilage (white dotted line) of the medial femoral condyle (MFC) and medial tibial plateau (MTP) in the central slice of coronal image.
Statistical analysis
Data are presented as the mean and standard deviation (sd). Comparisons of all quantitative variables between pre-operative and one-year follow-up evaluations were investigated using the Mann-Whitney U test. Similarly, comparisons of each variable between pre-operatively and six months and one year after surgery were performed using one-way analysis of variance (ANOVA) followed by post hoc comparisons with Scheffe’s test. A p-value < 0.05 was considered statistically significant. All data analyses were performed using SPSS statistical software, version 19.0 (SPSS Inc., Chicago, Illinois).
Results
Radiographic evaluation
Radiographic evaluation revealed a mean HKA angle pre-operatively of -11.4° (sd 6.9°), which was corrected to 6.4° (sd 2.6°) six months after surgery (Table II). The corrected HKA angle was maintained at 6.3° (sd 2.7°) until one year after surgery (Table II).
Table II.
Comparison of radiographic results between pre- and post-operative periods
| Pre-operative | 6 mths post-operative | 1 yr post-operative | |
|---|---|---|---|
| HKA angle (°) | −11.4° sd 6.9° | 6.4° sd 2.6°* | 6.3° sd 2.7°* |
-
*
p < 0.05 versus pre-operative results
-
HKA, hip-knee-ankle; sd, standard deviation
-
HKA angle is expressed as deviation from 180° (negative for varus, positive for valgus). Data are reported as mean and standard deviation. HKA angle was analysed using a one-way analysis of variance with Scheffe’s test
Morphological evaluation of changes in cartilage thickness using 3D WATS
Assessment of cartilage thickness (mm) of the MFC using 3D WATS images revealed that the cartilage thickness increased significantly from 0.21 sd 0.38 pre-operatively to 0.77 (sd 0.52) six months post-operatively, and this increase persisted to 0.98 sd 0.59 one year post-operatively (p = 0.003, Fig. 2a). The change in cartilage thickness of the MTP pre-operatively (0.31, sd 0.44) demonstrated a significant difference compared with the results after surgery (six months, 0.97, sd 0.40; one year, 1.1, sd 0.42, p < 0.001, Fig. 2b).
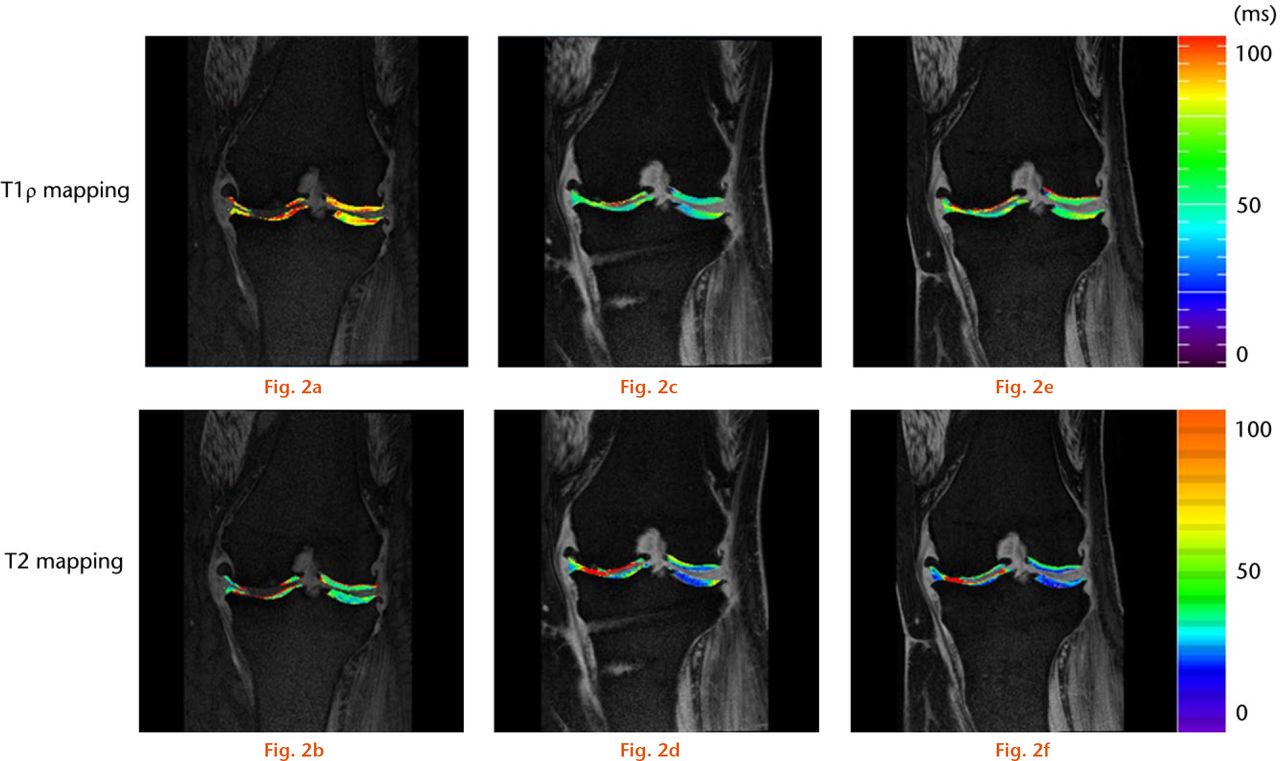
Fig.
Time-dependent course of the cartilage thickness and the T1ρ and T2 values. Graphs showing the changes in cartilage thickness and T1ρ and T2 values pre- and post-operatively. *Significant difference by one-way analysis of variance (ANOVA) and post hoc comparisons with Scheffe’s test (p < 0.05).
Qualitative evaluation of the cartilage matrix using T1ρ and T2 mapping
Representative T1ρ and T2 mapping images at six months (Figs 3c and 3d) and at one year (Figs 3e and 3f) after surgery revealed an increase in cartilage thickness in the medial compartment compared with pre-operatively (Figs 3a and 3b). Furthermore, cartilage-like tissue was clearly seen on the articular surface of MFC and MTP after surgery.

Fig.
Representative T1ρ and T2 mapping images pre-operatively (pre-op), and at six months and one year after surgery (post-op). The T1ρ and T2 mapping images at six months (c and d) and at one year after surgery (e and f) showed the increase in cartilage thickness in the medial compartment compared with pre-operative images (a and b).
The mean T1ρ values of MFC pre-operatively and at six months and one year after surgery were 51.4 sd 4.2, 49.8 sd 4.4, and 51.0 sd 4.1, respectively. The post-operative mean T1ρ values at six months (p = 0.559, Fig. 3c) and one year after surgery (p = 0.959, Fig. 3c) exhibited no significant difference compared with pre-operative values. The mean T1ρ values of the MTP pre-operatively and at six months and one year after surgery were 47.5, (sd 3.3), 45.4, (sd 4.5) and 45.4, (sd 3.6), respectively. The post-operative mean T1ρ values of the MTP at six months (p = 0.295, Fig. 2d) and one year after surgery (p = 0.237, Fig. 2d) revealed no significant difference compared with pre-operative values. Mean T2 values of the MFC pre-operatively and at six months and one year after surgery were 50.7 (sd 4.2), 48.6 (sd 3.7) and 46.5 (sd 4.1), respectively, and no differences were observed between pre-operative and six months post-operative values (p = 0.715, Fig. 2e). Mean T2 values one year after surgery significantly decreased compared with the results pre-operatively (p = 0.044, Fig. 2e). The mean T2 values of the MTP also exhibited no difference between pre-operative (45.2, sd 2.4) and six months after surgery (44.4, sd 1.8, p = 0.602, Fig. 2f). However, mean T2 values of the MTP one year after surgery exhibited a significant decrease compared with the results pre-operatively (p = 0.029, Fig. 2f).
The mean T1ρ values of normal cartilage were lower than the pre-operative T1ρ values in weight-bearing areas in the MFC (49.3, sd 4.6) and the MTP (46.0, sd 2.4), and were not significantly different from the T1ρ values of the weight-bearing cartilage one year after surgery (MFC; p = 0.218, MTP; p = 0.530). However, T2 values one year after surgery revealed a significant decrease compared with normal cartilage of the MFC (50.0, sd 10.3) and the MTP (44.9, sd 5.7) (MFC; p = 0.004, MTP; p = 0.040).
Discussion
The present study is the first to illustrate, using MRI, that cartilage-like repair tissue occurs on the articular surface of the medial compartment in the corrected valgus knee. Morphological evaluation using 3D WATS demonstrated that cartilage-like repair tissue formed on the articular surface of the medial compartment six months after surgery. The thickness of the cartilage-like repair tissue revealed a significant difference between pre-operatively and six months after surgery, but this difference was not demonstrated between six months and one year after surgery. The T1ρ values of the cartilage-like repair tissue at six months and one year after surgery were not significantly different to those pre-operatively. However, the T2 values decreased over time, and showed a significant difference between pre-operatively and one year after surgery was observed.
Previous histological studies of biopsy specimens of the cartilage site at which microfracture (MFX) was performed have indicated that the defect is repaired with fibrocartilage.18,19 However, evaluation of the repair tissue after MFX using T2 mapping revealed that the T2 values of the repair tissue in the MFX knees showed a significantly lower value after more than one year compared with normal cartilage.15 On the other hand, T1ρ values of the repaired tissue one year after surgery showed no differences compared with normal cartilage.20,21 T1ρ and T2 values of the cartilage-like repair tissue in our study exhibited a similar tendency compared with pre-operatively, and the T1ρ and T2 mean values were equal to previous studies. These results suggest that the repair tissue after HCO should be a fibrocartilage.
Post-operative alignment in previous reports of HTO was related to the cartilage repair on the articular surface of the medial compartment. Kanamiya et al1 reported that post-operative knees with a properly corrected mechanical axis exhibited regeneration of cartilage-like tissue on second-look arthroscopic evaluations at six months after CWHTO, but cases with improper correction revealed less repair of the cartilage-like tissue. Odenbring et al3 stated that the regeneration of the fibrocartilage-like repair tissue was 86% in the HKA group according to biopsy results two years after CWHTO. However, these researchers stated that the regeneration of the fibrocartilage-like repair tissue was observed only in 22% of the HKA group that underwent less correction of the weight-bearing alignment. Thus decreased stress on the load-bearing cartilage of the medial compartment in appropriately corrected limbs results in restoration of the cartilage-like tissue.1,3 However, Agneskirchner et al22 demonstrated that the superficial medial collateral ligament (sMCL) must separate from the bone to decrease the contact pressure of the medial compartment of the cadaveric knee after OWHTO. Therefore, in HCO,4,5 in which correction of the tibia was performed without separating the sMCL from the bone, a reduction in the mechanical stress on the medial compartment was not achieved even in knees with proper alignment. However, fibrocartilage-like repair tissue was observed in the medial compartment in our study. The results of our study suggest that a reduction of the mechanical stress in the medial compartment is obtained after HCO. Ilizarov23 revealed that adaptive elongation of soft tissues, such as muscle or tendon, was confirmed by performing limb lengthening in canine tibia. Furthermore, Mizumoto et al24 reported that a similar elongation of the soft tissue was observed in HCO in an animal study using rabbits. Therefore we believe that reduction of the mechanical stress on the medial compartment is achieved by a gradual adaptive elongation of the sMCL in HCO.
Parker et al25 evaluated dGEMRIC changes in signal intensity of articular cartilage after OWHTO. They stated that T1Gd values (T1 value after Gd-DTPA2- contrast administration) decreased in association with cartilage degeneration (loss of GAG content in the cartilage) six months after OWHTO, but that the rate of change for T1Gd values shifted from negative to positive between six and twelve months after OWHTO. However, our results showed that T1ρ values decreased in association with GAG restoration six months after HCO. Parker et al25 reported that patients required treatment using non-weight-bearing tasks during the six weeks after OWHTO. Behrens, Kraft and Oegema26 demonstrated that the GAG content of the cartilage of the knees in mature dogs decreased after six weeks of rigid immobilisation in a long-leg cast. Briefly, a loss of GAG content (decrease in T1Gd values) occurred after OWHTO within six months post-operatively because of the necessity for non-weight-bearing during the time of osteotomy-site healing. Our study indicated that the restoration of GAG content was observed six months after HCO, likely because load acceptance gait was initiated immediately after surgery.
There are some limitations to our study. First, the evaluation of repair tissue using T1ρ and T2 mapping was performed only up to one year following HCO. Using dGEMRIC, Parker et al25 demonstrated that significant changes in T1Gd values of the repair tissue were not observed even after more than one year following surgery. Thus, we considered that T1ρ and T2 values would also show no changes after more than one year post surgery. Nonetheless, further long-term research is needed. Additionally, histological examination by biopsy of the repair tissue was not carried out in our study. Although the repair tissue after HCO is considered to be repaired by fibrocartilage from the changes in the T2 values in a similar manner after MFX, its repair tissue cannot be concluded to be fibrocartilage histologically. There is a need for histological evaluation in the post-operative repair tissue after HCO.
In conclusion, this study clarified using MRI analysis, that cartilage-like repair tissue appears on the articular surface of the medial compartment after HCO. Analysis using T1ρ and T2 mapping revealed that the repair tissue is likely to be fibrocartilage.
Funding Statement
None declared.
ICMJE conflict of interest
None declared.
References
1 Kanamiya T , NaitoM, HaraM, YoshimuraI. The influences of biomechanical factors on cartilage regeneration after high tibial osteotomy for knees with medial compartment osteoarthritis: clinical and arthroscopic observations. Arthroscopy2002;18:725-729.CrossrefPubMed Google Scholar
2 Koshino T , WadaS, AraY, SaitoT. Regeneration of degenerated articular cartilage after high tibial valgus osteotomy for medial compartmental osteoarthritis of the knee. Knee2003;10:229-236.CrossrefPubMed Google Scholar
3 Odenbring S , EgundN, LindstrandA, LohmanderLS, WillénH. Cartilage regeneration after proximal tibial osteotomy for medial gonarthrosis. An arthroscopic, roentgenographic, and histologic study. Clin Orthop Relat Res1992;277:210-216.PubMed Google Scholar
4 Nakamura E , MizutaH, KudoS, TakagiK, SakamotoK. Open-wedge osteotomy of the proximal tibia with hemicallotasis. J Bone Joint Surg [Br]2001;83-B:1111-1115.CrossrefPubMed Google Scholar
5 Turi G , CassiniM, TomasiPS, ArmottiP, LaviniF. Directional osteotomy of the knee using hemicallotasis. Chir Organi Mov1987;72:205-209. (In Italian) Google Scholar
6 Mizuta H , NakamuraE, KudoS, MaedaT, TakagiK. Greater frequency of distraction accelerates bone formation in open-wedge proximal tibial osteotomy with hemicallotasis. Acta Orthop Scand2004;75:588-593.CrossrefPubMed Google Scholar
7 Nakamura E , OkamotoN, NishiokaH, et al.. The long-term outcome of open-wedge osteotomy of the proximal tibia with hemicallotasis. Bone Joint J2014; 96-B:467-472.CrossrefPubMed Google Scholar
8 Nishioka H , HiroseJ, NakamuraE, et al.. T1ρ and T2 mapping reveal the in vivo extracellular matrix of articular cartilage. J Magn Reson Imaging2012;35:147-155.CrossrefPubMed Google Scholar
9 Duvvuri U , ReddyR, PatelSD, et al.. T1rho-relaxation in articular cartilage: effects of enzymatic degradation. Magn Reson Med1997;38:863-867.CrossrefPubMed Google Scholar
10 Akella SV , RegatteRR, GougoutasAJ, et al.. Proteoglycan-induced changes in T1rho-relaxation of articular cartilage at 4T. Magn Reson Med2001;46:419-423.CrossrefPubMed Google Scholar
11 Xia Y . Magic-angle effect in magnetic resonance imaging of articular cartilage: a review. Invest Radiol2000;35:602-621.CrossrefPubMed Google Scholar
12 Hirose J , NishiokaH, NakamuraE, et al.. T(1)rho and T(2) mapping of the proximal tibiofibular joint in relation to aging and cartilage degeneration. Eur J Radiol2012;81:2776-2782. Google Scholar
13 Nishioka H , HiroseJ, OkamotoN, et al.. Evaluation of the relationship between T1ρ and T2 values and patella cartilage degeneration in patients of the same age group. Eur J Radiol2015;84:463-468.CrossrefPubMed Google Scholar
14 Cooke D , ScudamoreA, LiJ, et al.. Axial lower-limb alignment: comparison of knee geometry in normal volunteers and osteoarthritis patients. Osteoarthritis Cartilage1997;5:39-47.CrossrefPubMed Google Scholar
15 Welsch GH , MamischTC, DomayerSE, et al.. Cartilage T2 assessment at 3-T MR imaging: in vivo differentiation of normal hyaline cartilage from reparative tissue after two cartilage repair procedures–initial experience. Radiology2008;247:154-161. Google Scholar
16 Hirose J , NishiokaH, OkamotoN, et al.. Articular cartilage lesions increase early cartilage degeneration in knees treated by anterior cruciate ligament reconstruction: T1ρ mapping evaluation and 1-year follow-up. Am J Sports Med2013;41:2353-2361.CrossrefPubMed Google Scholar
17 Nishioka H , HiroseJ, NakamuraE, et al.. Detecting ICRS grade 1 cartilage lesions in anterior cruciate ligament injury using T1ρ and T2 mapping. Eur J Radiol2013;82:1499-1505.CrossrefPubMed Google Scholar
18 Gudas R , StankeviciusE, MonastyreckieneE, PranysD, KalesinskasRJ. Osteochondral autologous transplantation versus microfracture for the treatment of articular cartilage defects in the knee joint in athletes. Knee Surg Sports Traumatol Arthrosc2006;14:834-842.CrossrefPubMed Google Scholar
19 Knutsen G , EngebretsenL, LudvigsenTC, et al.. Autologous chondrocyte implantation compared with microfracture in the knee. A randomized trial. J Bone Joint Surg [Am]2004;86-A:455-464.CrossrefPubMed Google Scholar
20 Holtzman DJ , TheologisAA, Carballido-GamioJ, et al.. T(1ρ) and T(2) quantitative magnetic resonance imaging analysis of cartilage regeneration following microfracture and mosaicplasty cartilage resurfacing procedures. J Magn Reson Imaging2010; 32: 914-923. Google Scholar
21 Theologis AA , SchairerWW, Carballido-GamioJ, et al.. Longitudinal analysis of T1ρ and T2 quantitative MRI of knee cartilage laminar organization following microfracture surgery. Knee2012;19:652-657.CrossrefPubMed Google Scholar
22 Agneskirchner JD , HurschlerC, WrannCD, LobenhofferP. The effects of valgus medial opening wedge high tibial osteotomy on articular cartilage pressure of the knee: a biomechanical study. Arthroscopy2007;23:852-861.CrossrefPubMed Google Scholar
23 Ilizarov GA . The tension-stress effect on the genesis and growth of tissues. Part I. The influence of stability of fixation and soft-tissue preservation. Clin Orthop Relat Res1989;238:249-281.PubMed Google Scholar
24 Mizumoto Y , MizutaH, NakamuraE, TakagiK. Distraction frequency and the gastrocnemius muscle in tibial lengthening. Studies in rabbits. Acta Orthop Scand1996;67:562-565.CrossrefPubMed Google Scholar
25 Parker DA , BeattyKT, GiuffreB, ScholesCJ, CoolicanMR. Articular cartilage changes in patients with osteoarthritis after osteotomy. Am J Sports Med2011;39:1039-1045.CrossrefPubMed Google Scholar
26 Behrens F , KraftEL, OegemaTRJr. Biochemical changes in articular cartilage after joint immobilization by casting or external fixation. J Orthop Res1989;7:335-343. Google Scholar
