


Abstract
Objectives
Computed tomography (CT) plays an important role in evaluating wear and periacetabular osteolysis (PAO) in total hip replacements. One concern with CT is the high radiation exposure since standard pelvic CT provides approximately 3.5 millisieverts (mSv) of radiation exposure, whereas a planar radiographic examination with three projections totals approximately 0.5 mSv. The objective of this study was to evaluate the lowest acceptable radiation dose for dual-energy CT (DECT) images when measuring wear and periacetabular osteolysis in uncemented metal components.
Materials and Methods
A porcine pelvis with bilateral uncemented hip prostheses and with known linear wear and acetabular bone defects was examined in a third-generation multidetector DECT scanner. The examinations were performed with four different radiation levels both with and without iterative reconstruction techniques. From the high and low peak kilo voltage acquisitions, polychrmoatic images were created together with virtual monochromatic images of energies 100 kiloelectron volts (keV) and 150 keV.
Results
We could assess wear and PAO while substantially lowering the effective radiation dose to 0.7 mSv for a total pelvic view with an accuracy of around 0.5 mm for linear wear and 2 mm to 3 mm for PAO.
Conclusion
CT for detection of prosthetic wear and PAO could be used with clinically acceptable accuracy at a radiation exposure level equal to plain radiographic exposures.
Cite this article: B. Sandgren, M. Skorpil, P. Nowik, H. Olivecrona, J. Crafoord, L. Weidenhielm, A. Persson. Assessment of wear and periacetabular osteolysis using dual energy computed tomography on a pig cadaver to identify the lowest acceptable radiation dose. Bone Joint Res 2016;5:307–313. DOI: 10.1302/2046-3758.57.2000566.
Article focus
-
Lowest acceptable radiation dose for pelvic CT.
-
Assessment of wear and osteolysis
-
Use of modern dual energy computed tomography technique.
Key messages
-
Radiation doses can be reduced to 0.7 millisievert.
-
Acuracy assessment for wear and osteolysis around uncemented components can be maintained.
-
Polychromatic as opposed to virtual monochromatic spectral imaging is satisfactory for analysis.
Strengths and limitations
-
Two independent investigators evaluated the images.
-
The distance between the metal objects of known size, made it possible to calculate accuracy.
-
Limitation- small size of the pelvis used for this study.
Introduction
The first generations of uncemented acetabular components had high wear rates.1,2 Wear particles from the polyethylene in the component cause pelvic bone loss around the component known as periacetabular osteolysis (PAO).3 This is a clinically silent process and the patient is asymptomatic until the PAO around the component has reached the level where the fixation of the component in the pelvis can no longer be maintained and component loosening occurs.1 When this happens, the patient becomes symptomatic and the hip prosthesis has to be revised. A pre-operative computed tomography (CT) examination is often performed. Many articles suggest that CT should be the benchmark for assessing wear and PAO in total hip arthroplasties (THA).4,5 Even though the metal in the hip prosthesis causes considerable artefacts,6 the image quality and possibility to measure wear and osteolysis have proven CT to be a more accurate method than radiography.7 MRI has in several studies shown both promising and disappointing results for detecting PAO. Artefacts surrounding metal objects make it difficult for accurate measurements of PAO when using MRI. Improved metal artefact reduction techniques makes MRI an interesting method in the future.8-11
One concern has been high radiation exposure when using CT. Diagnostic radiographic examinations are the largest man-made source of radiation, contributing to around 14% of the total worldwide radiation exposure, and cause 0% to 6% of the cumulative risk of cancer in Europe.12 The biological effects from radiation depend not only on the radiation dose to a tissue, but also on the biological sensitivity of this tissue. The effective dose, measured in millisieverts, is a tissue-weighted sum of the absorbed dose in specific tissues.13 A planar radiographic examination with three projections of the hip: a frontal pelvic view; anteroposterior view; and an oblique image, has a radiation dose of approximately 0.5 mSv, whereas a standard pelvic examination CT scan has a dose of approximately 3.5 mSv.14 For comparison, average radiation levels for a normal Swedish citizen is approximately 2.4 mSv/year.15 There is no evidence that an effective dose of less than 10 mSv causes harmful medical effects, however, it is desirable to lower the effective dose as much as possible without losing information necessary to assess wear and osteolysis.13
While conventional CT of patients with metal implants will result in beam hardening, photon starvation, and scatter artefacts, there are several techniques to reduce the amount of artefacts, often with compensatory disadvantages.16-20 By increasing peak voltage, increasing tube current, decreasing the pitch, and by using an extended CT scale,21 image quality can be improved. Multiplanar reconstruction and increasing slice thickness have also been applied to cut down the amount of artefact.21-23
Dual-energy CT (DECT) has been shown to reduce metal artefact by exploiting the difference in absorption spectra with energy. Beam-hardening artefact can be reduced with the synthesis of virtual monochromatic spectral imaging (VMS), an image reconstruction which depicts how the imaged object would look if the radiograph source produced photons at a single energy, allowing image reconstruction at high kiloelectron volt (keV) without increasing patient radiation exposure.17,24,25 Iterative reconstruction is a mathematical algorithm to perform noise reduction on CT images,18,26-29 as opposed to filtered back projection, which directly calculates the image in a single reconstruction step.
The aim of this study was to use a porcine model to evaluate image quality using DECT examinations with the lowest possible radiation exposure that still enables the detection of PAO and wear, with clinically acceptable accuracy in uncemented THA.30
Material and Methods
We used a porcine pelvis stripped of soft tissue except for the joint capsules. The hips were dislocated and the femoral necks were cut bilaterally. The acetabular surface was reamed with 40 mm (left side) and 42 mm (right side) reamers. On the left side, a 13.3 mm-wide and 19 mm-deep bone defect was drilled in the apical/dorsal direction to imitate osteolysis. On the right side, a 23.5 mm × 13.3 mm bone defect was milled into the apical region in the acetabular surface. The depth of this bone defect varied between 2 mm and 5 mm. In order to evaluate accuracy in the measurements, plastic clay was moulded into the lesions and lifted out and measured with a micrometer (Fig 1). Both bone defects were then filled with minced meat to imitate the mucose substance normally found in bone defects.16 Two titanium alloy cluster hole Trilogy acetabular components (Zimmer Biomet Inc., Warsaw, Indiana), a 40 mm (left side) and a 42 mm (right side), were fastened. A plastic liner (5.2 mm left side and 7.5 mm right side) for a 22 mm head was inserted. Both liners were worn down; 1.9 mm dorsal/apically on the left side and 4.6 mm apically on the right side, with a round drill to imitate plastic linear wear. Liner thickness at the thinnest part and plastic moulds were measured with a micrometer and caliper after the CT measurements were made by the observers in order to avoid observer bias. Caliper measurements of the thinnest part of the liner on the left side were 3.4 mm, and on the right side 2.9 mm. The depth of the osteolysis on the left side and the width on the right side were measured with a micrometer (Fig. 2).
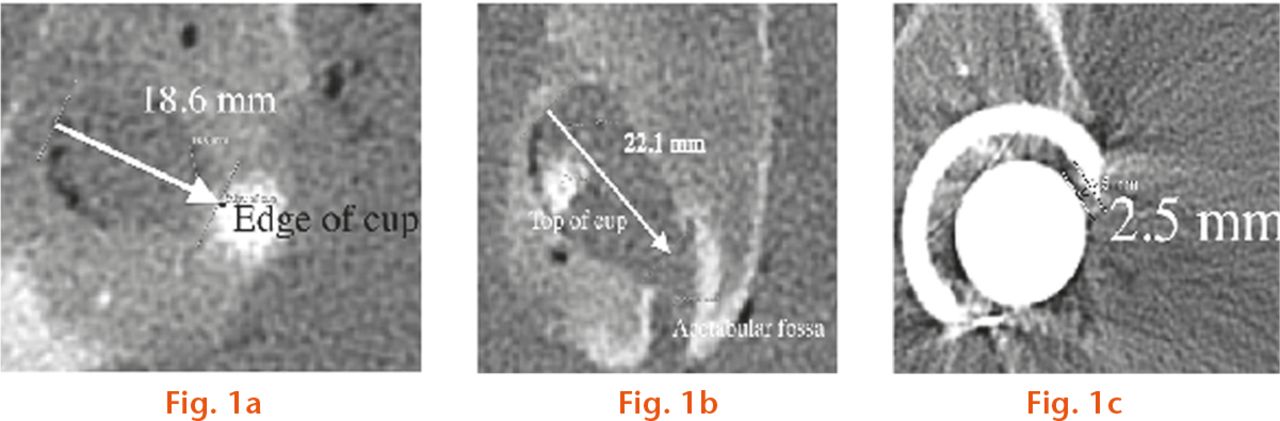
Fig.
Measurement of periacetabular osteolysis (PAO) and wear. On the left side (image) the ‘osteolysis’ was connected to the acetabular central grove which made it difficult to define where the osteolysis began; a) PAO, left side depth; b) PAO, right side width.; c) wear on left side. The shortest distance between inner border of the component and head was measured.
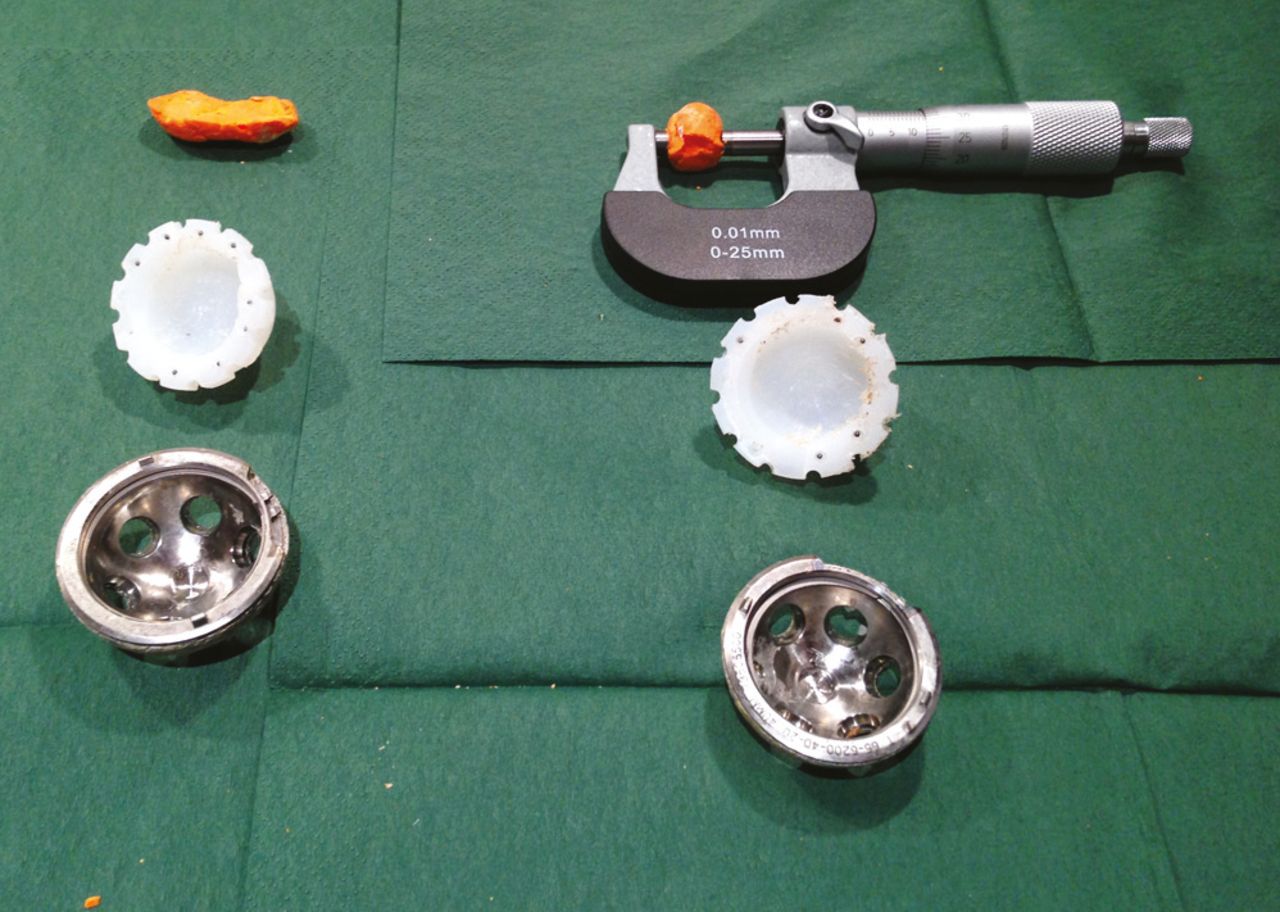
Fig. 2
Actual drilled depth and width measured from a plastic mould using a micrometer for the man-made periacetabular osteolysis. Drilled wear measured with a micrometer.
Two Charnley hip prosthetic (DePuy Orthopaedics, Inc., Warsaw, Indiana) femoral components with 22 mm heads were implanted in the femoral shafts. The prosthetic head was reduced into the component and the femurs were fixed in a standard position with sutures and tape. The pelvis was placed with the posterior portion down and the legs up, in a cylindrical container 300 mm in diameter containing iodinated contrast medium (Omnipaque 320, GE Healthcare, Chalfont St Giles, United Kingdom) diluted to provide an attenuation corresponding to 40 Hounsfield units (HU) in order to imitate surrounding soft tissues.24
CT image acquisition
The prepared pelvis was examined with a Siemens SOMATOM Force (Siemens Healthcare GmbH, Forchheim, Germany), a third generation, 384(2 × 192)-slice dual-source CT scanner. This scanner uses tension of 90 peak kilo voltage (kVp) and 150 kVp. A total of four different exposure levels were evaluated. The examination parameters for the four series are presented in Table I. Tube current modulation was used to keep image quality homogeneous between slices. The radiation exposures were controlled by adjusting the image quality reference parameter to match the CT dose index (CTDI) and to the desired exposure levels. In addition to a base radiation dose level (a standard protocol suggested by the manufacturer), CTDI was reduced from 100% to 50%, 25%, and 10% of the CTDI of the base radiation dose level. This corresponds to 1.5 mSv, 0.7 mSv, 0.3 mSv and 0.1 mSv.
Table I.
CT characteristics
| Radiation dose level (% of base line) | Tube peak voltage (tube 1/tube 2) (kVp) | Tube current (tube 1/tube 2) (mA) | CTDI (32 cm phantom) (mGy) | Colllimation (mm) | Pitch | Rotation time (s) | Reconstruction filter |
|---|---|---|---|---|---|---|---|
| 100 | 100/150 | 64/34 | 3.82 | 38.4 | 0.6 | 0.25 | Br59d |
| 50 | 100/150 | 31/17 | 1.86 | 38.4 | 0.6 | 0.25 | Br59d |
| 25 | 100 /150 | 15/8 | 0.91 | 38.4 | 0.6 | 0.25 | Br59d |
| 10 | 100/150 | 5/5 | 0.37 | 38.4 | 1.0 | 0.25 | Br59d |
-
CTDI, computed tomography dose; mGy, milliGray; kVp, peak kilo voltage; mA, milliAmpere
The images were reconstructed with a reconstruction diameter of 23 cm.
VMS images were reconstructed with a syngo-via workstation (Siemens Medical Solutions, Erlangen, Germany) for 100 keV and 150 keV and were compared with a polychromatic (mixed) reconstruction (MPR). VMS with the two energy levels, 100 keV and 150 keV, was chosen because it has been shown to reduce beam hardening artefacts.17 We chose 100 keV because a lower keV VMS might have advantages when evaluating bone defects in contact with the metal component.24 For iterative reconstruction we used ADMIRE (Siemens Healthcare, Forchheim, Germany) to post-process the images to remove metal artefacts. It has five different levels of iterations, from 1 to 5.30,31 Two levels of iterative reconstructions, ADMIRE level 0 (switched off) and ADMIRE level 5 (highest level of iterative reconstruction) were tested for 100 keV and 150 keV VMS and MPR.
Image evaluation
In total, 24 series were evaluated. These correspond to four exposure levels: 1.5 mSv, 0.7 mSv, 0.3 mSv and 0.1 mSv, together with the different CT reconstructions (two levels of ADMIRE, two VMS and two polychromatic reconstructions, MPR). In all, two investigators (BS and MS), one radiologist with more than ten years’ experience reading CT images and one orthopaedic surgeon, evaluated the images on an EIZO RadiForce Rx340 monitor workstation (EIZO Global, Cypress, California). The investigators were able to scroll through the coronal plane, but were blinded to the acquisition and reconstruction parameters. Measurements were made on the same pre-indicated images to keep consistency in the evaluations. Measurements of the created bone defects in the pelvis were referred to as measurements of osteolysis, and measurements of the shortest distance between the prosthetic head and the inner surface of the metal shell of the acetabular component were referred to as measurements of wear. Linear wear on left and right side, the depth of osteolysis on the left side, and the width of the osteolysis on the right side were measured (Fig. 1). Two observers (as above) independently evaluated these measurements one week apart.
Statistical analysis
The measurements for each observer are presented as box plots (Fig. 3). These show the difference between the micrometer measurement and the observed measurment for each observer, for each trial designated as B1, B2 and M1 and M2. Accuracy, the closeness of agreement between a test result and the accepted reference value, was calculated for osteolysis and linear wear (Fig. 4).32 The repeatability, the closeness of a results obtained by the same observer in the same laboratory using the same material, is shown in Table II where the results from both investigators’ first and second measurements are shown. This was calculated based on mAs alone, ignoring energy (VMS or MPR) and iterative reconstruction (ADMIRE level). A principle component analysis (PCA) was performed which showed the correlation of radiation exposure (in terms of mAs), energy (VSM or MPR) reconstruction, and iterative reconstruction (ADMIRE level) on the measurements. A Bland-Altman plot was also done for both the osteolysis depth and width and for the right and left wear.
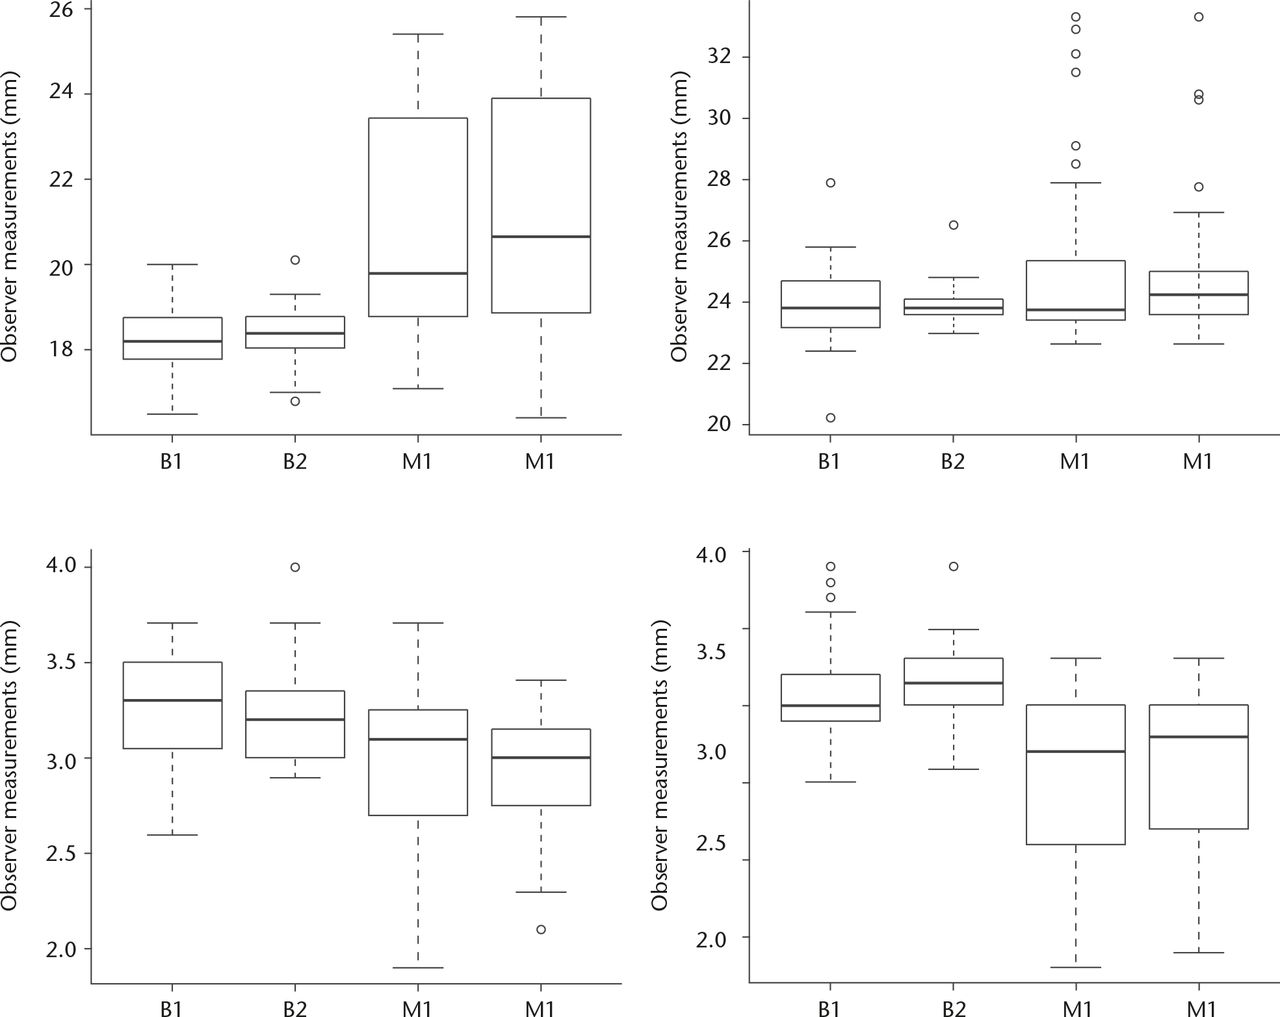
Fig. 3
Box plots show the difference between the micrometer measurement and the observed measurment for each observer, for each trial designated as B1, B2 and M1 and M2. Caliper measurements of plastic casts (1, 2) : upper left: left osteolysis; 19 mm depth, upper right: right osteolysis, 24 mm width; lower left: left linear wear, 3.4 mm; lower right: right linear wear, 2.9 mm. Osteolysis on the left side was connected to the acetabular central groove which can explain the difference between measurements from BS and MS.
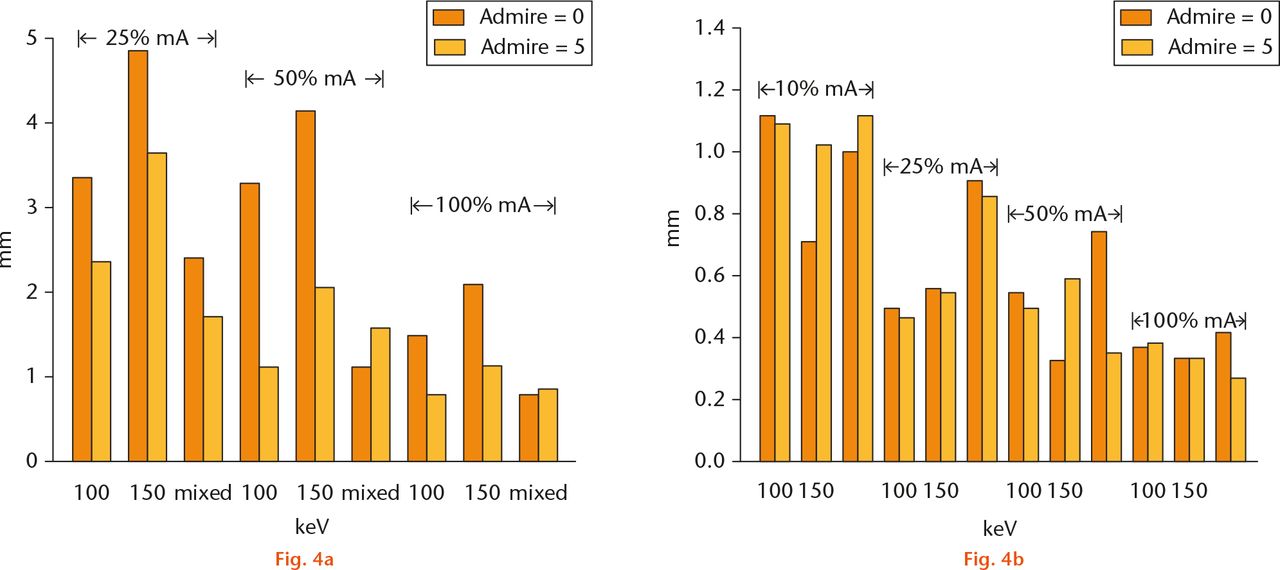
Fig.
Images showing a) osteolysis accuracy: the difference in measurements for both observers compared with actual measured distances. There were too many missing values at 10% radiation levels for both observers, hence these results are not shown; b) wear accuracy: accuracy is between 0.5 mm and 1.0 mm for all measurements.
Table II.
Approximate repeatability based on milliAmperes (mA) alone, ignoring the fact that the iterative reconstruction (ADMIRE levels) and energy (virtual monochromatic spectral imaging, polychromatic (mixed) reconstruction) values are changing. All values are in mm
| Orthopaedic surgeon (BS) |
Radiologist (MS) |
|||||||
|---|---|---|---|---|---|---|---|---|
| mA (%) of baseline | Osteolysis left width | Osteolysis right width | Wear left | Wear right | Osteolysis left width | Osteolysis right width | Wear left | Wear right |
| 100 | 1.53 | 1.45 | 0.67 | 0.42 | 2.49 | 1.09 | 0.50 | 0.67 |
| 50 | 3.04 | 3.00 | 0.79 | 0.73 | 5.41 | 1.54 | 0.64 | 0.66 |
| 25 | 1.02 | 2.99 | 0.69 | 0.97 | 4.97 | 6.73 | 0.99 | 1.31 |
| 10 | 4.75 | 2.15 | 0.85 | 0.67 | 6.11 | 10.00 | 1.13 | 1.19 |
Effective dose calculations
The effective dose resulting from the examinations in this study that would be given to a human, if all scan parameters except scan length were kept constant, were estimated. First, a dose length product (DLP) was calculated by multiplying CTDI by the scan length used for CT examinations of the hip (mean scan length for 20 random cases, 186 mm). The DLPs were then converted to effective dose by multiplying the DLP by a conversion factor.33
Results
There was a small difference between the caliper measurement and the measurements made by each individual observer for the two trials. However, there was a larger difference between observers (Fig. 3 and Table II). This was because the radiologist (MS) was more sensitive to the change in mAs as was determined by the PCA. The Bland-Altman plots showed that the wear measurements were more consistent between the observers, as the osteolysis measurements were more influenced by the change in mAs. Furthermore, the osteolysis on the left side was connected to the acetabular central groove which can explain the difference between measurements from BS and MS.
With the plastic moulds from the bone deficiencies, accuracy values for measured osteolysis and wear could be calculated and are presented in Tables III and IV. The bone defect imitating osteolysis could not be reliably measured on the lowest effective radiation level (0.1 mSv). Radiation exposure (proportional to mA) was the most important factor when measuring accuracy (Fig. 4). For osteolysis measurements, the MPR was more accurate than VMS 100 keV, which was more accurate than VMS 150 keV. ADMIRE had best effect on VMS, but almost no effect on MPR. For the wear measurements there were only minor differences between MPR and VMS. The variations in measurements for wear were small and the radiation exposure had minimal effect on accuracy (Fig. 4).
Table III.
Accuracy for osteolysis in mm. At 10% radiation levels, the observers had missing values; 50% radiation level shows accuracy approximately 1 mm with virtual monochromatic spectral imaging 100 kiloelectron volts (keV) and polychromatic (mixed) reconstruction 120 peak kilo voltage (kVp) and ADMIRE 5 (Siemens Healthcare)
| Radiation level/reconstruction | 10%/0.1 mSv | 25%/0.3 mSv | 50%/0.7 mSv | 100%/1.5 mSv |
|---|---|---|---|---|
| Monochromatic reconstrution 100 keV/ADMIRE = 0 | N/A | 3.4 | 3.3 | 1.5 |
| Monochromatic reconstrution 100 keV/ADMIRE = 5 | N/A | 2.3 | 1.1 | 0.8 |
| Monochromatic reconstrution 150 keV/ADMIRE = 0 | N/A | 4.8 | 4.1 | 2.0 |
| Monochromatic reconstrution 150 keV/ADMIRE = 5 | N/A | 3.6 | 2.0 | 1.1 |
| Polychromatic approx.120 kVp/ADMIRE = 0 | N/A | 2.4 | 1.1 | 0.8 |
| Polychromatic approx.120 kVp/ADMIRE = 5 | N/A | 1.7 | 1.6 | 0.8 |
-
N/A, not applicable; mSv, millisieverts; approx., approximately
Table IV.
Accuracy for wear in mm. Even with very low radiation levels, accuracy was approximately 1 mm
| Radiation level/ reconstruction | 10%/0.1 mSv | 25%/0.3 mSv | 50%/0.7 mSv | 100%/1.5 mSv |
|---|---|---|---|---|
| Monochromatic reconstrution 100 keV/ADMIRE = 0 | 1.1 | 0.5 | 0.5 | 0.4 |
| Monochromatic reconstrution 100 keV/ADMIRE = 5 | 1.1 | 0.5 | 0.5 | 0.4 |
| Monochromatic reconstrution 150 keV/ADMIRE = 0 | 0.7 | 0.6 | 0.3 | 0.3 |
| Monochromatic reconstrution 150 keV/ADMIRE = 5 | 1.0 | 0.5 | 0.6 | 0.3 |
| Polychromatic approx. 120 kVp/ADMIRE = 0 | 1.1 | 0.9 | 0.7 | 0.4 |
| Polychromatic approx. 120 kVp/ADMIRE = 5 | 1.0 | 0.9 | 0.3 | 0.3 |
-
mSv, millisieverts; keV, kiloelectron volt; kVp, peak kilo voltage
When using a low level of radiation, iterative reconstructions improved the accuracy for osteolysis (Table III, Fig. 4). Lower keV for VMS increased accuracy for bone defect around the component (Tables III and IV).
The effective human dose based on the examinations reported in this study are presented in Table V.
Table V.
Calculated effective dose for different radiation exposure levels
| Radiation exposure level (% of base line) | Effective dose (mSv) |
|---|---|
| 100 | 1.5 |
| 50 | 0.7 |
| 25 | 0.3 |
| 10 | 0.1 |
-
mSv, millisieverts
Discussion
In this study we have shown that linear wear can be measured with an accuracy of approximately 0.5 mm with a radiation level similar to the level we normally use in plain radiographic examination (PRI) of the hip (0.7 mSv). Using CT, wear can be detected circumferentially around the acetabular component, which can be difficult when using PRI. PAO could be measured with an accuracy of less than 2 mm at the same radiation level, which we consider would be sufficient in clinical practice. The two observers’ measurements were fairly consistent between the first and second measurement, but there was a larger difference between the observers on both occasions. This may be due to the lack of sclerotic rim, which is normally seen at the boundaries of osteolytic lesions in humans and makes it harder to define the borders of the defect. At the lowest radiation exposure - level 0.1 mSv (10%) - there were several missing values, particularly for the monochromatic reconstructions, making this dose level insufficient for clinical use.
We used a very modern CT scanner with advanced software, which is probably the reason for the already low effective dose at 100% radiation exposure level (1.5 mSv). Radiation doses were also low due to the size of the pelvis. Even considering the fact that radiation doses were calculated for adult humans, the porcine pelvis was the size of that of an eight-year-old child and therefore more easily penetrated by radiation.
One main issue is what accuracy we are willing to accept. If 0.5 mm is acceptable for wear measurement, then 0.7 mSv (50%) radiation exposure levels are sufficient for metal-to-metal measurements, such as linear wear. VMS with 150 keV is preferable compared with lower energies, although differences are very small. For PAO, accuracy was approximately 2 mm in this study. There was little difference between 100% and 50% radiation exposure level and with iterative reconstructions; the radiation exposure level could be reduced to 25% without major loss of accuracy when measuring PAO. Other authors have described very low and even extremely low radiation exposure levels for CT.30,31,34 However, those studies have not included large metal implants.
Some limitations of this study include the small size of the porcine pelvis and the fact that the surrounding soft tissue was replaced by iodinated contrast medium. The image quality therefore does not give an exact reflection of a human pelvis for these effective dose levels. Further trials on humans are needed to learn the extent to which radiation exposure levels using CT can be reduced while maintaining acceptable image quality for clinical use.
Some strengths of this study include the repeatable conditions for measuring the periacetabular bone defects and the distance between the metal objects of known size, which made it possible to calculate accuracy. The use of two independent and blinded reviewers for assessment of the CT images was also a strength in this study.
For screening purposes in arthroplasty assessment, a polychromatic CT with iterative reconstruction is preferred as it provides high accuracy for both metal-to-metal measurements and defects in the surrounding bone.
In conclusion, our results indicate that prosthetic linear wear and PAO could be assessed with clinically acceptable accuracy at a CT radiation exposure level on a par with conventional radiographic examination. A polychromatic CT with iterative reconstruction provided the highest accuracy.
Supplementary Material
Examples of some of the images taken can be found alongside the paper at http://www.bjr.boneandjoint.org.uk/
Funding Statement:
None declared.
ICMJE conflict of interest:
None declared.
References
1 Hallan G , LieSA, HavelinLI. High wear rates and extensive osteolysis in 3 types of uncemented total hip arthroplasty: a review of the PCA, the Harris Galante and the Profile/Tri-Lock Plus arthroplasties with a minimum of 12 years median follow-up in 96 hips. Acta Orthop2006;77:575-584.CrossrefPubMed Google Scholar
2 Puolakka TJ , LaineHJ, MoilanenTP, KoivistoAM, PajamäkiKJ. Alarming wear of the first-generation polyethylene liner of the cementless porous-coated Biomet Universal cup: 107 hips followed for mean 6 years. Acta Orthop Scand2001;72:1-7.CrossrefPubMed Google Scholar
3 Pijls BG , NieuwenhuijseMJ, FioccoM, et al.. Early proximal migration of cups is associated with late revision in THA: a systematic review and meta-analysis of 26 RSA studies and 49 survivalstudies. Acta Orthop2012;83:583-591.CrossrefPubMed Google Scholar
4 Leung S , NaudieD, KitamuraN, WaldeT, EnghCA. Computed tomography in the assessment of periacetabular osteolysis. J Bone Joint Surg [Am]2005;87-A:592-597.CrossrefPubMed Google Scholar
5 Claus AM , TottermanSM, SychterzCJ, et al.. Computed tomography to assess pelvic lysis after total hip replacement. Clin Orthop Relat Res2004;422:167-174.CrossrefPubMed Google Scholar
6 Barrett JF , KeatN. Artifacts in CT: recognition and avoidance. Radiographics2004;24:1679-1691.CrossrefPubMed Google Scholar
7 Sandgren B , CrafoordJ, GarellickG, et al.. Computed tomography vs. digital radiography assessment for detection of osteolysis in asymptomatic patients with uncemented cups: a proposal for a new classification system based on computer tomography. J Arthroplasty2013;28:1608-1613.CrossrefPubMed Google Scholar
8 Koch KM , HargreavesBA, PaulyKB, et al.. Magnetic resonance imaging near metal implants. J Magn Reson Imaging2010;32:773-787.CrossrefPubMed Google Scholar
9 Koff MF , ShahP, KochKM, PotterHG. Quantifying image distortion of orthopedic materials in magnetic resonance imaging. J Magn Reson Imaging2013;38:610-618.CrossrefPubMed Google Scholar
10 Koff MF , ShahP, PotterHG. Clinical implementation of MRI of joint arthroplasty. AJR Am J Roentgenol2014;203:154-161.CrossrefPubMed Google Scholar
11 Waldstein W , Schmidt-BraeklingT, BoettnerF. MRI does not detect acetabular osteolysis around metal-on-metal Birmingham THA. Arch Orthop Trauma Surg2014;134:1009-1015. Google Scholar
12 Berrington de , GonzálezA, DarbyS. Risk of cancer from diagnostic X-rays: estimates for the UK and 14 other countries. Lancet2004;363:345-351.CrossrefPubMed Google Scholar
13 No authors listed. ICRP. The 2007 Recommendations of the International Commission on Radiological Protection. http://www.icrp.org/publication.asp?id=ICRP%20Publication%20103 (date last accessed 16 June 2016).[[bibmisc]] Google Scholar
14 No authors listed. AAPM Report No. 96. The Measurement, Reporting and Management of Radiation Dose in CT. https://www.aapm.org/pubs/reports/RPT_96.pdf (date last accessed 16 June 2016).[[bibmisc]] Google Scholar
15 No authors listed. Swedish Radiation Safety Authority SR. http://www.stralsakerhetsmyndigheten.se/In-English/About-the-Swedish-Radiation-Safety-Authority1/ (date last accessed 5 April 2016).[[bibmisc]] Google Scholar
16 Lee MJ , KimS, LeeSA, et al.. Overcoming artifacts from metallic orthopedic implants at high-field-strength MR imaging and multi-detector CT. Radiographics2007;27:791-803.CrossrefPubMed Google Scholar
17 Lewis M , ReidK, TomsAP. Reducing the effects of metal artefact using high keV monoenergetic reconstruction of dual energy CT (DECT) in hip replacements. Skeletal Radiol2013;42:275-282.CrossrefPubMed Google Scholar
18 Morsbach F , BickelhauptS, WannerGA, et al.. Reduction of metal artifacts from hip prostheses on CT images of the pelvis: value of iterative reconstructions. Radiology2013;268:237-244.CrossrefPubMed Google Scholar
19 Stradiotti P , CurtiA, CastellazziG, ZerbiA. Metal-related artifacts in instrumented spine. Techniques for reducing artifacts in CT and MRI: state of the art. Eur Spine J2009;18(Suppl 1):102-108.CrossrefPubMed Google Scholar
20 Winklhofer S , BenningerE, SprossC, et al.. CT metal artefact reduction for internal fixation of the proximal humerus: value of mono-energetic extrapolation from dual-energy and iterative reconstructions. Clin Radiol2014;69:e199-e206.CrossrefPubMed Google Scholar
21 Vande Berg B , MalghemJ, MaldagueB, LecouvetF. Multi-detector CT imaging in the postoperative orthopedic patient with metal hardware. Eur J Radiol2006;60:470-479.CrossrefPubMed Google Scholar
22 Link TM , BerningW, ScherfS, et al.. CT of metal implants: reduction of artifacts using an extended CT scale technique. J Comput Assist Tomogr2000;24:165-172.CrossrefPubMed Google Scholar
23 Fishman EK , MagidD, RobertsonDD, et al.. Metallic hip implants: CT with multiplanar reconstruction. Radiology1986;160:675-681.CrossrefPubMed Google Scholar
24 Pessis E , CampagnaR, SverzutJM, et al.. Virtual monochromatic spectral imaging with fast kilovoltage switching: reduction of metal artifacts at CT. Radiographics2013;33:573-583.CrossrefPubMed Google Scholar
25 Grant KL , FlohrTG, KraussB, et al.. Assessment of an advanced image-based technique to calculate virtual monoenergetic computed tomographic images from a dual-energy examination to improve contrast-to-noise ratio in examinations using iodinated contrast media. Invest Radiol2014;49:586-592.CrossrefPubMed Google Scholar
26 Yang WJ , YanFH, LiuB, et al.. Can sinogram-affirmed iterative (SAFIRE) reconstruction improve imaging quality on low-dose lung CT screening compared with traditional filtered back projection (FBP) reconstruction?J Comput Assist Tomogr2013;37:301-305.CrossrefPubMed Google Scholar
27 Mahnken AH , RaupachR, WildbergerJE, et al.. A new algorithm for metal artifact reduction in computed tomography: in vitro and in vivo evaluation after total hip replacement. Invest Radiol2003;38:769-775.CrossrefPubMed Google Scholar
28 Boas FE , FleischmannD. Evaluation of two iterative techniques for reducing metal artifacts in computed tomography. Radiology2011;259:894-902.CrossrefPubMed Google Scholar
29 Hara AK , PadenRG, SilvaAC, et al.. Iterative reconstruction technique for reducing body radiation dose at CT: feasibility study. AJR Am J Roentgenol2009;193:764-771.CrossrefPubMed Google Scholar
30 Hardie AD , TipnisSV, RieterWJ, RissingMS, De CeccoCN. Physician preference between low-dose computed tomography with a sinogram-affirmed iterative reconstruction algorithm and routine-dose computed tomography with filtered back projection in abdominopelvic imaging. J Comput Assist Tomogr2013;37:932-936.CrossrefPubMed Google Scholar
31 Newell JD Jr , FuldMK, AllmendingerT, et al.. Very low-dose (0.15 mGy) chest CT protocols using the COPDGene 2 test object and a third-generation dual-source CT scanner with corresponding third-generation iterative reconstruction software. Invest Radiol2015;50:40-45.CrossrefPubMed Google Scholar
32 Ranstam J , RydL, OnstenI. Accurate accuracy assessment: review of basic principles. Acta Orthop Scand2000;71:106-108.CrossrefPubMed Google Scholar
33 Huda W , OgdenKM, KhorasaniMR. Converting dose-length product to effective dose at CT. Radiology2008;248:995-1003.CrossrefPubMed Google Scholar
34 Gurung J , KhanMF, MaataouiA, et al.. Multislice CT of the pelvis: dose reduction with regard to image quality using 16-row CT. Eur Radiol2005;15:1898-1905.CrossrefPubMed Google Scholar
