


Abstract
Objectives
The Oxford Hip and Knee Scores (OHS, OKS) have been demonstrated to vary according to age and gender, making it difficult to compare results in cohorts with different demographics. The aim of this paper was to calculate reference values for different patient groups and highlight the concept of normative reference data to contextualise an individual’s outcome.
Methods
We accessed prospectively collected OHS and OKS data for patients undergoing lower limb joint arthroplasty at a single orthopaedic teaching hospital during a five-year period. T-scores were calculated based on the OHS and OKS distributions.
Results
Data were obtained from 3203 total hip arthroplasty (THA) patients and 2742 total knee arthroplasty (TKA) patients. The mean age of the patient was 68.0 years (sd 11.3, 58.4% women) in the THA group and in 70.2 (sd 9.4; 57.5% women) in the TKA group. T-scores were calculated for age and gender subgroups by operation. Different T-score thresholds are seen at different time points pre and post surgery. Values are further stratified by operation (THA/TKA) age and gender.
Conclusions
Normative data interpretation requires a fundamental shift in the thinking as to the use of the Oxford Scores. Instead of reporting actual score points, the patient is rated by their relative position within the group of all patients undergoing the same procedure. It is proposed that this form of transformation is beneficial (a) for more appropriately comparing different patient cohorts and (b) informing an individual patient how they are progressing compared with others of their age and gender.
Cite this article: Bone Joint Res 2015;4:137–144
Article focus
- The well-used Oxford Hip and Knee Scores (OHS, OKS) report a single-outcome metric that is known to be influenced by patient demographics.
- Comparing an individual’s score with a reference population allows contextualisation of that individual’s outcome against an appropriate reference group.
Key messages
- Modern psychometric tests typically employ normative reference populations. We provide reference population models for the OHS and OKS stratified by age deciles and gender subgroups.
- It is proposed that this form of transformation is beneficial for more appropriately comparing different patient cohorts and informing an individual patient how they are progressing compared with others of the same age and gender.
Strengths and limitations
- Strengths of this approach are the direct translation of routinely collected population data to the individual patient consultation, where the individual can be assessed relative to their specific peer group.
- Despite using a large regional dataset, the primary limitation of this pilot work is the limited dataset with which we derived our models. Very large data volumes are required to create subgroups with sufficient patient numbers to create more definitive models which include additional stratifying factors, such as comorbidities.
Introduction
The use of patient reported outcome measure (PROM) data is well established in orthopaedics. PROMs are an important tool in outcomes research and quality assurance, in that they ascertain the patient’s perception of success.1 Proponents of these suggest they provide a remarkably sophisticated measure of not just whether a patient feels better, but how much better they feel.2
In the United Kingdom, the most recognisable orthopaedic PROMs are Oxford Hip and Knee Scores (OHS, OKS).3,4 These were developed in the late 1990s to assess the patient’s perception of pain and physical function and have been widely used in clinical trials, local service evaluation and national registries. Since the Darzi report in 2008,5 the NHS has routinely collected outcomes data through the Health and Social Care Information Centre (HSCIC) which includes the OHS and OKS pre-operatively and six months post-operatively, in efforts to enhance care quality. Vast data repositories now exist; for example, in 2013, The National Joint Registry reported Oxford Score outcome data on 250 000 arthroplasty patients, with linked pre and post-operative scores on over 180Â 000 patients.6 Such huge data sets have been processed in research studies, yielding numerous publications and providing evidence to inform healthcare policy.
The OHS and OKS have been demonstrated to vary by various patient demographics, making it difficult to compare results in different cohorts. Patient age at time of surgery is a pertinent example, where the typical 50-year-old male and 90-year-old female would expect differing levels of function following surgery. As such, an absolute score of 38 points may reflect a reasonable or poor outcome depending on the patient that reports this.
The Oxford Scores are typically administered in pen and paper fashion, with completed questionnaires returned to the co-ordinator by post. Some centres are piloting the use of tablet computers in the clinic waiting room in efforts to ease the processing burden and reduce the loss to follow-up associated with paper based postal surveys. This electronic data, however, are generally used in the same manner, in that they are uploaded to a central database and analysed retrospectively at the population level. Unless individual surgeons enquire as to the patient scores directly, there is no obvious translation of the individual’s questionnaire responses into that particular care episode. This same computer technology though offers an evolution in the way we use individual patient questionnaire data. Electronic PROMs can provide instantaneous scoring and graphical display of an individual’s results. This could then be fed back to the patient as a means to quantify progress during the patient–surgeon consultation. Before modern technology can facilitate an evolution of the usage of the Oxford Scores, the individual’s scores need to be interpreted in a more meaningful way. Stating absolute numbers (such as a score of 43 points or change in score of 12 points) is not particularly helpful when considering the individual patient. The numbers need to be put into context.
This is routinely done in wider clinical practice. From assessing blood pressure to measuring CRP, an individual’s results are compared with population reference ranges in order to inform clinical decision making. Now that very large ‘population’ volumes of Oxford Score data are available through the national registries, it is theoretically possible to contextualise an individual’s Oxford Score in a similar manner; by comparing the individual’s scores to the wider arthroplasty population. This can be done by normalising the scores and reporting patient outcome using T-score methodology. T-scores have been used to increase interpretability of psychiatric questionnaires7 for decades and are currently employed by the United States-based patient reported outcomes measurement information system (PROMIS), a large-scale project developing measures for key patient-reported outcome concepts for use across various medical fields.8-10 A ready orthopaedic example of the use of T-scores is in the measurement of bone mineral density. This is not given by g/cm2, but by a T-score representing the individual’s density (g/cm2) in relation to the number of standard deviations (sds) above or below the mean for a healthy 30-year-old adult of the same sex and ethnicity as the patient.
The aim of this study was to calculate reference population scores using T-score methodology to demonstrate the use of normative population values for different patient groups. It is proposed that this form of transformation is beneficial (a) for more appropriately comparing different patient cohorts and (b) informing an individual patient how they are progressing compared with others of their age and gender.
Patients and Methods
We accessed prospectively collected data for patients undergoing lower limb joint arthroplasty at a single NHS teaching hospital during a five-year period (January 2007 to December 2011). The study centre is the only hospital receiving adult referrals for a predominantly urban population of around 850 000.11 Data had been collected through informed consent for inclusion in a departmental database, for which regional ethical approval had been obtained (11/AL/0079).
Procedures were carried out by multiple consultant orthopaedic surgeons (including JTP and CRH) and their supervised trainees. All data were collected independently from the clinical team by the arthroplasty outcomes research unit of the associated university. All patients completed pre-operative OHS or OKS questionnaires in clinic and by postal follow-up questionnaires at six and 12 months post-operatively. Demographic data including age, gender and comorbidities, were reported by the patient as part of the survey.
Oxford Scores
The Oxford Scores3,4 were developed in the late 1990s to assess the outcome of hip or knee surgery and have undergone rigorous assessment of validity and reliability.12 Each score consists of 12 equally weighted questions addressing the patient’s perceived pain and functional activity answered on a Likert scale with values form 0 to 4. The score ranges from 0 to 48, with overall score calculated from the responses to the 12 questions. A score of 0 is the worst possible outcome, suggesting severe symptoms and dysfunction, while 48 is the best possible outcome.
Statistical analysis
Normative datasets were created for all data time points (pre-operatively, and six and 12 months post-operatively). T-scores were calculated based on the OHS and OKS score distributions in our regional registry data. T-scores provide a standardised score distribution with a mean of 50 (sd 10).
In case of normally distributed data, T-scores can be calculated from raw scores as follows: subtract raw score mean, divide by the sd of raw scores, multiply by 10 and add 50. In case of skewed data, this formula is not appropriate, and the rank-normal transformation is used instead. In principle, this means that every raw score corresponds to a specific percentile in that score distribution, and that every T-score corresponds to a specific percentile, thus, raw scores can be transformed to T-scores using percentiles of a reference population. As T-scores are normally distributed by definition, the skewed distribution is thereby transformed into a normal distribution.
To convert raw scores to T-scores, we provide tables for the OHS and OKS. To adjust for differences in age- or gender, we also provide specific score tables which enable relation of a patient to a reference population with same age and/or gender.
Results
Patient characteristics
We retrieved data from 3203 hip patients and 2742 knee patients who underwent lower limb arthroplasty at the study centre, which amounts to 88% of all eligible patients operated on in this time frame. Of our available dataset, we have missing data on around 1% of total hip arthroplasty (THA) patients (41;Â 1.2% missing data pre-operatively, and 43; 1.3% at six and 41Â (1.2%) at 12 months post-operatively), and slightly more in the total knee arthroplasty (TKA) patients at around 2% (58; 2.1% missing data pre-operatively, and 33; 1.2% at six and 58; 2.1% at 12 months post-operatively.
In the THA sample, the mean patient age was 68.0Â years (sd 11.3; 58.4% women). In the TKA sample, the mean age was 70.2 (sd 9.4; 57.5% women).
The most frequently reported comorbidities were pain from other joints (THA 51.5%, TKA 56.4%), high blood pressure (34.6% and 41.6%) and back pain (38.3% and 34.4%). Mean length of hospital stay was 6.1 days for THA patients and 5.9 days for TKA patients. Further details are provided in Table I.
Table I
Patient characteristics
| Total hip arthroplasty (n = 3203) | Total knee arthroplasty (n = 2742) | |
|---|---|---|
| Age mean (sd) (range) | 68.0 (11.3) (18 to 94) | 70.2 (9.4) (18 to 93) |
| Age groups: n (%) | ||
| below 60 yrs | 706 (22.0) | 391 (14.3) |
| 60 to 70 yrs | 951 (29.7) | 850 (31.0) |
| 70 to 80 yrs | 1143 (35.7) | 1094 (39.9) |
| above 80 yrs | 403 (12.6) | 407 (14.8) |
| Gender n (%) M:F | 1333 (41.6):1870 (58.4) | 1164 (42.5):1578 (57.5) |
| Comorbidities: n (%) | ||
| Heart disease | 288 (11.5) | 336 (15.0) |
| High blood pressure | 869 (34.6) | 930 (41.6) |
| Lung disease | 213 (8.5) | 217 (9.7) |
| Vascular diseases | 124 (4.9) | 103 (4.6) |
| Neurological diseases | 100 (4.0) | 98 (4.4) |
| Diabetes | 213 (8.5) | 262 (11.7) |
| Stomach ulcer | 98 (3.9) | 94 (4.2) |
| Kidney disease | 62 (2.5) | 54 (2.4) |
| Liver disease | 47 (1.9) | 35 (1.3) |
| Anaemia | 116 (4.6) | 133 (5.9) |
| Depression | 222 (8.8) | 233 (10.4) |
| Back pain | 961 (38.3) | 770 (34.4) |
| Pain from other joints | 1293 (51.5) | 1262 (56.4) |
| Length of hospital stay (days):mean (sd) (range) | 6.1 (3.5) (0 to 42) | 5.9 (3.2) 0 to 47 |
-
* Unknown for 692 (21.6%) of hip patients, percentages refer to valid cases (n = 2511) Unknown for 505 (18.4%) of knee patients, percentages refer to valid cases (n = 2237)
Normative data
The pre-operative scores were normally distributed, though there was a shift to the right in post-operative scores reflecting the positive effect of arthroplasty in alleviating pain and enhancing patient function. Data from all time points were converted to T-scores as described. A T-score of 50 represents the mean population score, a T-score of 40 or 60 one sd below or above the mean score, and a score of 30 and 70 two sds below or above (Fig. 1). As two sds encompass 95.5% of all data, most patients fall somewhere within this range.
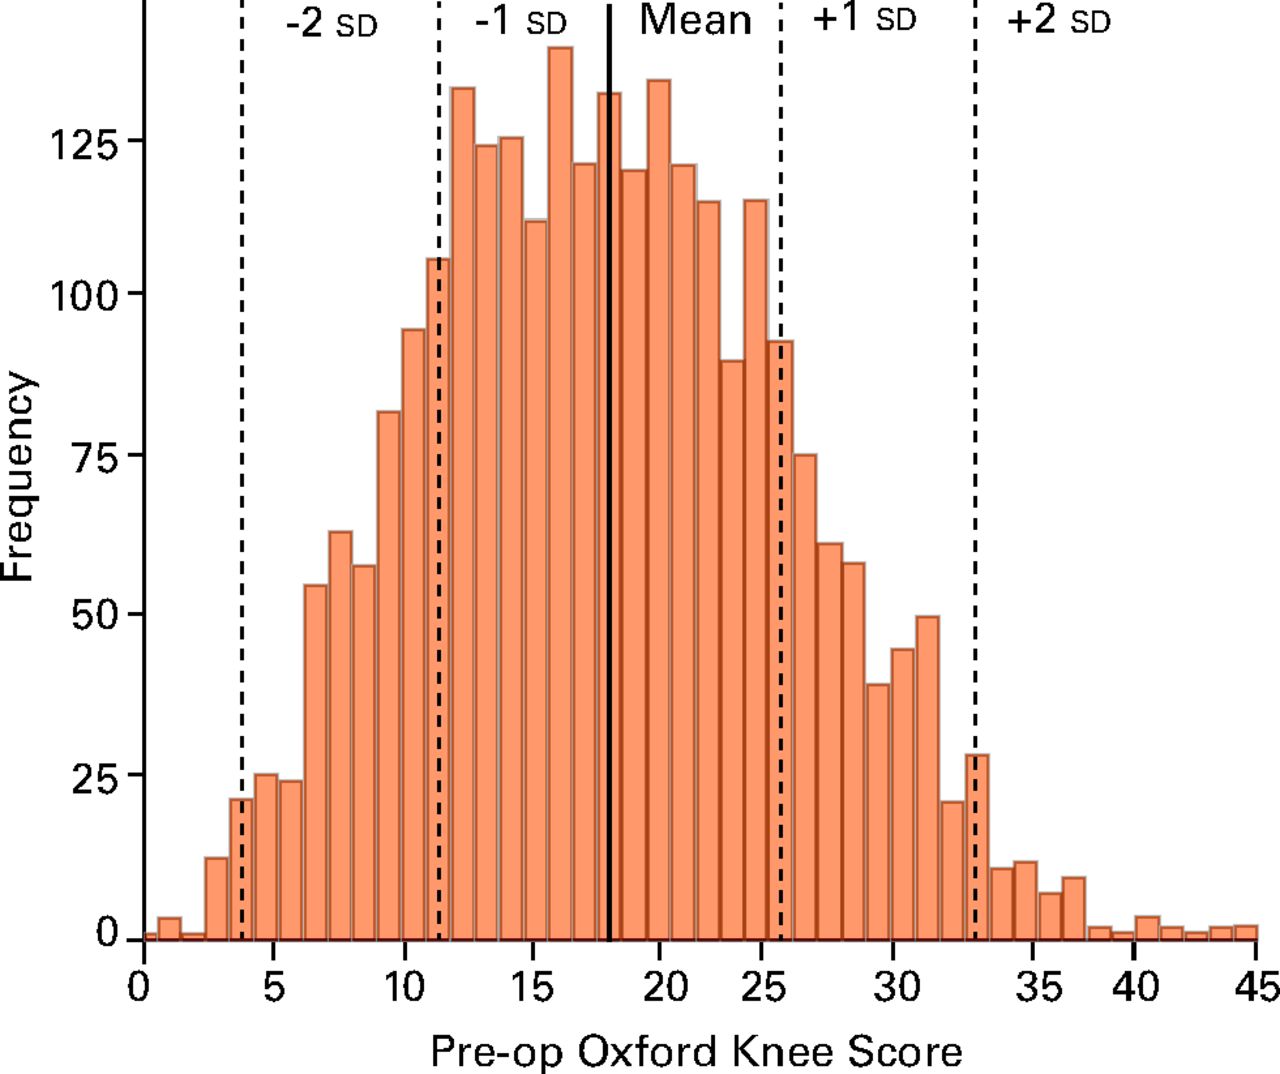
Fig. 1
Pre-operative Oxford Knee Score data from our reference population (n = 2684). Population reference data is represented by the T-score, where a score of 50 is the mean value, 40 / 60 are 1 standard deviation (sd) from the mean and 30 / 70 are 2 sds from the mean.
Different T-score thresholds are seen at different time points pre and post-surgery. Representative T-scores are displayed for both OHS and OKS pre-operatively and six and 12 months post-operatively (Table II). As an illustrative example, for the total THA population assessed in this study, a T-score of 50 represents a score of 19 points pre-operatively, and 41 points at six and 42 points at 12 months post-operatively (Table II). The scores further vary by gender (women report slightly worse scores) and age group (younger patient report better scores). This can be seen in more detail in Table III, where data are presented by gender and age subgroups. For example, an 82-year-old female undergoing TKA should be compared with her representative population group, where median scores are 15 points pre-operatively and 38 points at 12 months post-operatively; as opposed to a 55-year-old man, who would be compared with his population averages of 20 points pre-operatively and 44 points at 12 months post-operatively.
Table II
T-Scores and raw scores (points) for the Oxford Hip (OHS) and Knee (OKS) Scores
| Group | OHS Pre-op | OHS 6 months | OHS 12 months | OKS Pre-op | OKS 6 months | OKS 12 months | |
|---|---|---|---|---|---|---|---|
| All patients | n | 3161 | 3163 | 3161 | 2684 | 2709 | 2684 |
| T = 30 | 4 | 14 | 14 | 5 | 10 | 10 | |
| T = 40 | 10 | 28 | 28 | 11 | 22 | 24 | |
| T = 50 | 19 | 41 | 42 | 19 | 35 | 37 | |
| T = 60 | 28 | 46 | 47 | 27 | 43 | 44 | |
| T = 70 | 38 | 48 | 48 | 35 | 47 | 48 | |
| Gender | |||||||
| Male | n | 1320 | 1314 | 1313 | 1133 | 1149 | 1143 |
| T = 30 | 5 | 15 | 14 | 6 | 10 | 10 | |
| T = 40 | 12 | 29 | 29 | 13 | 23 | 24 | |
| T = 50 | 21 | 42 | 43 | 20 | 36 | 38 | |
| T = 60 | 29 | 47 | 47 | 28 | 44 | 45 | |
| T = 70 | 40 | 48 | 48 | 36 | 48 | 48 | |
| Female | n | 1841 | 1849 | 1848 | 1551 | 1560 | 1541 |
| T = 30 | 4 | 14 | 14 | 4 | 10 | 11 | |
| T = 40 | 9 | 27 | 27 | 10 | 22 | 23 | |
| T = 50 | 17 | 40 | 41 | 17 | 34 | 36 | |
| T = 60 | 27 | 46 | 47 | 26 | 43 | 44 | |
| T = 70 | 36 | 48 | 48 | 34 | 47 | 47 | |
| Age | |||||||
| below 60 yrs | n | 700 | 702 | 702 | 383 | 388 | 383 |
| T = 30 | 3 | 11 | 11 | 5 | 6 | 9 | |
| T = 40 | 10 | 26 | 27 | 9 | 17 | 19 | |
| T = 50 | 19 | 42 | 43 | 15 | 31 | 34 | |
| T = 60 | 28 | 47 | 48 | 23 | 42 | 44 | |
| T = 70 | 38 | 48 | 48 | 31 | 47 | 47 | |
| 60 to 70 yrs | n | 943 | 940 | 943 | 834 | 839 | 832 |
| T = 30 | 5 | 15 | 15 | 5 | 10 | 9 | |
| T = 40 | 11 | 28 | 29 | 11 | 22 | 22 | |
| T = 50 | 19 | 41 | 43 | 19 | 35 | 37 | |
| T = 60 | 29 | 46 | 47 | 27 | 43 | 44 | |
| T = 70 | 37 | 48 | 48 | 34 | 47 | 47 | |
| 70 to 80 yrs | n | 1124 | 1129 | 1122 | 1073 | 1080 | 1071 |
| T = 30 | 5 | 15 | 14 | 7 | 13 | 13 | |
| T = 40 | 11 | 28 | 29 | 12 | 24 | 25 | |
| T = 50 | 19 | 40 | 42 | 19 | 36 | 38 | |
| T = 60 | 28 | 46 | 47 | 27 | 43 | 45 | |
| T = 70 | 38 | 48 | 48 | 36 | 48 | 48 | |
| above 80 yrs | n | 394 | 392 | 394 | 394 | 402 | 398 |
| T = 30 | 3 | 15 | 15 | 4 | 11 | 10 | |
| T = 40 | 9 | 27 | 26 | 11 | 23 | 24 | |
| T = 50 | 17 | 38 | 39 | 19 | 35 | 37 | |
| T = 60 | 27 | 45 | 46 | 27 | 43 | 44 | |
| T = 70 | 37 | 48 | 48 | 37 | 47 | 48 |
Table III
Age- and gender-specific T-scores and raw scores (points) for the Oxford Hip and Knee Scores
| Group | OHS Pre-op | OHS 6 months | OHS 12 months | OKS Pre-op | OKS 6 months | OKS 12 months | |
|---|---|---|---|---|---|---|---|
| Men below 60 | n | 341 | 342 | 341 | 145 | 149 | 150 |
| T = 30 | 5 | 13 | 12 | 6 | 6 | 8 | |
| T = 40 | 11 | 28 | 30 | 11 | 16 | 18 | |
| T = 50 | 21 | 43 | 44 | 17 | 30 | 34 | |
| T = 60 | 29 | 47 | 48 | 24 | 42 | 44 | |
| T = 70 | 42 | 48 | 48 | 32 | 47 | 47 | |
| Men 60 to 70 yrs | n | 386 | 381 | 383 | 376 | 379 | 376 |
| T = 30 | 5 | 15 | 15 | 6 | 11 | 10 | |
| T = 40 | 13 | 29 | 29 | 12 | 21 | 22 | |
| T = 50 | 21 | 42 | 44 | 20 | 35 | 37 | |
| T = 60 | 29 | 47 | 48 | 28 | 43 | 45 | |
| T = 70 | 40 | 48 | 48 | 36 | 47 | 48 | |
| Men 70 to 80 yrs | n | 456 | 455 | 452 | 460 | 467 | 462 |
| T = 30 | 5 | 14 | 17 | 7 | 11 | 10 | |
| T = 40 | 12 | 29 | 29 | 13 | 256 | 26 | |
| T = 50 | 21 | 41 | 43 | 21 | 37 | 39 | |
| T = 60 | 29 | 46 | 47 | 28 | 44 | 46 | |
| T = 70 | 39 | 48 | 48 | 38 | 48 | 48 | |
| Men above 80 yrs | n | 137 | 136 | 137 | 152 | 154 | 155 |
| T = 30 | 3 | 15 | 15 | 4 | 11 | 13 | |
| T = 40 | 10 | 29 | 29 | 13 | 28 | 26 | |
| T = 50 | 20 | 40 | 41 | 23 | 38 | 39 | |
| T = 60 | 29 | 46 | 46 | 31 | 45 | 46 | |
| T = 70 | 37 | 48 | 48 | 37 | 47 | 48 | |
| Women below 60 | n | 359 | 360 | 361 | 238 | 239 | 233 |
| T = 30 | 3 | 10 | 11 | 4 | 8 | 11 | |
| T = 40 | 8 | 25 | 26 | 8 | 18 | 19 | |
| T = 50 | 17 | 40 | 41 | 15 | 32 | 34 | |
| T = 60 | 26 | 47 | 47 | 23 | 42 | 44 | |
| T = 70 | 36 | 48 | 48 | 31 | 47 | 47 | |
| Women 60 to 70 yrs | n | 557 | 559 | 560 | 458 | 460 | 456 |
| T = 30 | 4 | 15 | 14 | 4 | 9 | 9 | |
| T = 40 | 10 | 28 | 29 | 10 | 22 | 23 | |
| T = 50 | 17 | 40 | 42 | 18 | 35 | 37 | |
| T = 60 | 28 | 46 | 47 | 26 | 43 | 44 | |
| T = 70 | 35 | 48 | 48 | 34 | 47 | 47 | |
| Women 70 to 80 yrs | n | 668 | 674 | 670 | 613 | 613 | 609 |
| T = 30 | 5 | 15 | 14 | 6 | 13 | 13 | |
| T = 40 | 10 | 28 | 28 | 12 | 23 | 25 | |
| T = 50 | 18 | 40 | 41 | 18 | 34 | 37 | |
| T = 60 | 27 | 46 | 47 | 26 | 42 | 44 | |
| T = 70 | 37 | 48 | 48 | 33 | 47 | 47 | |
| Women above 80 yrs | n | 257 | 256 | 257 | 242 | 248 | 243 |
| T = 30 | 3 | 12 | 15 | 3 | 10 | 10 | |
| T = 40 | 9 | 26 | 25 | 11 | 22 | 23 | |
| T = 50 | 15 | 37 | 38 | 17 | 33 | 34 | |
| T = 60 | 27 | 44 | 45 | 25 | 43 | 43 | |
| T = 70 | 36 | 48 | 48 | 35 | 47 | 48 |
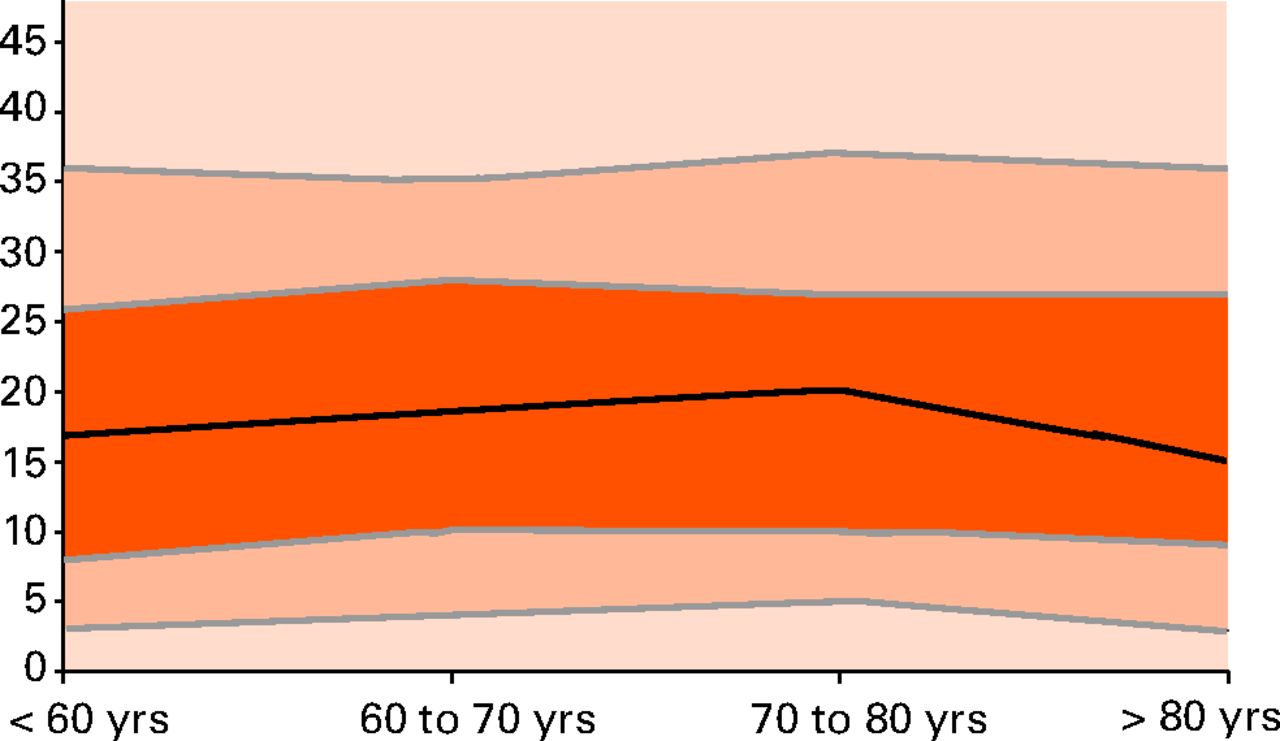
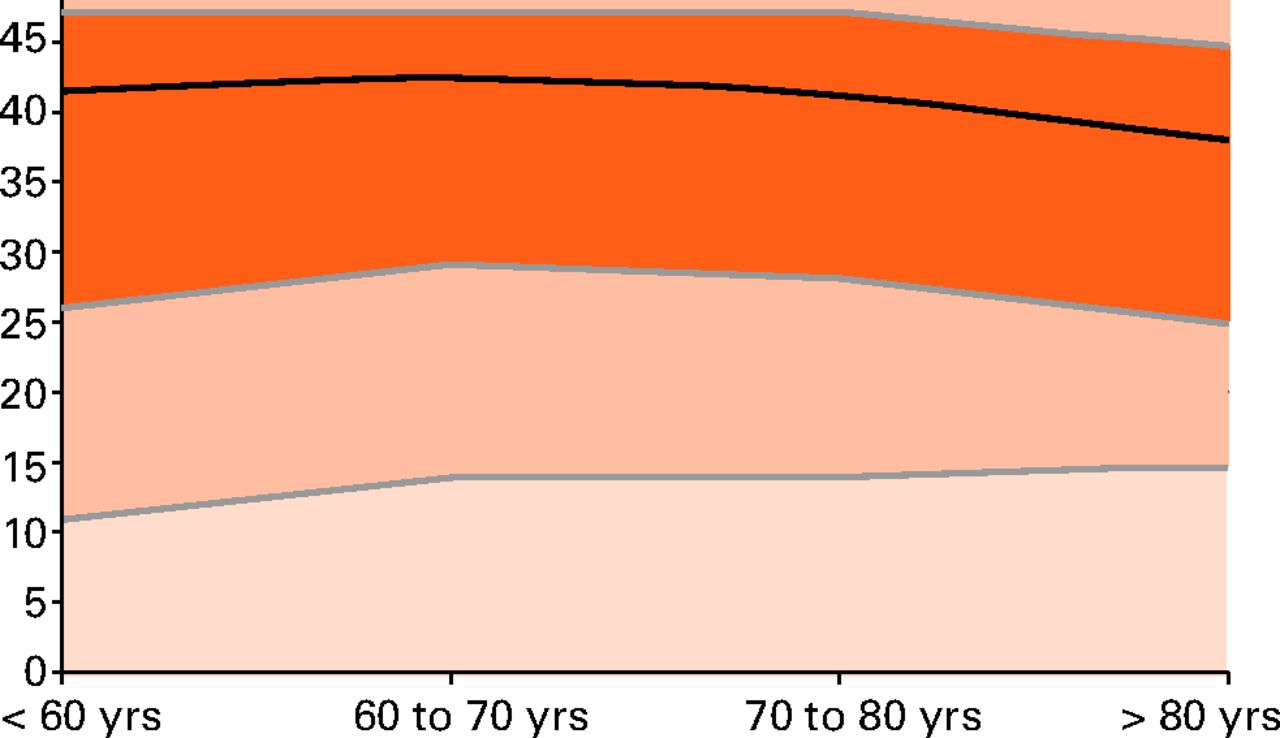
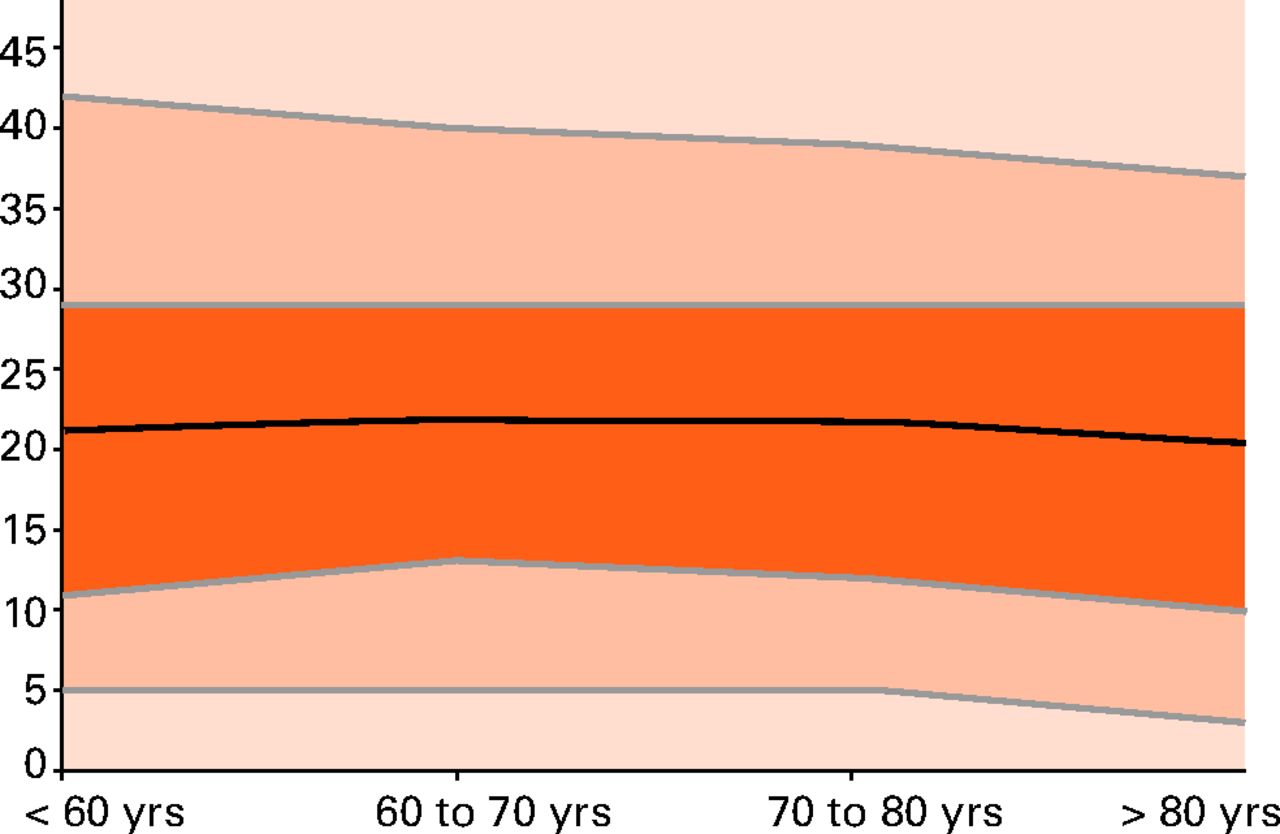
Reference charts can be created to compare individual patients against their appropriate subgroup. Figure 2 displays age-adjusted hip replacement reference T-scores. Separate charts are required to accommodate the different reference ranges pre and post-operation, and for the different gender reference scores. OHS population ranges are plotted by age decile for female patients pre-operatively (a) and at 12 months following THA (b); and separately for male patients pre-operatively (c) and at 12 months post-operatively (d). The actual OHS is on the y axis in order to allow comparison of individual patient scores with the population ranges. Equally, separate charts are required to display the separate THA and TKA reference scores.
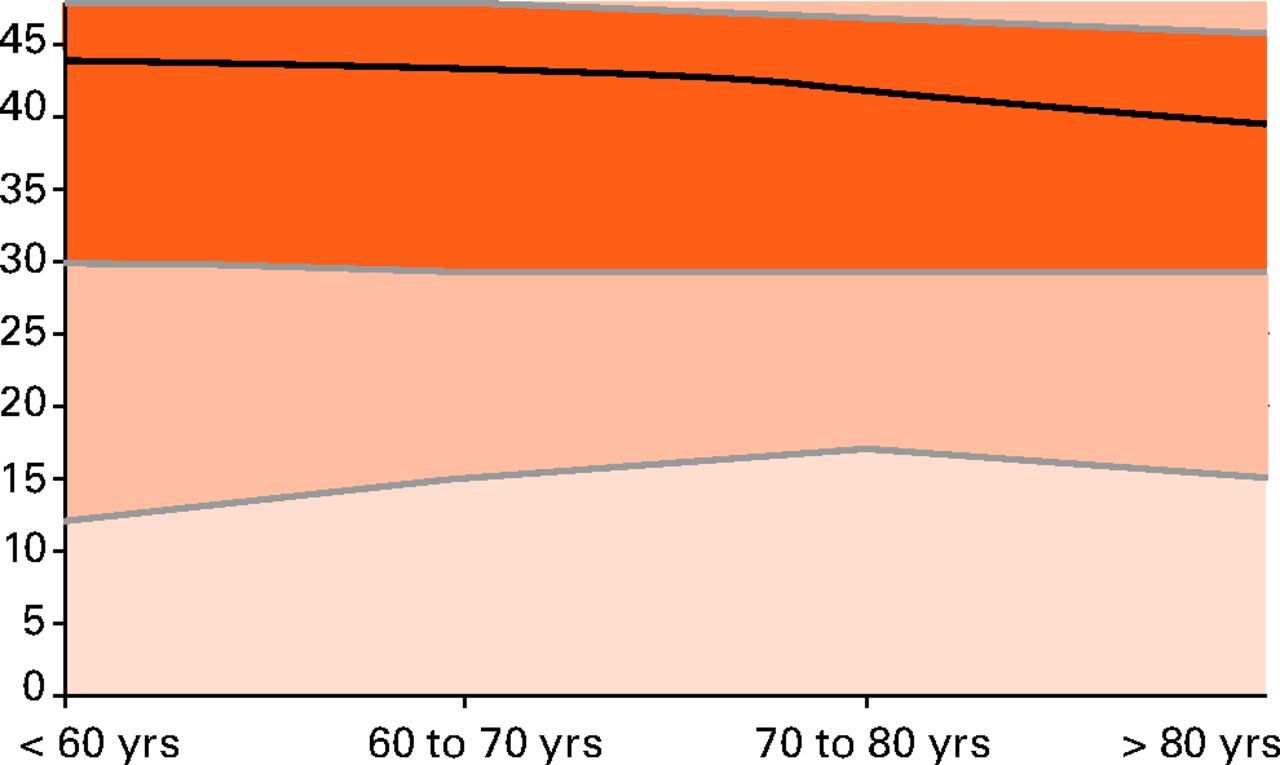
Figs. 2a - 2d
Graphs showing T-score ‘normal’ ranges pre and post THA for men and women. The figure above demonstrates the type of reference chart that can be derivedfrom the population data. Oxford Hip Score (OHS) population ranges by age decile are presented for female patients pre-operatively (a) and at 12 months following THA (b); and separately for male patients pre-operatively (c) and at 12 months post-operatively (d). The actual OHS is on the y axis to allow comparisonof individual patient scores with the population ranges. Separate reference charts are required to evaluate individual patient against the correct operation (hipor knee), gender and time point. The central line is the subgroup specific mean value. The darkest orange corridor represents 1 standard deviation (sd), with the lighter corridor either side of that 2 sds, the palest corridor represents values above 2 sds from the mean.
For ease of interpretation, linked longitudinal data can be redrawn as a line chart (Fig. 3). This presentation, somewhat akin to child population growth charts, allows ready understanding of how the individual patient is progressing over time against the wider (relevant) population. Specific charts need be created for each population subgroup, as outlined in Table III. The green line highlights an individual patient’s progress, clearly showing that individual to be amongst the most severely disabled patients prior to surgery, but achieved close to the average outcome of their age and gender matched peer group by six months post-operatively, and reported a better than average outcome at 12 months.
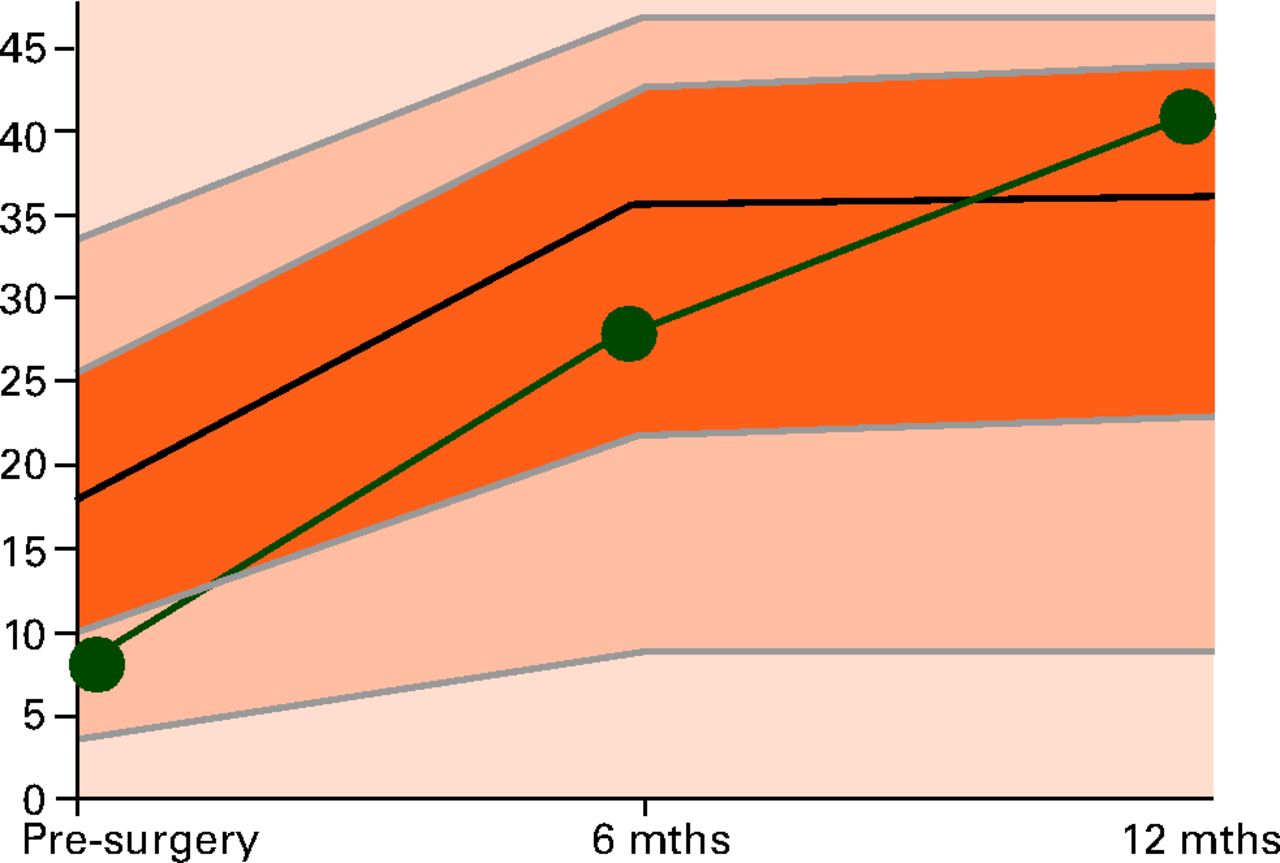
Fig. 3
Example line chart for an individual patient. Using computer interfaces, an appropriate age and gender matched plot can be produced for the individual hip or knee arthroplasty patient. The above figure represents the specific reference ranges for 70- to 80-year-old females undergoing total hip arthroplasty. The green line charts the progress of a 72-year-old woman, highlighting that they were amongst the most severely disabled of patients prior to surgery, however had achieved within a standard deviation of the average outcome of their age- and gender-matched peer group by six months post-operatively, and actually reported better than average outcome at 12 months.
Discussion
Although we often ask our patients to complete PROM questionnaires at an outpatient clinic visit, rarely do the individual’s scores form part of the patient–surgeon consultation. Currently, PROMs are essentially a research tool using anonymised population data. This stems primarily from difficulties in applying the individual patient data in a meaningful or relevant way.
Modern technology and electronic PROMs allow for immediate results scoring, stratification and display. Before electronic PROMS can be meaningfully used in the outpatient setting, however, normative based scoring methodologies are required to contextualise an individual’s results against an appropriate wider population. In terms of lower limb arthroplasty in the United Kingdom, this must essentially incorporate the Oxford Scores. Shifting to a normative based data interpretation requires a fundamental shift in the thinking as to the use of the Oxford Scores. Instead of reporting actual score points, the patient is rated by their relative position within all patients undergoing the same procedure.
To make the most appropriate direct comparisons, the individual’s results can be further stratified by variables known to influence score, such as age and gender13 (as we present here), or through the use of much larger datasets, stratified by any other additional variable thought to influence outcome. Using modern technology, this subgroup stratification can be readily accommodated in computer algorithms and the instant data display tailored to the individual patient, such as that presented in Figure 3. In principle, the large data repositories (such as HSCIC or perhaps the NJR itself) would be able to create more detailed normative models than we present here, and make them available electronically. In the orthopaedic outpatient clinic, descriptive data could be entered into an online portal (or via a smart phone/tablet computer application), and patient-specific models downloaded that demonstrate the patient’s position relative to their peers at that particular time. Following surgery, linked pre-and post-operative longitudinal data could take the form of a line chart (Fig. 3), or through the use of much larger datasets, stratified by any other additional variable thought to influence outcome. Using modern technology, this subgroup stratification can be readily accommodated in computer algorithms and the instant data display tailored to the individual patient, such as that presented in Figure 3. In principle, the large data repositories (such as HSCIC or perhaps the NJR itself) would be able to create more detailed normative models than we present here, and make them available electronically. In the orthopaedic outpatient clinic, descriptive data could be entered into an online portal (or via a smart phone/tablet computer application), and patient-specific models downloaded that demonstrate the patient’s position relative to their peers at that particular time. Following surgery, linked pre-and post-operative longitudinal data could take the form of a line chart (Fig. 3) would be able to create more detailed normative models than we present here, and make them available electronically. In the orthopaedic outpatient clinic, descriptive data could be entered into an online portal (or via a smart phone/tablet computer application), and patient-specific models downloaded that demonstrate the patient’s position relative to their peers at that particular time. Following surgery, linked pre-and post-operative longitudinal data could take the form of a line chart (Fig. 3), and patient-specific models downloaded that demonstrate the patient’s position relative to their peers at that particular time. Following surgery, linked pre-and post-operative longitudinal data could take the form of a line chart (Fig. 3). We believe this is, potentially, a very useful tool in the post-operative patient consultation in order to contextualise how the individual is recovering. Clearly, presentation and interpretation of results needs to be guided by the physician to ensure adequate understanding and to augment the consultation.
There is already considerable debate in the literature as to the most appropriate way to present data to patients and other clinicians. Post-operative Oxford Scores are limited by ceiling effects where around 30% of patients achieve the maximum possible OHS of 48 points one year following hip arthroplasty.14 This does not, however, mean that the patient has achieved the perfect outcome, merely that they do not perceive that they are limited by the specific factors or questions investigated in the OHS. This has the effect of underestimating the true improvement in symptoms through the limited measurement range of the score. To try to mitigate these effects, other investigators have suggested the use of ‘change scores’ (the post-operative score minus the pre-operative score) as being more meaningful than ‘final’ post-operative Oxford Score.8 Though these scoring methods may be helpful for representing population summary statistics, neither method is particularly useful in contextualising the relative improvement of the individual patient. Ceiling effects are not eradicated when using T-scores, in fact they become more visible. Highly performing patients are simply shown as scoring amongst the best of the arthroplasty population who have reached the ceiling of the score.
It is also important to emphasise that, using T-score methodology, every follow-up time point has its own reference normative range. Thus, there is no need to consider change scores - it is all in one graph (Fig. 3). If a patient does not undergo the same change of the reference norms they may ‘drop’ down to a lower T-score. Another important consequence of this approach is that different thresholds are used for different groups (e.g. men and women). This means that even though a man and woman may have the same absolute score, one of them could be considered as performing sub-optimally, whereas the other could be considered to be recovering as expected.
As noted previously, this requires a shift in mentality as to the use of the Oxford Scores. However, this concept is not new, as research studies currently need stratification for confounding variables when modelling with the Oxford Scores, and baseline adjustment is typical to account for differing patient presentations.
Satisfaction with outcome following joint arthroplasty is heavily influenced by interpersonal relationships with the healthcare team, where setting realistic expectations and the wider process of care are as important as achieving adequate pain relief in determining the patients’ post-operative satisfaction.15 As such, being able to interpret how well an individual is recovering relative to the wider group can form a meaningful part of the consultation process, further integrating the patient to expected outcomes, and has further potential to positively influence the patients overall experience with the surgical pathway, which is to the benefit of individuals and institutions through better ‘friends and family test’ scores.16
Comparison with directly relevant peer group data is clearly useful in the early post-operative period. However, as hip and knee arthroplasty procedures demonstrate similar improvements in general health status to renal transplant and coronary revascularisation,17 it may be that comparison to the general ‘healthy’ population may be more meaningful for longer-term follow-up; such as with our earlier parallel to DEXA, where healthy 30-year-old data is the comparison.
Although beyond the scope of the current study, it may be possible to identify thresholds of ‘pathological outcomes’ using T-score methodology. It has been previously demonstrated that six-month OKS is associated with risk of revision at five years using data from the New Zealand joint registry,18 suggesting thay be able to highlight potential problems in terms of risk of revision, as well as to allow the clinical team to monitor these patients more closely.
The strengths of this approach are the direct translation of routinely collected population data to the individual patient consultation. The complex methodology detailed above is hidden to the patient/clinician. This works in the background of the web-interface of a computer or tablet, providing the user with a single intuitive graph encompassing all the information required to monitor the patient’s outcome scores in the context of their peer group. In addition to enhanced feedback, patients also directly benefit from filling in the questionnaires, which enhances value and compliance through reducing any perceived burden of filling in forms. Despite using a large regional dataset, the primary limitation of this pilot work is the limited dataset with which we derived our models. Very large volumes of data are required to create subgroups with sufficient patient numbers to create more definitive models. We hope the work presented here encourages such a project. This pilot work demonstrates how the advent of computerised data capture and different statistical modelling can enhance the national data collection programme, creating a meaningful addition to the patient care process.
1 Howie CR , HamiltonDF. PROMS – How was it for you?J Trauma Orthop2013;1:49–51. Google Scholar
2 Timmins N . NHS goes to the PROMS. BMJ2008;336:1464–1465.CrossrefPubMed Google Scholar
3 Dawson J , FitzpatrickR, CarrA, MurrayD. Questionnaire on the perceptions of patients about total hip replacement. J Bone Joint Surg [Br]1996;78-B:185–190.PubMed Google Scholar
4 Dawson J , FitzpatrickR, MurrayD, CarrA. Questionnaire on the perceptions of patients about total knee replacement. J Bone Joint Surg [Br]1998;80-B:63–69.CrossrefPubMed Google Scholar
5 No authors listed. Department of Health: High quality health care for all. NHS next stage review, 2008. https://www.gov.uk/government/uploads/system/uploads/attachment_data/file/228836/7432.pdf (date last accessed 04 August 2015). Google Scholar
6 No authors listed. National Joint Registry for England and Wales: 10th Annual report, 2013. http://www.njrcentre.org.uk (date last accessed 04 August 2015). Google Scholar
7 McNair DM , LorrM, DropplemanLF Manual for the Profile of Mood States. San Diego, CA: Educational and Industrial Testing Services. 1971. Google Scholar
8 Rose M , BjornerJB, GandekB, et al.The PROMIS Physical Function item bank was calibrated to a standardized metric and shown to improve measurement efficiency. J Clin Epidemiol2014;67:516–526.CrossrefPubMed Google Scholar
9 Cella D , YountS, RothrockN, et al.The Patient-Reported Outcomes Measurement Information System (PROMIS): progress of an NIH Roadmap cooperative group during its first two years. Med Care2007;45(Suppl1):S3–S11.CrossrefPubMed Google Scholar
10 Reeve BB , HaysRD, BjornerJB, et al.Psychometric evaluation and calibration of health-related quality of life item banks: plans for the Patient-Reported Outcomes Measurement Information System (PROMIS). Med Care2007;45(Suppl1):S22–S31.CrossrefPubMed Google Scholar
11 No authors listed. General Register Office for Scotland. http://www.nrscotland.gov.uk/ (date last accessed 17 August 2015). Google Scholar
12 Murray DW , FitzpatrickR, RogersK, et al.The use of the Oxford hip and knee scores. J Bone Joint Surg [Br]2007;89-B:1010–1014. Google Scholar
13 Williams DP , PriceAJ, BeardDJ, et al.The effects of age on patient-reported outcome measures in total knee replacements. Bone Joint J2013;95-B:38–44.CrossrefPubMed Google Scholar
14 Giesinger K , HamiltonDF, JostB, HolznerB, GiesingerJM. Comparative responsiveness of outcome measures for total knee arthroplasty. Osteoarthritis Cartilage2014;22:184–189.CrossrefPubMed Google Scholar
15 Hamilton DF , LaneJV, GastonP, et al.What determines patient satisfaction with surgery? A prospective cohort study of 4709 patients following total joint replacement. BMJ Open2013;3.pii:002525.CrossrefPubMed Google Scholar
16 Hamilton DF , LaneJV, GastonP, et al.Assessing treatment outcomes using a single question: the net promoter score. Bone Joint J2014;96-B:622–628.CrossrefPubMed Google Scholar
17 Hamilton D , HendersonGR, GastonP, et al.Comparative outcomes of total hip and knee arthroplasty: a prospective cohort study. Postgrad Med J2012;88:627–631.CrossrefPubMed Google Scholar
18 Hooper GJ , RothwellAG, HooperNM, FramptonC. The relationship between the American Society Of Anesthesiologists physical rating and outcome following total hip and knee arthroplasty: an analysis of theNew Zealand Joint Registry. J Bone Joint Surg [Am]2012;94-A:1065–1070.CrossrefPubMed Google Scholar
Funding statement:
J. M. Giesinger has been funded by a grant from the Austrian Science Fund (FWF #J3353). A grant has been received by the University of Edinburgh (C. R. Howie and A. H. R. W. Simpson) from Stryker in order to facilitate the data repository from which this article is drawn. D. F. Hamilton, C. R. Howie, J. T. Patton and A. H. R. W. Simpson report funding received from Stryker which is not related to this article.
Author contributions:
D. F. Hamilton: Study concept, data analysis and interpretation, writing of the manuscript, approval of the final manuscript
J. M. Giesinger: Study concept, data analysis and interpretation, writing of the manuscript, approval of the final manuscript
J. T. Patton: Interpretation of data, writing of the manuscript and approval of the final manuscript
D. J. MacDonald: Data collection and analysis, Interpretation of data, writing of the manuscript and approval of the final manuscript
A. H. R. W. Simpson: Interpretation of data, writing of the manuscript and approval of the final manuscript
C. R. Howie: Interpretation of data, writing of the manuscript and approval of the final manuscript
K. Giesinger: Study concept, data analysis and interpretation, writing of the manuscript, approval of the final manuscript
ICMJE Conflict of Interest:
None declared
©2015 Hamilton. This is an open-access article distributed under the terms of the Creative Commons Attributions licence, which permits unrestricted use, distribution, and reproduction in any medium, but not for commercial gain, provided the original author and source are credited.
