


Abstract
Objectives
Lengthening osteotomies of the calcaneus in children are in general grafted with bone from the iliac crest. Artificial bone grafts have been introduced, however, their structural and clinical durability has not been documented. Radiostereometric analysis (RSA) is a very accurate and precise method for measurements of rigid body movements including the evaluation of joint implant and fracture stability, however, RSA has not previously been used in clinical studies of calcaneal osteotomies. We assessed the precision of RSA as a measurement tool in a lateral calcaneal lengthening osteotomy (LCLO).
Methods
LCLO was performed in six fixed adult cadaver feet. Tantalum markers were inserted on each side of the osteotomy and in the cuboideum. Lengthening was done with a plexiglas wedge. A total of 24 radiological double examinations were obtained. Two feet were excluded due to loose and poorly dispersed markers. Precision was assessed as systematic bias and 95% repeatability limits.
Results
Systematic bias was generally below 0.10 mm for translations. Precision of migration measurements was below 0.2 mm for translations in the osteotomy.
Conclusion
RSA is a precise tool for the evaluation of stability in LCLO.
Cite this article: Bone Joint Res 2015;4:78–83.
Article focus
Assessment of the precision of marker-based radiostereometric analysis (RSA) in lateral calcaneal lengthening osteotomies, with focus on the osteotomy site and the neighbouring calcaneal–cuboid (CC) joint.
Double examinations were taken with different lengthenings of the osteotomy to mimic clinical situations.
The feasibility of tantalum bead insertion in the tarsal bones was investigated.
Key messages
The precision for migration measurements was good for translations within the ostetomy site and the CC joint.
RSA is feasible within tarsal bones such as the calcaneus and the cuboid.
This is the first study investigating the precision and feasibility of RSA in calcaneal osteotomies.
Strengths and limitations
The study was conducted on fixed adult cadaver feet
Three markers were visible in the cuboid and the anterior fragment of the calcaneus. Insertion of at least four markers would have been better
Only the repeatability and feasibility were assessed, not accuracy. The settings were consistant and controlled.
Introduction
Radiostereometric analysis (RSA) is a highly accurate and precise method for quantifiying the three-dimensional movement between rigid bodies, such as the stability of fracture parts and the migration of a prosthetic implant in the host bone.1 It has gained great importance in the assessment of joint replacements and new operative techniques. RSA requires insertion of tantalum beads in the bony structures of interest in order to define distinct reference landmarks. The object (i.e. fracture or implant) and two layers of metallic markers in a calibration cage below the patient, are recorded in two simultaneous radiographs (stereoradiographs). During computer analysis of the stereoradiographs, the position of the object with respect to its reference landmarks is described as translations along, and rotations about, all three orthogonal axes in the Cartesian coordinate system. The lateral calcaneal lengthening osteotomy (LCLO) is a common operative approach for the correction of pes planovalgus in paediatric orthopaedic surgery. The lengthening is performed by insertion of a trapezoidal bone graft. For many years, autologous bone harvested from the iliac crest has been the preferred technique, and remains so in Denmark. Donor site morbidity, such as chronic pain, superficial infection, haematoma and lesions to the lateral femoral cutaneus nerve, has led to an increase in new structural substitutes to a bone graft.2 Although there are numerous different substitutes available, the clinical evidence of the mechanical stability of these new materials is sparse. The safety and long-term outcome in orthopaedic surgery is yet to be assessed. A common radiological finding related to the LCLO is a ‘subluxation’ of the calcaneal–cuboid (CC) joint. The actual consequences of this finding are yet to be documented. Therefore, before further clinical studies with marker-based RSA on the tarsal bones are undertaken, we would need also to know the precision and feasibility of RSA on the CC joint.
When introducing new implants in hip and knee arthroplasty, the trend points towards using RSA as a quality tool in the phased clinical introduction of new prostheses to assess safety and provide better patient care.3 To our knowledge, RSA has not yet been used in measurements of stability in foot surgery.
In preparation for a clinical trial to investigate the structural durability of an artificial bone graft versus an autologous bone graft in LCLO on paediatric patients and the CC joint, we conducted a RSA study on LCLO on cadaver feet.
The primary aim of this study was to investigate the precision and feasibility of the marker-based RSA system in a LCLO with different lengthenings, focusing firstly on the osteotomy site and secondly on the CC joint.
Materials and Methods
The main focus of this study was to assess the precision of RSA in calcaneal lengthening osteotomies. During the study preparation, the Standards for Reporting of Diagnostic Accuracy (STARD)4 initiatives were followed.
Cadavers
A total of three fixed cadaveric bodies were used, giving a total of six feet. They were all men of Caucasian origin. The mean age was 77 years (73 to 88), and all feet measured European size 40. There was no history of foot surgery. Causes of death were prostate cancer in two and unknown in the third. The cadavers were fixed according to a standardised procedure. The fixing fluid composition was made up of 10.5 L per cadaver of 5 L alcohol 96%, 2.5 L glycerine, 2 L destillated water and 1 L formaline. The cadavers were stored at 6ºC, and the study was performed within one day.
Operative procedure and bead marking
The osteotomies were performed in an air conditioned room with temperature set to 22°C. The cadavers were allowed to temperate a minimum of 60 minutes prior to the operative intervention.
The LCLO was performed, following the exact procedure each time, by one experienced surgeon (OR) and one assisting surgeon (PM). A plexiglas trapezoidal wedge was specially manufactured for the study, and was marked corresponding to a lateral border lengthening of 1 cm, 1.25 cm and 1.5 cm (Fig. 1) and one assisting surgeon (PM). A plexiglas trapezoidal wedge was specially manufactured for the study, and was marked corresponding to a lateral border lengthening of 1 cm, 1.25 cm and 1.5 cm (Fig. 1). A plexiglas trapezoidal wedge was specially manufactured for the study, and was marked corresponding to a lateral border lengthening of 1 cm, 1.25 cm and 1.5 cm (Fig. 1).

Fig. 1
Drawing showing the principles in a lateral calcaneal lengthening osteotomy with inserted tantalum markers (left) and the set-up of the radiostereometric analysis (right).
A lateral longitudinal incision was made over the calcaneus. Due to the stiffness of the tissue, blunt dissection was not performed, and instead a sharp incision was used straight to the bone. The capsule in the CC joint was respected. The periosteum was incised in line with the planned osteotomy, starting laterally approximately 1 cm to 1.5 cm proximal to the CC joint. The osteotomy was performed with an oscillating saw. Two osteotomes were used to distract and mobilise the osteotomy.
Following the osteotomy, in preparation for the RSA, spherical tantalum beads were inserted in the anterior and posterior calcaneal fragment and in the cuboid bone with a bead injector (Wennbergs Finmek, Sweden). The posterior calcaneal fragment was marked with four to six tantalum beads at 1.0 mm each, the anterior calcaneal fragment was marked with three to four beads at 0.8 mm each, and the cuboid bone was marked with three to four beads at 1.0 mm each. Markers in the anterior and posterior calcaneal fragments were inserted through the osteotomy. Markers in the cuboid bone were inserted via a distal expansion of the initial skin incision through a small hole drilled in the lateral cortex with a 1.8 mm Kirschner wire. The position of the marker was controlled by intra-operative fluoroscopic x-rays. Finally, the cadavers were cautiously transported to the RSA examination room, where the final and gradual lengthening of the osteotomies by use of the plexiglas wedge and subsequent RSA imaging was performed.
RSA set-up
A standard set-up of two synchronised ceiling fixed x-ray tubes (Arco-Ceil/Medira; Santax Medico, Aarhus, Denmark) angled towards each other at 40º and a focused-grid uniplanar carbon calibration box (Box 24, Medis Specials, Leiden, The Netherlands) was used. The exposure was set to 70 kV, 10 mAs, fine focus. All radiographs were fully digital (FCR Profect CS, Fujifilm, Tvedbæk, Denmark) and they were stored without compression. The calibration box defined the position and orientation of the global coordinate system. The cadaver foot was parallel to the calibration cage, with the lateral side of the foot facing the calibration cage, the medial side facing upwards and the ankle in a neutral position. The focus was centred on the CC joint. All stereoradiographs were taken by a team of two radiographers.
Double-examination stereoradiographs were obtained with the calcaneal osteotomy in zero distraction, approximately 1 cm (wedge a), 1.25 cm (wedge b) and 1.5 cm distraction (wedge c). The foot was repositioned between each double examination. A total of 24 double examination stereoradiographs were obtained, four double examinations of each foot. Marker-based analysis of all stereoradiographs was performed by one observer (PM) with Model-based RSA 3.32 software (RSAcore, Leiden, The Netherlands). The inclusion quality of the radiographs were condition numbers (spatial dispersion of markers within the bone fragment) for the marker models in the calcaneal fragments below 300 for each marker model, and a rigid body error threshold (marker fixation threshold) of maximum 0.5 mm. The condition number was obtained from experience with clinical marker dispersion in a similar sized bone in the human wrist.5
The higher the condition number, the poorer the marker dispersion, although condition numbers up to 758 have been reported for small anatomical locations, such as a model of a distal radius fracture.6One foot was excluded from the study, as the RSA data clearly indicated loose tantalum markers (high rigid body errors). A second foot was excluded from the precision analysis of the CC joint, due to a high condition number in the cuboid bone (up to 484).
When assessing the precision of the osteotomy measurements, the centre of gravity of the marker model of the posterior calcaneal fragment made up the fixed rigid body reference and the marker model of the anterior calcaneal fragment made up the migrating object. For the CC joint, the centre of gravity in the anterior calcaneal fragment made up the fixed rigid body reference, and the marker model of the cuboid bone made up the migrating object. The marker models in the coordinate systems were oriented with the osteotomy performed in the y-axis, the lengthening in the x-axis, and any medial lateral movement of the migration object with reference to the rigid object would occur in the z-axis. A distraction of the osteotomy would be indicated by a negative sign in the x-translations and, conversely, a positive sign in the x-translations would indicate compression of the osteotomy (the anterior calcaneal fragment moving towards the posterior fragment) (Fig. 2) (Fig. 2).
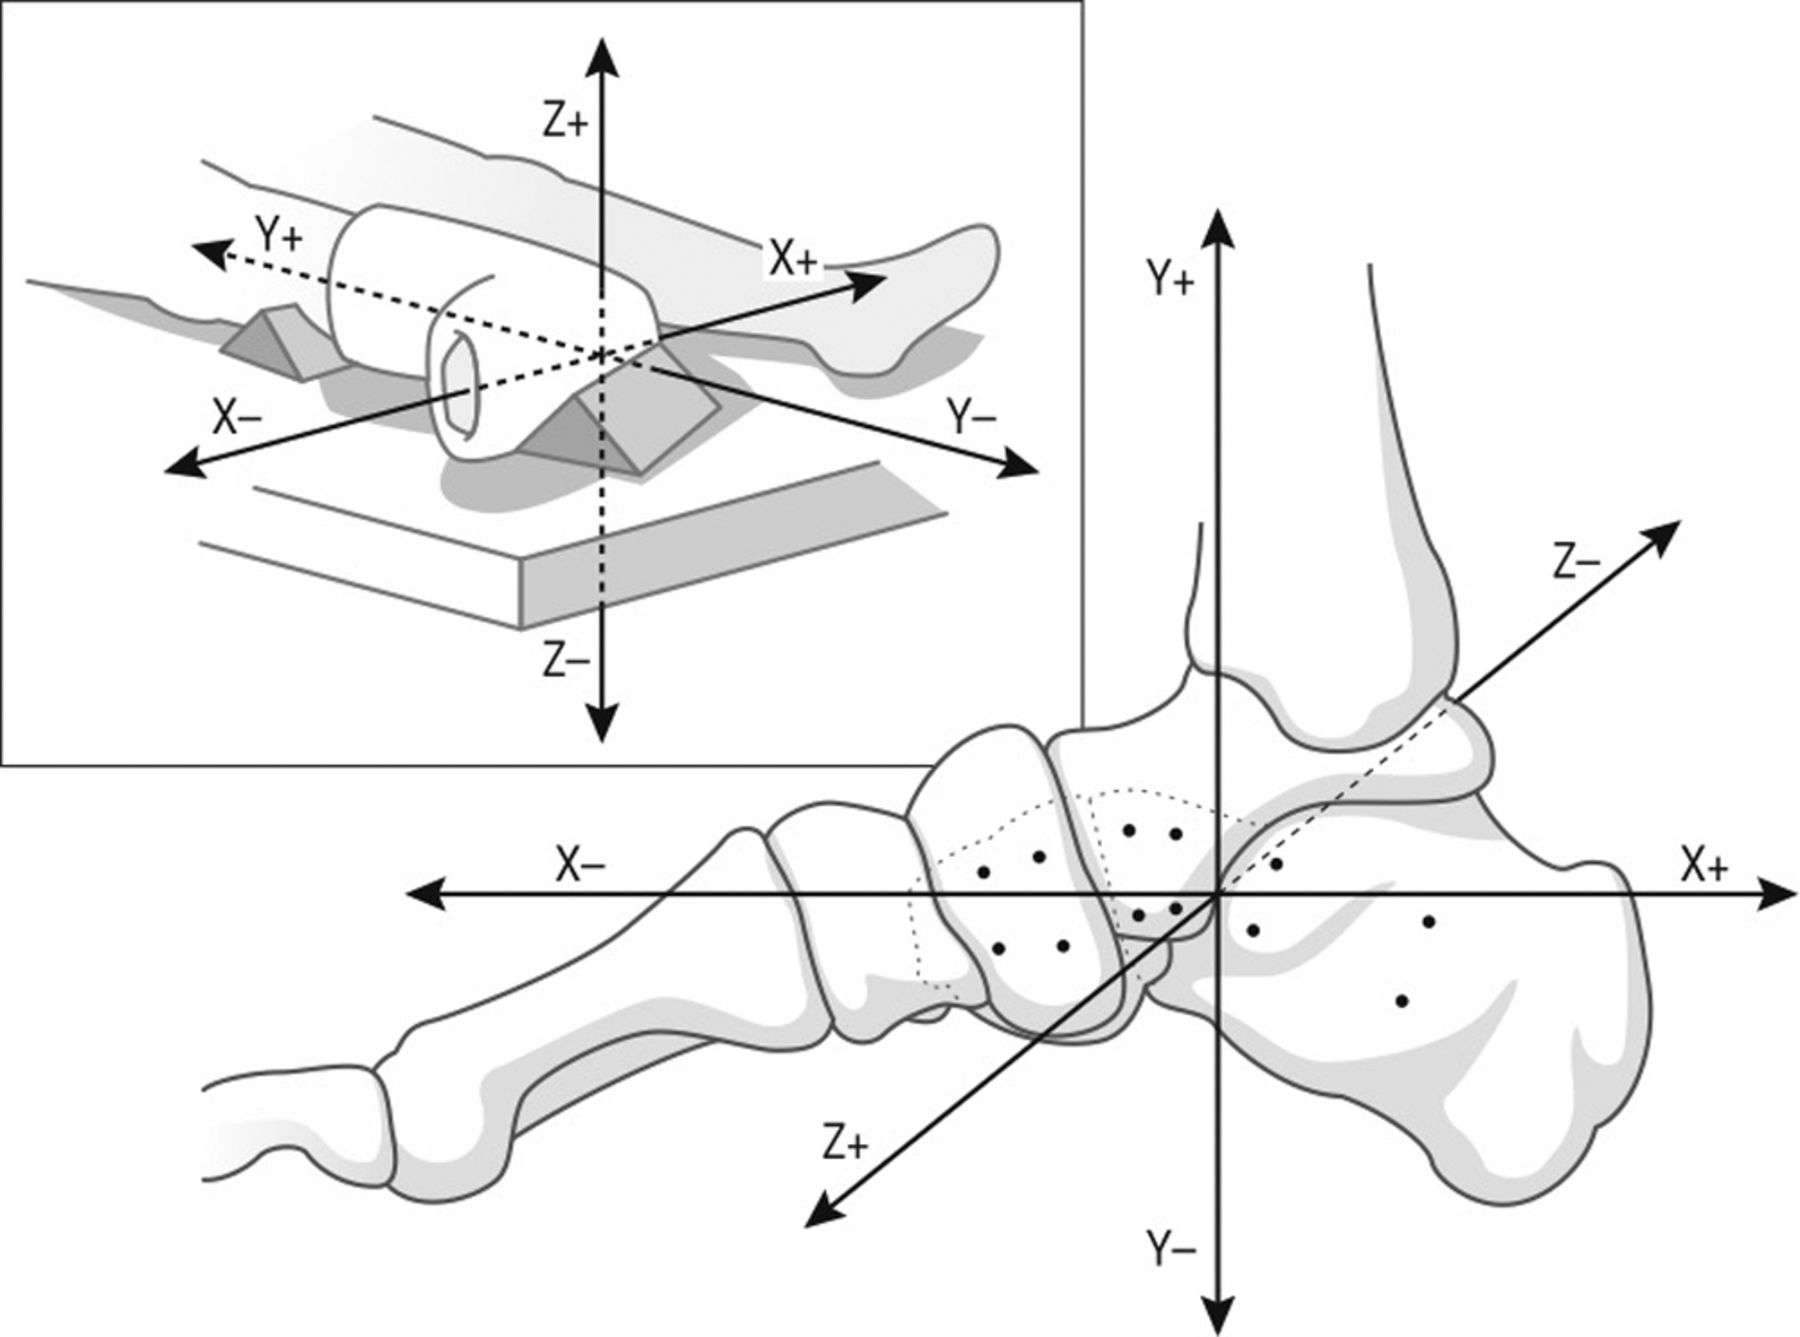
Fig. 2
Drawing illustrating the orientation of the coordinate system relative to the anatomy of the foot. The foot is viewed from the medial side, with the dotted lines representing the contour of the distal part of both the calcaneal bone and the cuboid bone. The drawing in the upper left corner illustrates the positioning of the foot for future clinical studies.
Statistics and precision of RSA
The primary aim of this study was to discover the repeatability of zero migration measurements in the LCLO at different distraction points, as well as the further repeatability of zero migration measurements in the CC joint.
Repeatability/precision of the RSA set-up was assessed by 20 double examinations (16 in the CC joint) in neutral and with all three distractions of the osteotomy. The bias, which is the systematic variation of the double measurements, was calculated as the mean difference (meandiff) between the first and second set of double measurements. The random variation was expressed as standard deviation of the differences (sddiff-inter) between the first and second measurements (double examinations) along with 95% limits of agreement (LOA) according to Bland and Altman.7 The systematic variation should optimally be zero, and it reflects the precision in the cadaver RSA set-up, where LOA (meandiff ×sddiff-inter ±1.96) represents the expected clinical RSA precision for LCLO migration measurements.
Differences within and between double examinations (measurement one and measurement two) were tested for normality by QQ-plots. The mean differences within double examinations were tested for equal variance with an F-test, and if this assumption was fulfilled, a paired t-test was performed. The mean difference for each distraction grade (a,b,c) between groups was tested with an F-test for equal variance. If no significant differences were revealed, the mean differences were pooled.
Statistical computations were performed in Excel version 14.3.5 (Microsoft Excel for Mac 2011, Redmond, Washington) and Stata version 12.1 for Mac 2012 (StataCorp, College Station, Texas). The level of statistical significance was set at p < 0.05.
Results
The mean condition number was 53 (sd 32; 33 to114) in the posterior calcaneal fragment, 153 (sd 73; 82 to 268) in the anterior calcaneal fragment and 120 (sd 48; 88 to 199) in the cuboid bone. One foot had high condition numbers in the cuboid bone ranging from 471 to 484 and was, thus, excluded from statistical analysis.
We found significant differences in the means between some double examinations, but as they were very small and approximated zero, this was of no clinical relevance. Therefore, we pooled the data for all cadavers to get a common and more useful precision estimate.
The precision of the RSA measurements in the calcaneal osteotomy and in the CC joint is referred to in Tables I and II. The systematic variation in measurements of translations was below 0.09 mm in the osteotomy and below -0.10 mm in the CC joint. As for rotations, it was below 0.19º in the osteotomy and below 0.33º in the CC.
Table I
Repeatability of n = 20 double measurements in the calcaneal osteotomy for the anterior calcaneal fragment with reference to the posterior calcaneal fragment; combined precision for all three distraction grades
| Translation (mm) | Rotation (º) | |||||
|---|---|---|---|---|---|---|
| x-axis | y-axis | z-axis | x-axis | y-axis | z-axis | |
| Mean* | -3.33 | -3.03 | 3.08 | -5.34 | 6.41 | 3.04 |
| Meandiff† | -0.02 | 0.09 | -0.02 | 0.07 | 0.19 | -0.2 |
| 95% CI‡ | (-0.05 to 0.01) | (0.04 to 0.15) | (-0.07 to 0.03) | (0.01 to 0.13) | (0.05 to 0.33) | (-0.46 to 0.05) |
| sd diff_inter § | 0.06 | 0.10 | 0.09 | 0.10 | 0.25 | 0.46 |
| ± LOA¶ | 0.11 | 0.20 | 0.17 | 0.21 | 0.50 | 0.90 |
| p-value** | 0.16 | 0.002 | 0.44 | 0.02 | 0.01 | 0.11 |
-
*Mean of the lengthening of the osteotomy †Meandiff between the first and second set of double measurements, bias (systematic variation) ‡ 95% confidence intervals (CI) for the mean difference § standard deviation (sd)diff_inter, repeatability sd, random variation ¶ ± limits of agreement (LOA), 95% LOA, expected clinical precision **p-value, paired t-test
Table II
Repeatability of n = 16 double measurements in the calcaneal–cuboid joint with the cuboid bone as the migrating object with reference to the anterior calcaneal fragment; combined precision for all three distraction grades
| Translation (mm) | Rotation (º) | |||||
|---|---|---|---|---|---|---|
| x-axis | y-axis | z-axis | x-axis | y-axis | z-axis | |
| Mean* | 0.36 | 0.98 | -1.54 | 2.50 | -3.49 | -0.54 |
| Meandiff† | 0.01 | -0.10 | 0.03 | -0.06 | 0.09 | 0.33 |
| 95% CI‡ | (-0.05 to 0.06) | (-0.18 to -0.03) | (-0.11 to 0.16) | (-0.24 to 0.13) | (-0.46 to 0.64) | (0.07 to 0.58) |
| sd diff_inter § | 0.095 | 0.12 | 0.24 | 0.31 | 0.93 | 0.43 |
| ±LOA¶ | 0.19 | 0.24 | 0.46 | 0.61 | 1.82 | 0.85 |
| p-value** | 0.77 | 0.01 | 0.72 | 0.53 | 0.75 | 0.02 |
-
*Mean of the lengthening of the osteotomy †Meandiff between the first and second set of double measurements, bias (systematic variation) ‡ 95% confidence intervals (CI) for the mean difference § standard deviation (sd)diff_inter, repeatability sd, random variation ¶ ± limits of agreement (LOA), 95% LOA, expected clinical precision **p-value, paired t-test
Precision was good for the calcaneal osteotomy measurements with LOA below 0.2 mm for translations (x,y,z) and below 0.9º for rotations (Fig. 3) and below 0.9º for rotations (Fig. 3). Precision of measurements in the CC joint was below 0.46 mm for translations and below 1.8ºfor rotations (Fig. 4). As for rotations, the best precision was observed on the x-axis, with 0.21º for the calcaneal osteotomy and 0.61º for the CC joint. The poorest precision was observed on the z-axis for the osteotomy, at 0.9º and on the y-axis, 1.82º in the CC joint. Having mentioned this, the rotations are not of primary clinical interest.
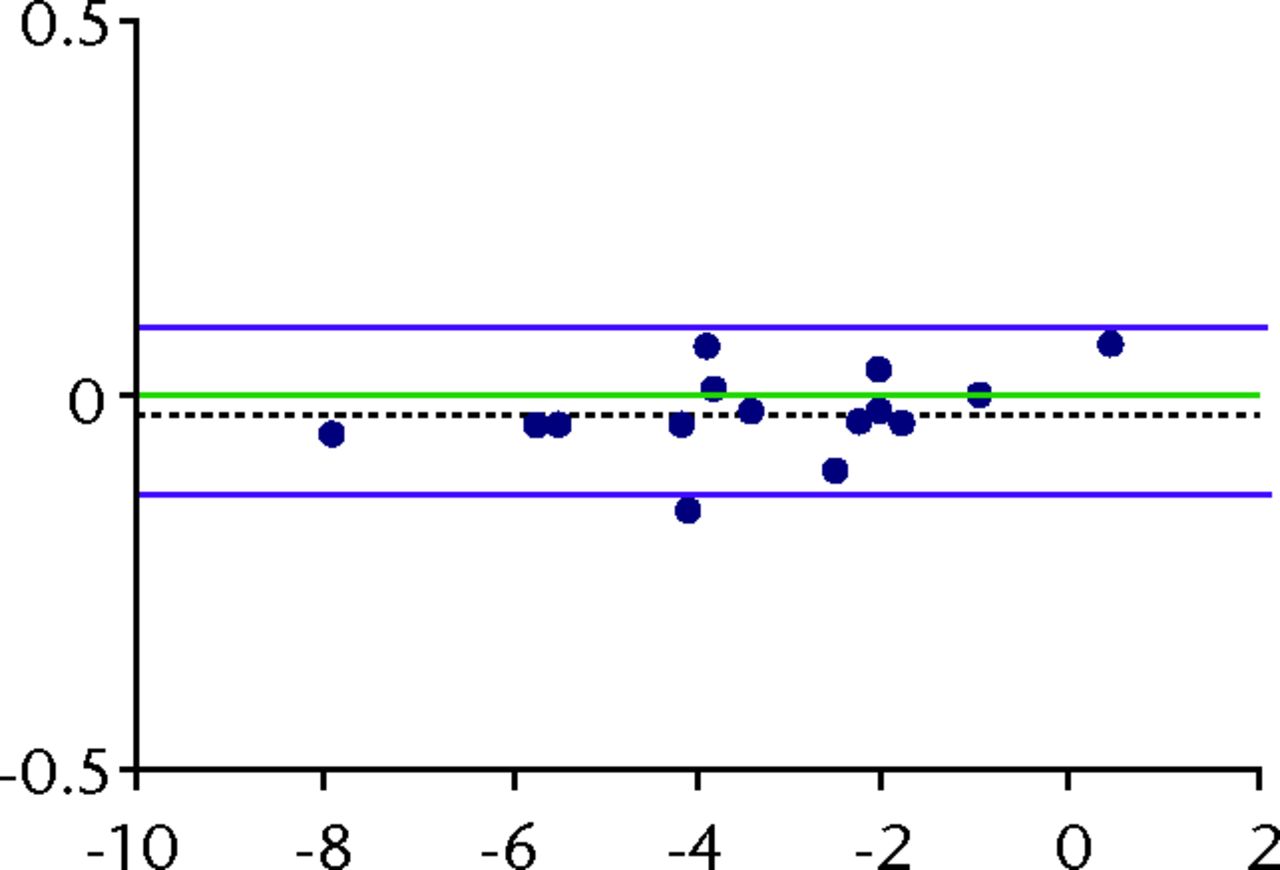


Fig. 3
Bland-Altman plots of repeatability (precision) with 95% limits of agreement (LOA) for translations in the osteotomy for the x (a), y (b) and z (c) translations. The x-axis shows the average of two measurements (a double-examination) and the y-axis shows the difference between them. The green line denotes the optimal bias, which is zero. The dashed black line denotes the systematic bias from zero. The purple lines denote the 95% LOA. The blue dots represents measurements.

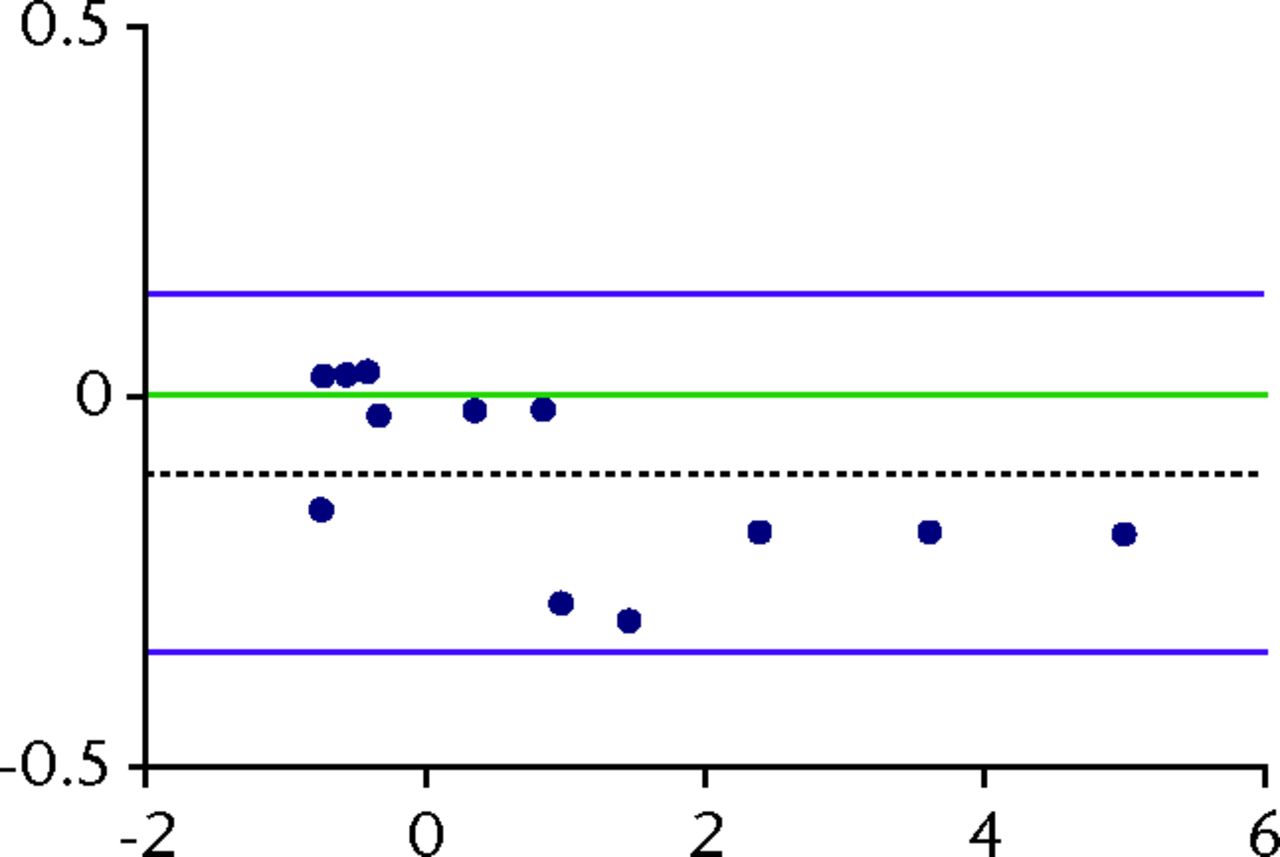

Fig. 4
Bland-Altman plots of repeatability (precision) with 95% limits of agreement (LOA) for translations in the CC joint for the x (a), y (b) and z (c) translations. The x-axis shows the average of two measurements (a double-examination) and the y-axis shows the difference between them. The green line denotes the optimal bias which is zero. The dashed black line denotes the systematic bias from zero. The purple lines denote the 95% LOA. The blue dots represent the measurements.
Discussion
To our knowledge, these are the first published data on the precision and feasibility of RSA for evaluation of calcaneal lengthening osteotomies. Our main findings suggest a good precision for RSA measurements of translations in the calcaneal osteotomy and the CC joint with calcaneal lengthenings – as measured on the lateral side of the osteotomy – from 0 cm to approximately 1.5 cm. Rotation error was high on the z-axis in the CC joint, which would be expected as we are dealing with small bones and marker models and, thus, almost in-line bead insertion in the anterior calcaneal fragment. Error in rotation matrix increased with the increasing condition number,8 which corresponds with findings in former studies examining small anatomical regions.5,9 Therefore, it is crucial that the markers are as widely distributed as possible in a clinical study. In our planned clinical study, we aim to detect any translations in the CC joint in the y-axis after a LCLO, as this is a relatively common observation, and the clinical significance remains uncertain.
As a result of our experience in the present study, we provide the reader with some suggestions for future experimental and clinical studies using RSA on calcaneal osteotomies. When small neighbouring bones, such as those in the carpus or tarsus, are studied, we recommend marking neighbouring bones with different sized markers, as it enables the analyst to distinguish the location of markers in the oblique angled stereoradiographs, which in turn makes analysis easier and safer. During insertion of the beads, the anterior and posterior calcaneal fragments can be accessed easily through the osteotomy, thus avoiding further dissection of soft tissues close to the calcaneus. Insertion of beads in the cuboid and the most posterior calcaneal fragment requires either a larger skin incision than that needed for the calcaneal osteotomy, or a percutaneous bead insertion via fluoroscopic guidance. In the clinical setting, we would prefer a longer incision over additional skin penetrations with instruments that need to penetrate the bone, in order to avoid unnecessary risk of infection and damage to nerves, vessels and tendons.
In general, the surgical procedure and bead injection was challenging, but feasible, on fixed adult cadaver feet. We expect the RSA set-up to be easier to perform in vivo, and even easier on paediatric patients, who, despite their smaller bones, have elastic soft tissues and greater joint mobility, which eases access to the bones.
An important issue, which must be considered prior to further implementation of RSA in assessment of the stability of the calcaneal osteotomy performed in paediatric patients, is the dose of radiation to be used. When one considers procedural variations within the planned clinical trial, the upper limit of the dose of radiation within our RSA system is no higher than 0.01 μSv. In comparison a person on a flight receives 0.005 mSv per hour in the air.10 Based on these data, we conclude that RSA would be safe to use as a quality tool in calcaneal lengthening osteotomies in paediatric patients.
Limitations
The study was designed to test the precision of RSA for measurements of stability in LCLO in preparation for a clinical study on paediatric patients. Ideally, the study should have been performed on paediatric cadaver feet. The feet used for this study were normally configured, except for one pes equinus foot. Adult feet are different in bony structure from paediatric feet, with a bigger anatomy and more rigid joints and soft tissues. The cadaver feet were fixed, which demanded a greater effort to access and distract the osteotomy site due to the stiff tissues and muscles. The distraction was more difficult to perform in cadaver feet than it would be on vital human paediatric feet, as we had to be careful not to fracture the fragile cadaver bone. Therefore, lengthening of the osteotomy according to the markings on the plexiglas wedge was not similar for all cadaver feet. We emphasise that this study was not intended as an accuracy study, due to the obvious differences between adult cadaver feet and paediatric feet. We would expect any measured accuracy to be higher in clinics, and it would be an interesting issue to assess.
Bony structures should be marked with at least three non-collinear markers,5 but four was considered to be much better, yielding more markers for data processing in case of problems such as marker loosening, linear marker distribution or marker occlusion. We used three to four markers in the cuboid bone and the anterior calcaneal fragment, and it was difficult to insert more markers without risking placement of very close markers or touching/loosening markers that were already placed. Therefore, in the clinical setting, we do not think it will be possible to place more than four markers in these small bones and bone fragments safely.
In conclusion, we found RSA to be a feasible method, with good precision for measurements of stability in the osteotomy and of any movement in the CC joint. Measurements of rotation were less precise, which is to be expected in small bones.
Acknowledgement: We thank the Institution of Biomedicine - Anatomy, Aarhus University for their contribution with the cadaver feet and the Department of Pathology at Aarhus University Hospital, Tage-Hansens Gade, for use of facilities for preparation and safe-keeping of the cadavers. Also, we thank the Department of Radiology at Aarhus University Hospital, Tage-Hansens Gade, for their experienced assistance with the radiographic examinations.
1 Valstar ER , GillR, RydL, et al.Guidelines for standardization of radiostereometry (RSA) of implants. Acta Orthop2005;76:563–572.CrossrefPubMed Google Scholar
2 Kurien T , PearsonRG, ScammellBE. Bone graft substitutes currently available in orthopaedic practice: the evidence for their use. Bone Joint J2013;95-B:583–597.CrossrefPubMed Google Scholar
3 Nelissen GHH , PijlsBG, KärrholmJ, et al.RSA and Registries: The quest for phased introduction of new implants. J Bone Joint Surg [Am]2011;93-A(Suppl 3):62–65.CrossrefPubMed Google Scholar
4 Bossuyt PM , ReitsmaJB, BrunsDE, et al.The STARD statement for reporting studies of diagnostic accuracy: explanation and elaboration. The Standards for Reporting of Diagnostic Accuracy Group. Croat Med J2003;44:639–650.PubMed Google Scholar
5 Hansen TB , StillingM. Equally good fixation of cemented and uncemented cups in total trapeziometacarpal joint prostheses: a randomized clinical RSA study with 2-year follow-up. Acta Orthop2013;84:98–105. Google Scholar
6 Madanat R , MäkinenTJ, MoritzN, MattilaKT, AroHT. Accuracy and precision of radiostereometric analysis in the measurement of three-dimensional micromotion in a fracture model of the distal radius. J Orthop Res2005;23:481–488.CrossrefPubMed Google Scholar
7 Bland JM , AltmanDG. Statistical methods for assessing agreement between two methods of clinical measurement. Lancet1986;1:307–310.PubMed Google Scholar
8 Söderkvist I , WedinPA. Determining the movements of the skeleton using well-configured markers. J Biomech1993;26:1473–1477.CrossrefPubMed Google Scholar
9 Ryd L , YuanX, LöfgrenH. Methods for determining the accuracy of radiostereometric analysis (RSA). Acta Orthop Scand2000;71:403–408.CrossrefPubMed Google Scholar
10 No authors listed. American Nuclear Society. http://www.ans.org/pi/resources/dosechart/msv.php (date last accessed 24 March 2015). Google Scholar
Funding statement:
None declared
Author contributions:
P. Martinkevich: Study design, Surgery, Data collection, Data analysis, Writing the draft paper, Revising the paper
O. Rahbek: Study design, Surgery, Revising the paper
B. Møller-Madsen: Study design, Surgery, Revising the paper
K. Søballe: Study design, Revising the paper
M. Stilling: Study design, Data collection, Data analysis, Revising the paper
ICMJE Conflict of Interest:
None declared
©2015 The British Editorial Society of Bone & Joint Surgery. This is an open-access article distributed under the terms of the Creative Commons Attributions licence, which permits unrestricted use, distribution, and reproduction in any medium, but not for commercial gain, provided the original author and source are credited.
Supplementary material. Tables showing significant differences in means between double examinations are available alongside the online version of this article at www.bjr.boneandjoint.org.uk
