


Abstract
Objectives
Our objective in this article is to test the hypothesis that type 2 diabetes mellitus (T2DM) is a factor in the onset and progression of osteoarthritis, and to characterise the quality of the articular cartilage in an appropriate rat model.
Methods
T2DM rats were obtained from the UC Davis group and compared with control Lewis rats. The diabetic rats were sacrificed at ages from six to 12 months, while control rats were sacrificed at six months only. Osteoarthritis severity was determined via histology in four knee quadrants using the OARSI scoring guide. Immunohistochemical staining was also performed as a secondary form of osteoarthritic analysis.
Results
T2DM rats had higher mean osteoarthritis scores than the control rats in each of the four areas that were analysed. However, only the results at the medial and lateral femur and medial tibia were significant. Cysts were also found in T2DM rats at the junction of the articular cartilage and subchondral bone. Immunohistochemical analysis does not show an increase in collagen II between control and T2DM rats. Mass comparisons also showed a significant relationship between mass and osteoarthritis score.
Conclusions
T2DM was found to cause global degeneration in the UCD rat knee joints, suggesting that diabetes itself is a factor in the onset and progression of osteoarthritis. The immunohistochemistry stains showed little to no change in collagen II degeneration between T2DM and control rats. Overall, it seems that the animal model used is pertinent to future studies of T2DM in the development and progression of osteoarthritis.
Cite this article: Bone Joint Res 2014;3:203–11
Article focus
It has long been acknowledged that type 2 diabetes mellitus (T2DM) is a probable factor in the onset and progression of osteoarthritis. However, there is yet to be an appropriate small animal model for T2DM due to the nature of the disease. Without one, it is difficult to understand the mechanisms behind its action and address its effects.
Our study’s aim was to characterise the quality of the articular cartilage at the level of the knee in T2DM rats, thus determining the model’s effectiveness in the study of osteoarthritis.
Key messages
T2DM contributed to osteoarthritis progression in several areas of the rat knee joint.
The animal model used seems well suited for further investigation of the effects and mechanisms of T2DM, at least in the development of osteoarthritis.
Strengths and limitations
Strength: The interpreters were blinded to the conditions when scoring the histology
Limitations: We had a limited number of T2DM rats as they were bred by the UCD group. Their growth and diet were not monitored by our group.
The grading scale used is subjective.
The rats used in this study were not age-matched, and the age among rats within the T2DM group also varied.
Introduction
Type 2 diabetes mellitus (T2DM) is a growing global epidemic, currently affecting over 200 million people.1 T2DM is characterised by reduced pancreatic beta-cell function and systemic insulin resistance, leading to metabolic dysfunction throughout the body. The exact pathophysiological mechanism behind T2DM remains largely unknown, however, the disease is associated with obesity, a high-fat diet, and a lack of physical activity.2-5 In the field of orthopaedic surgery, T2DM has mostly been studied as a surgical comorbidity.6 However, there are aspects of T2DM that are of interest in musculoskeletal research, particularly articular cartilage biology.
Factors such as diet, increased body mass and obesity have been studied in both clinical and basic scientific research, as they relate to osteoarthritis onset and progression.3,7,8,9-15 Additionally, the literature also investigated the role that increased adipose tissue plays in increased inflammatory response in the joint tissues.7,16,17 For instance, there is a positive correlation between elevated blood glucose levels and evidence of OA.10,11,14,18 These conditions seem to provide catabolic signals that lead to increased proteolytic enzyme activity that degrades the matrix components, causing progressive cartilage degradation.18 Proteolytic enzymes belonging to the metalloproteinase family, such as collagenases and aggrecanases, are especially relevant as their expression is increased by pro-inflammatory and catabolic stimuli, and whose activity has been shown to be augmented in OA cartilage.18 Studies have also attributed the development of osteoarthritis to metabolic disorders and to the stiffening of tissues through an accelerated form of non-enzymatic cross-linking of collagen often associated with ageing.19 Briefly, increased circulating glucose reacts with free amino acids on proteins through the Maillard reaction, a form of non-enzymatic browning resulting from a chemical reaction of an amino acid and a reducing sugar, to create stable intermediates. These glycated protein intermediates then link together to form larger, insoluble aggregates known as advanced glycation end products (AGEs).20 This phenomenon occurs in collagen-rich tissues, such as cardiovasculature and bone throughout the body, and leads to mechanical and biochemical changes in those tissues.20-23 AGEs naturally accumulate through the process of ageing and have been studied as a possible mechanism for spontaneous, or primary, osteoarthritis in aged populations.22
One of the major hurdles for in vivo T2DM study has been the lack of an appropriate small animal model. Although there are several different transgenic, surgical, and spontaneous rodent strains that have been used to model T2DM, the diabetic physiology of these animals deviates significantly from that seen in humans.19,24 One example of this difference is the fact that symptoms of T2DM in rats, such as obesity and insulin resistance, result largely from monogenic mutations rarely found in human populations.7
In 2008, Cummings et al24 characterised the Graham-Havel T2DM strain of rats created by their group at the University of California, Davis (UCD). Crossing obese, insulin-resistant Sprague-Dawley rats with Zucker diabetic fatty-lean rats, which do not develop obesity or insulin resistance, was the first step in creating these rats. The progeny of these animals are then selectively bred to the F7 generation, at which point they exhibit the T2DM phenotype.24 This resulted in the UCD-T2DM rats with a polygenic phenotype similar to that seen in humans.24 Furthermore, this strain does not exhibit infertility that is characteristic of other experimental diabetic rodent lines, making them hard to maintain.19,24 In these animals, the onset of T2DM was confirmed using fasting glucose levels, glucose tolerance, immunohistochemistry of the pancreas, and islet insulin content in both sexes.24
An appropriate small animal T2DM model will allow not only a better understanding of the onset of T2DM, but also of the mechanisms by which T2DM contributes to a host of diseases and disorders. The purpose of our study is to characterise the quality of the articular cartilage at the knee in the UCD-T2DM rats. We hypothesise that this strain of rats will have more severe osteoarthritis in comparison with control rats.
Materials and Methods
Specimen acquisition
A total of six frozen UCD-T2DM rats were acquired through Dr J. Lotz’s laboratory at the University of California, San Francisco, who had procured them from the Graham-Havel Laboratory at the Unviersity of California, Davis. The age of these rats varied between six months to one year, the genders were not tracked, and all rats were fed the same diet. To compare, frozen healthy knees were taken from four six-month-old female Sprague-Dawley rats (Charles River Laboratories, Wilmington, Massachusetts).
Specimen preparation
In this study, 12 knee joints from UCD-T2DM rats were compared with eight control joints. Knee joints were dissected mid-femur proximally and mid-tibia distally. Excess soft tissue was removed and the knees fixed in 10% formalin (3.7-4% Formaldehyde in de-ionised water with sodium phosphate, monobasic and dibasic) at 4°C overnight. The knees were then decalcified in a 0.45 M ethylenediamine tetra-acetic acid solution (EDTA) for three and a half weeks, changing solution daily. This solution consisted of EDTA (Fisher Scientific, Fair Land, New Jersey) diluted in water with Tris-Base (Fisher Scientific), titrated with sodium hydroxide (Fisher Scientific). Following decalcification, samples were dehydrated and embedded in paraffin (Richard-Allan Scientific, Kalamazoo, Missouri).
Sectioning and histology
Samples were placed in the holder anterior side down, with the proximal end of the tibia flush with the bottom of the holder. Sections were taken every 7 µm, but only sections from 150 µm to 550 µm were subsequently affixed to glass slides for staining as these contained the articular cartilage. These sections were screened visually for the cartilage with the most intact morphology and best fixation to the slide. They were then stained using a combination of Safranin-O (Sigma, St. Louis, Missouri)/Fast Green (Sigma) dyes in order to visualise the articular surface and surrounding structures.
Osteoarthritis assessment
Each knee was divided into four anatomical regions: lateral tibia; lateral femur; medial tibia and medial femur. Each quadrant was scored by three individual scorers blinded to the identity of the cartilage using a modified version of the scale used by Pritzker et al25 for osteoarthritis cartilage histopathology assessment (Table I).26 The system is based on histological features of OA progression and employs analysis of a block/section assessment by grade and stage of arthritis with calculation of an overall arthritis score. The mean of the grades was then worked out for an overall score. Because the subchondral bone, meniscus and synovium were not part of the criteria of the OARSI scale, they were not included in this assessment.
Table I
Cartilage histopathology grade methodology guide modified from Pritzker et al25
| Grade* (key features) | Associated criteria (tissue reaction) | |
|---|---|---|
| Grade 0: surface intact, cartilage morphology intact | ||
| Matrix: normal structure | ||
| Cells: intact, appropriate orientation, tide mark can be seen | ||
| Grade 1: surface intact | ||
| Matrix: superficial zone intact, oedema and/or superficial fibrillation (abrasion), focal superficial matrix condensation | ||
| Cells: death, hypertrophy, superficial zone reaction has higher level of superficial fibrillation | ||
| Grade 2: surface discontinuity | ||
| As above | ||
| Matrix discontinuity at superficial zone (deep fibrillation) | ||
| 1/3 of upper cartilage staining loss (Safranin-O or Toluidine blue) | ||
| Increased perichondral (mid-zone) staining | ||
| Cells: death, hypertrophy | ||
| Grade 3: vertical fissures | ||
| As above | ||
| Matrix fissures into mid zone, branched fissures | ||
| 2/3 of cartilage staining loss (into deep zone) | ||
| New collagen formation (polarised light microscopy | ||
| Cells: death, regeneration (clusters), hypertrophy, cartilage domains adjacent to fissures | ||
| Grade 4: erosion | ||
| Cartilage matrix loss: delamination of superficial layer | ||
| Mid-layer cyst formation | ||
| Matrix loss in superficial layer and mid-zone regions | ||
| Grade 5: denudation | ||
| Sclerotic bone or reparative tissue found within denuded surface | ||
| Microfracture with repair at bone surface only | ||
| Grade 6: deformation | ||
| Bone remodeling with osteophyte formation | ||
| Microfracture with extensive cartilaginous and osseous repair |
Immunohistochemistry
To assess differences in collagen fibre type in the articular cartilage, sections were stained using immunohistochemistry both for type 1 and type 2 collagen. Following deparaffinisation, sections were incubated in a solution of 10 μg/mL proteinase K (Qiagen, Limberg, the Netherlands) at room temperature for 20 minutes for antigen retrieval. Next, after a series of wash steps, sections were blocked using Hydrogen Peroxide Block (Lab Vision, Fremont, California) for endogenous peroxidase (Lab Vision) and an Ultra V Block (Lab Vision) for non-specific binding. After the blocking steps, sections were incubated with a 1:200 dilution of a primary antibody, specific for collagen 1a2 or 2a2, overnight in a humidified chamber at 4oC. Commercially available mouse anticollagen 1a2 (ab90395) (ABCAM, Cambridge, Massachusetts) and rabbit anticollagen 2a2 (ab53047) (ABCAM) antibodies were used. Following overnight incubation, the primary antibody signal was amplified using an Ultravision Quanto Detection System (Lab Vision). Finally, antigens were visualised using DAB Quanto and counter-stained using Mayer’s haematoxylin. A control stain was performed without primary antibodies in order to confirm that there was no occurrence of non-specific binding.
Statistical analysis
Statistical analysis was conducted using the computer software R.27 Scores derived from control groups were compared with the study groups at each cartilage region using a Wilcoxon Test.28 An ANOVA test27 was used to study the relationship between osteoarthritis severity and weight, as well as osteoarthritis severity and age. A p-value < 0.05 was considered statistically significant.
Results
Safranin-O staining
These scores are based on the grading scale in Table I. Control joints had a mean (standard deviation, sd) osteoarthritis score of 1.59 (sd 0.438) at the lateral tibia, 1.16 (sd 0.475) at the lateral femur, 1.22 (sd 0.466) at the medial tibia, and 0.50 (sd 0.231) at the medial femur. The UCD-T2DM had mean osteoarthritis scores of 2.43 (sd 0.229) at the lateral tibia, 2.81 (sd 0.311) at the lateral femur, 2.84 (sd 0.718) at the medial tibia, and 1.68 (sd 0.213) at the medial femur. Therefore, the UCD-T2DM rat had a significantly higher, thus worse, osteoarthritis score at the lateral femur (p = 0.013), medial tibia (p = 0.003), and medial femur (p = 0.034). Control and UCD-T2DM joints did not differ significantly at the lateral tibia (p = 0.158). Figure 1 shows the difference in osteoarthritis scores between the control and the UCD-T2DM rat knees.

Fig. 1
Graph comparing osteoarthritis scores between the control and the UCD-T2DM rat knees. The scoring scale used is modified from Pritzker et al25 “*” denotes statistically significant differences of p < 0.05. The UCD-T2DM rat had a significantly higher, thus worse, osteoarthritis score at the lateral femur (p = 0.013), medial tibia (p = 0.003), and medial femur (p = 0.034) (Wilcoxon Test).
The lateral and medial femoral condyles show both degeneration of the articular surface and areas of staining loss relative to the surrounding tissue. The articular cartilage was also phenotypically different at the medial condyles between the two groups. Control rats showed normal healthy articular cartilage at this surface, while the UCD-T2DM rats displayed cysts within the articular cartilage and at the junction between the articular cartilage and subchondral bone. Figures 2 and 3 show Safranin-O stained knees for both normal and UCD-T2DM rats in the lateral and medial aspects, respectively; arrows show areas of injury phenotype.
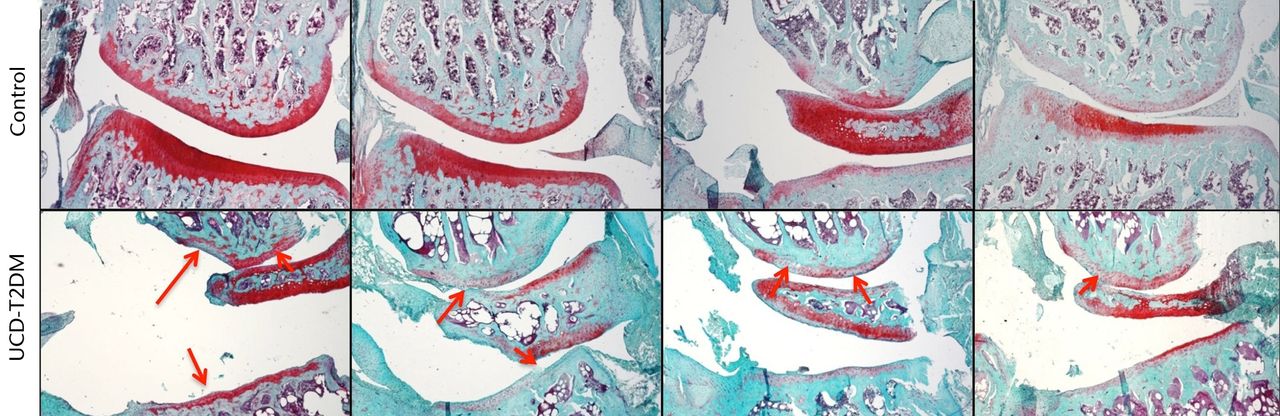
Fig. 2
Micrographs showing the lateral aspect; representative sections stained with Safranin-O/Fast Green, taken at 5x magnification. Arrows indicate areas in which erosion of articular cartilage, loss of staining, and other irregularities have occurred in the UCD-T2DM group. On the lateral aspect of the knee in the UCD-T2DM group, there is prominent reduction in articular cartilage quality at the femoral condyle and thinning of the cartilage at the tibial plateau.
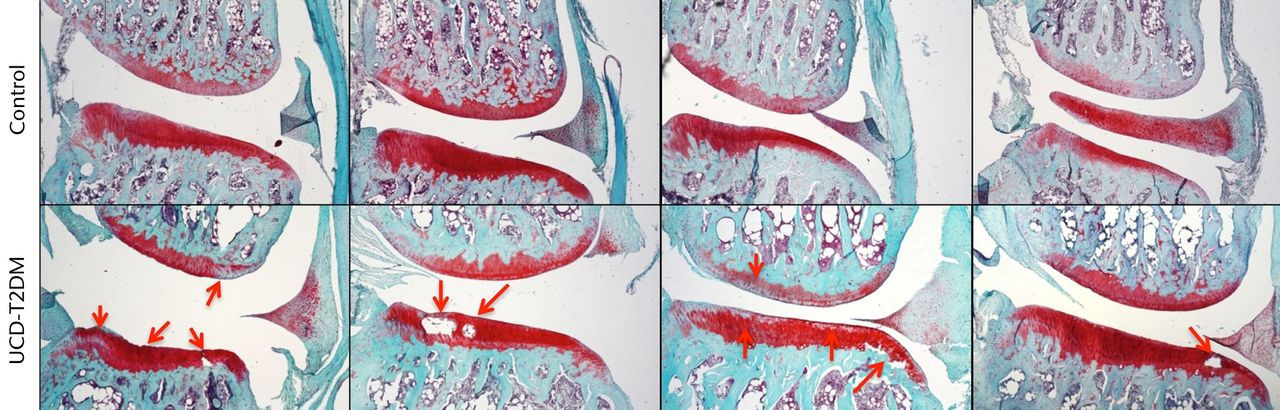
Fig. 3
Micrographs showing the medial aspect; representative sections stained with Safranin-O/Fast Green, taken at 5x magnification. Arrows indicate areas in which erosion of articular cartilage, loss of staining, and other irregularities have occurred in the UCD-T2DM group. On the medial side, the UCD-T2DM group showed cysts within the cartilage and pockets of chondrocyte loss along the tibial articular surface.
Immunohistochemistry
There does not appear to be an increase in type II collagen expression between the two rat groups. Type II collagen stained strongly at the chondrocytes throughout the articular cartilage. It was observed that the number of articular chondrocytes in the UCD-T2DM knees appears to be less than in normal knees, particularly in the lateral femoral condyle (Fig. 4). Type I collagen expression at the articular cartilage in the UCD-T2DM rats appears to remain limited to the superficial surface, in a similar way to the control rats. Figure 4 shows representative micrographs at 63x magnification of sections stained for col1a1 and col2a1. Figure 5 likewise shows representative micrographs of the medial femoral condyle.

Fig. 4
Micrographs showing the lateral aspect; series of representative sections stained with IHC for col I and col II, taken at 63x magnification.

Fig. 5
Micrographs showing the medial aspect; series of representative sections stained with IHC for col I and col II, taken at 63x magnification.
Mass and correlation with osteoarthritis
The masses of the rats used in this study were recorded before dissection. Control Lewis rats had a mean mass of 266 gm (sd 4.72). The UCD-T2DM rats had a mean mass of 592 gm (sd 16.0). A Welch Two-Sample t-test was used to compare the two rat groups, showing that the mass of these specimens is significantly different by strain (p < 0.001).
To explore the relationship between the mass of rats and their respective osteoarthritis score, a one-way ANOVA was conducted at each of the different regions of the knee. There was a statistically significant correlation between mass and histology score at the lateral femur (p = 0.011), medial femur (p = 0.003), and medial tibia (p = 0.031). The lateral tibia was not significantly correlated at p = 0.051, however, it can still be considered a strong relationship.
Figure 6 summarises the differences between the rats with respect to mass, while Figure 7 shows the correlation between mass and osteoarthritis severity by region.

Fig. 6
Bar chart showing the comparison of mass between control and UCD-T2DM rats. “*” denotes statistically significant difference in weight between the UC Davis T2DM rats and the control Lewis rats (p < 0.001) (Welch Two-Sample t-Test).
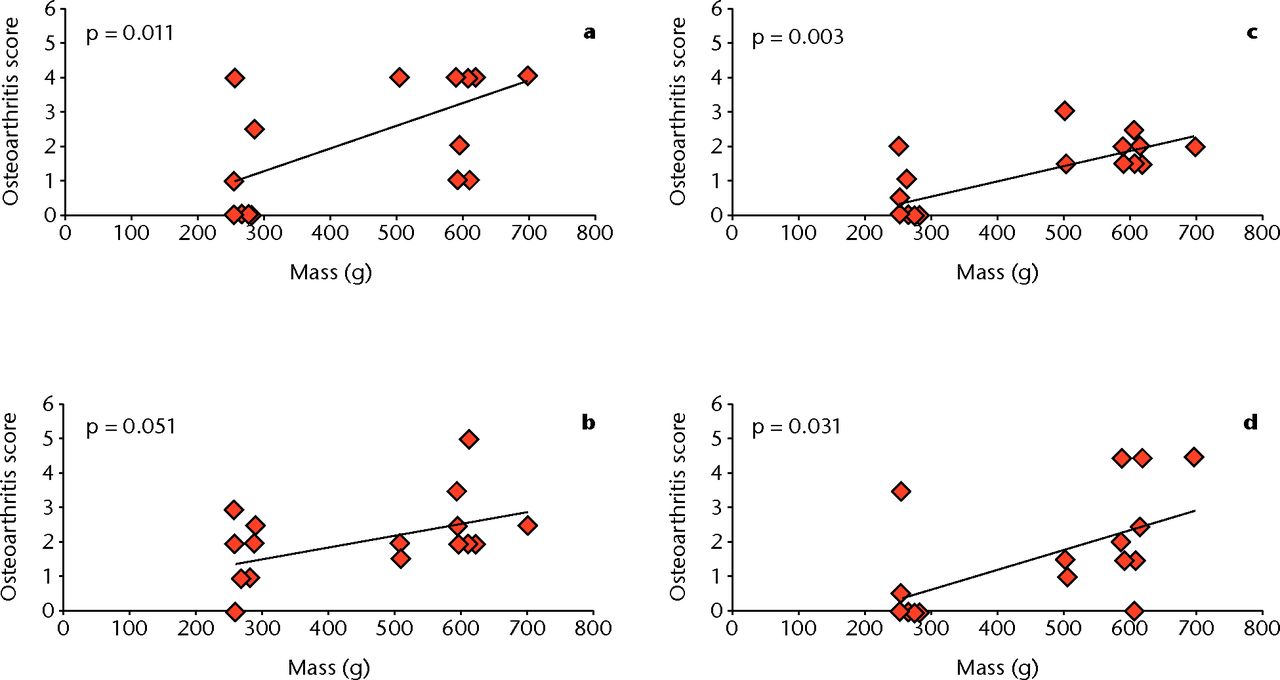
Fig. 7
Graphs showing the correlation between osteoarthritis score and mass at different regions of the knee: a) lateral femur, b) lateral tibia, c) medial femur, and d) medial tibia. There is significant correlation between mass and histological score at the lateral femur (p = 0.011), medial femur (p = 0.003), and medial tibia (p = 0.031). The lateral tibia is not significant, but can still be considered a strong correlation (p = 0.051) (one-way ANOVA).
The mean age of the UCD-T2DM rats used in this study was 228 days (sd 19.4). This significantly differed from the six-month-old (180 days) controls used in this study (p = 0.032). This may be due to the necessary length of time for the UCD rats to develop osteoarthritis before sacrifice. When considering the relationship between age and severity, there was no correlation between osteoarthritis score and T2DM at either femoral condyle or the lateral tibial plateau. However, at the medial tibial plateau there was statistically significant correlation with osteoarthritis severity (p = 0.046).
Discussion
The aims of this study were to histologically characterise the knees in rats with a unique type 2 diabetes phenotype and compare them with the knees in young healthy rats. Histologically, we were able to demonstrate that there was mild, global degeneration of the articular surfaces of the knee. Our immunohistochemistry stains did not show a change from type II collagen, normally found in the articular joint, to type I collagen, Overall, the results from this study suggest that this animal model can be used to further study the aspects of T2DM that contribute to the development and progression of osteoarthritis.
Type 2 diabetes is a fast-growing epidemic throughout the world, both in ‘first-world’ and developing countries.29 T2DM has been associated with a variety of musculoskeletal disorders, including osteoporosis and osteoarthritis.2,4-6,30 A 20-year longitudinal and cross-sectional study provided evidence that T2DM should be considered a risk factor independent of other factors such as body mass.4 However, the pathophysiological relationship between T2DM and osteoarthritis remains largely unknown.
The animal model used in this study, the Graham-Havel UC-Davis type II diabetic rat, has a polygenic phenotype similar to that of humans.24 Animals used in previous studies tended to be monogenic and had comorbidities such as infertility, not associated with human type 2 diabetes.23,24 The UCD type 2 diabetic rats not only had reduced insulin sensitivity, but also had significantly more body mass.24 This study clearly demonstrates that in the absence of an external injury, the UCD-T2DM had a lower quality of cartilage across regions of the knee, compared with control rats.
Body mass appeared to be an important factor based on the correlation with osteoarthritis score in this study. More severe phenotypes at the lateral femur, medial tibia, and medial femur were significantly correlated with greater mass (p = 0.011, 031 and 0.003, respectively). The lateral tibia, although not significantly different (p = 0.051), appeared to have a strong trend based on the one-way ANOVA. However, increased mass could potentially be a confounding factor in this study. It was formally believed that simply increasing the load to the knee, a weight-bearing joint, by increasing body mass, was enough to induce osteoarthritis. However, several studies have called the simplicity of that mechanism into question.4,9 It was suggested by Felson et al,9 based on a study of human radiographs, that obesity is correlated with osteoarthritis in the knee when a joint is misaligned. Furthermore, Mooney et al14 demonstrated that post-traumatic osteoarthritis progression was accelerated by a high-fat diet, but that this phenomenon was independent of weight gain. Future studies should include a body mass control to determine whether there are histological differences between groups having T2DM and having obesity. Studying joints bearing less weight than the knee, such as the shoulder, may also be beneficial in determining whether T2DM has effects independent of osteoarthritis progression.
Studies have suggested cross-linking of collagen fibres and the accumulation of aggregated glycation end-products (AGEs) as a potential mechanism for progression of osteoarthritis by ageing.22In vitro, non-enzymatic cross-linking of collagen fibres in cartilage tissue was achieved by incubating samples in media containing threose, ribose or methylglyoxal.22,23,26 Monnier et al20 showed that T2DM accelerated the accumulation of AGEs in skin samples from diabetic subjects.
Synthesising these studies together, T2DM may represent a type of advanced ageing, with more rapid accumulation of AGE than with age alone. Furthermore, Wagner et al23 demonstrated that human spinal disc tissue treated with methylglyoxal contained significantly increased amounts of AGEs, changing the biomechanical properties of the tissue. The implication here is that the stiffening of the collagen network changes the biomechanical properties of the tissues, making them less able to deform and potentially more susceptible to injury.
However, as pointed out by Willet et al,31 these in vitro studies have yet to show a direct causative effect between AGEs and the progression of osteoarthritis. In vivo studies by this group and Vos et al32 have shown that despite significantly increasing the amount of pentosidine, one form of AGE, osteoarthritis progression is not accelerated. Vos et al32 surgically induced canine osteoarthritis and were not able to show an effect of AGE on osteoarthritis severity at the time of onset by intra-articular treatment of ribose and threose. Willet et al31 also showed that artificially induced cross-linking with intra-artciular injections of 2M ribose in a spontaneous osteoarthritis model in Hartley guinea pigs, did not change the natural history of the disease compared with animals injected with saline only. This group quantified the non-enzymatic glycation of the articular cartilage, claiming they had achieved significantly increased cross-linking, comparable with the level typical in an 80-year-old human.31 Both models show that the cross-linking did not create a different phenotype from the injury controls. Thus, despite the evidence from in vitro models, the more recent in vivo models would suggest that cross-linking of collagen alone without the metabolic effects of T2DM may not be sufficient for the induction of osteoarthritis.
There are other indirect effects of cross-linking and obesity that could contribute to the understanding of T2DM-associated osteoarthritis. First, obesity, or more specifically the increase of adipose tissue, leads to an increase in circulating adipokines. Clinically, these adipokines have been shown to have a correlation with the degeneration of the articular cartilage.16,17 De Boer et al17 not only showed a relationship between upregulation of adipokines and osteoarthritis radiologically, but also confirmed these results histologically and biochemically. Aditionally, this group presented evidence to suggest that adipokines such as lectin and adiponectin also act on the synovial tissues of the joint, increasing the presence of pro-inflammatory cytokines such as interleukin-1β (IL-1β) and tumour necrosis factor-α (TNF-α).17
Although we have shown that there is a clear and significant histological difference between healthy rats and the UCD-T2DM rats, our study does possess some limitations that require us to temper our conclusions. Because the UCD-T2DM rats were frozen and then thawed prior to fixation, it is possible that morphology was affected. However, cryotechniques are commonly used in other histological studies, and have been able to maintain cellular morphology in vitro even at freezing; as a result, the morphology in the UCD rats should also remain unchanged.33
Genders were not tracked in the UCD-T2DM group, which may introduce some bias, although the population should have been evenly distributed. The rats used in this study were not age-matched, and the age among rats within the T2DM group also varied due to the differing onset of diabetes. However, the variance in ages did not have a significant impact on osteoarthritis severity except in the medial tibia, thus it was not considered a significant confounding variable.
The marked mass difference between the T2DM rats and control could also provide a bias in the data. It is also difficult to extrapolate the aspects of T2DM that contribute to the osteoarthritic phenotype, and we can only speculate based on the other studies presented here. Furthermore, we did not have enough animals in this study to harvest enough cartilage for biochemistry. However, this is beyond the scope of this study and should be considered for future work; the main objective was to confirm that the UCD-T2DM rats had an osteoarthritic phenotype at their knees.
This work shows a high prevalence of osteoarthritis in the UCD-T2DM rat knee. These rats differ from the control animals based upon their weight and presence of T2DM. We believe that both obesity and the advanced accumulation of the AGEs may be contributing to this osteoarthritic phenotype, however, the manner of this still remains unclear. The strength of this animal model is in the creation of a metabolic syndrome environment in these rats. Interventions that would be effective in clinical practice will also be effective in setting the multifactorial causation of T2DM. We suggest that further studies with these rats can focus on the control of weight and/or T2DM on the progression of osteoarthritis.
1 Siegel K , NarayanKM. The Unite for Diabetes campaign: overcoming constraints to find a global policy solution. Global Health2008;4:3.CrossrefPubMed Google Scholar
2 Douloumpakas I , PyrpasopoulouA, TriantafyllouA, SampanisCh, Aslanidis S. Prevalence of musculoskeletal disorders in patients with type 2 diabetes mellitus: a pilot study. Hippokratia2007;11:216–218.PubMed Google Scholar
3 Griffin TM , HuebnerJL, KrausVB, YanZ, GuilakF. Induction of osteoarthritis and metabolic inflammation by a very high-fat diet in mice: effects of short-term exercise. Arthritis Rheum2012;64:443–453.CrossrefPubMed Google Scholar
4 Schett G , KleyerA, PerriconeC, et al.Diabetes is an independent predictor for severe osteoarthritis: results from a longitudinal cohort study. Diabetes Care2013;36:403–409.CrossrefPubMed Google Scholar
5 Yan W , LiX. Impact of diabetes and its treatments on skeletal diseases. Front Med2013;7:81–90.CrossrefPubMed Google Scholar
6 Rizvi AA , ChillagSA, ChillagKJ. Perioperative management of diabetes and hyperglycemia in patients undergoing orthopaedic surgery. J Am Acad Orthop Surg2010;18:426–435.CrossrefPubMed Google Scholar
7 Berenbaum F , EymardF, HouardX. Osteoarthritis, inflammation and obesity. Curr Opin Rheumatol2013;25:114–118.CrossrefPubMed Google Scholar
8 Davis MA , EttingerWH, NeuhausJM, HauckWW. Sex differences in osteoarthritis of the knee. The role of obesity. Am J Epidemiol1988;127:1019–1030.CrossrefPubMed Google Scholar
9 Felson DT , GogginsJ, NiuJ, ZhangY, HunterDJ. The effect of body weight on progression of knee osteoarthritis is dependent on alignment. Arthritis Rheum2004;50:3904–3909.CrossrefPubMed Google Scholar
10 Guh DP , ZhangW, BansbackN, et al.The incidence of co-morbidities related to obesity and overweight: a systematic review and meta-analysis. BMC Public Health2009;9:88.CrossrefPubMed Google Scholar
11 Harms S , LarsonR, SahmounAE, BealJR. Obesity increases the likelihood of total joint replacement surgery among younger adults. Int Orthop2007;31:23–26.CrossrefPubMed Google Scholar
12 Iwata M, Ochi H, Hara Y, et al. Initial responses of articular tissues in a murine high-fat diet-induced osteoarthritis model: pivotal role of the IPFP as a cytokine fountain. PLoS One 2013;8:e60706. Google Scholar
13 Louer CR , FurmanBD, HuebnerJL, et al.Diet-induced obesity significantly increases the severity of posttraumatic arthritis in mice. Arthritis Rheum2012;64:3220–3230.CrossrefPubMed Google Scholar
14 Mooney RA, Sampson ER, Lerea J, Rosier RN, Zuscik MJ. High-fat diet accelerates progression of osteoarthritis after meniscal/ligamentous injury. Arthritis Res Ther 2011;13:R198. Google Scholar
15 Sharma L , SongJ, FelsonDT, et al.The role of knee alignment in disease progression and functional decline in knee osteoarthritis. JAMA2001;286:188–195.CrossrefPubMed Google Scholar
16 Berry PA , JonesSW, CicuttiniFM, WlukaAE, MaciewiczRA. Temporal relationship between serum adipokines, biomarkers of bone and cartilage turnover, and cartilage volume loss in a population with clinical knee osteoarthritis. Arthritis Rheum2011;63:700–707.CrossrefPubMed Google Scholar
17 de Boer TN , van SpilWE, HuismanAM, et al.Serum adipokines in osteoarthritis; comparison with controls and relationship with local parameters of synovial inflammation and cartilage damage. Osteoarthritis Cartilage2012;20:846–853.CrossrefPubMed Google Scholar
18 Rosa SC , RufinoAT, JudasFM, et al.Role of glucose as a modulator of anabolic and catabolic gene expression in normal and osteoarthritic human chondrocytes. J Cell Biochem2011;112:2813–2814.CrossrefPubMed Google Scholar
19 Srinivasan K , RamaraoP. Animal models in type 2 diabetes research: an overview. Indian J Med Res2007;125:451–472.PubMed Google Scholar
20 Monnier VM , KohnRR, CeramiA. Accelerated age-related browning of human collagen in diabetes mellitus. Proc Natl Acad Sci U S A1984;81:583–587.CrossrefPubMed Google Scholar
21 Bansal S , SiddarthM, ChawlaD, et al.Advanced glycation end products enhance reactive oxygen and nitrogen species generation in neutrophils in vitro. Mol Cell Biochem2012;361:289–296.CrossrefPubMed Google Scholar
22 Verzijl N , DeGrootJ, BenZC, et al.Crosslinking by advanced glycation end products increases the stiffness of the collagen network in human articular cartilage: a possible mechanism through which age is a risk factor for osteoarthritis. Arthritis Rheum2002;46:114–123.CrossrefPubMed Google Scholar
23 Wagner DR , ReiserKM, LotzJC. Glycation increases human annulus fibrosus stiffness in both experimental measurements and theoretical predictions. J Biomech2006;39:1021–1029.CrossrefPubMed Google Scholar
24 Cummings BP , DigitaleEK, StanhopeKL, et al.Development and characterization of a novel rat model of type 2 diabetes mellitus: the UC Davis type 2 diabetes mellitus UCD-T2DM rat. Am J Physiol Regul Integr Comp Physiol2008;295:R1782–R1793.CrossrefPubMed Google Scholar
25 Pritzker KP , GayS, JimenezSA, et al.Osteoarthritis cartilage histopathology: grading and staging. Osteoarthritis Cartilage.2006;14:13–29.CrossrefPubMed Google Scholar
26 Kokkonen HT , MäkeläJ, KulmalaKA, et al.Computed tomography detects changes in contrast agent diffusion after collagen cross-linking typical to natural aging of articular cartilage. Osteoarthritis Cartilage2011;19:1190–1198.CrossrefPubMed Google Scholar
27 Ihaka R , GentlemanR. R: A language for data analysis and graphics. Journal of Computational and Graphical Statistics1996;5;299–314. Google Scholar
28 Oyeka ICA . Modified Wilcoxon Signed-Rank Test. Open Journal of Statistics2012;2:172–176. Google Scholar
29 Zimmet P , AlbertiKG, ShawJ. Global and societal implications of the diabetes epidemic. Nature2001;414:782–787.CrossrefPubMed Google Scholar
30 Sealand R , RazaviC, AdlerRA. Diabetes mellitus and osteoporosis. Curr Diab Rep2013;13:411–418. Google Scholar
31 Willett TL , KandelR, De CroosJN, AveryNC, GrynpasMD. Enhanced levels of non-enzymatic glycation and pentosidine crosslinking in spontaneous osteoarthritis progression. Osteoarthritis Cartilage2012;20:736–744.CrossrefPubMed Google Scholar
32 Vos PA , DeGrootJ, Barten-van RijbroekAD, et al.Elevation of cartilage AGEs does not accelerate initiation of canine experimental osteoarthritis upon mild surgical damage. J Orthop Res2012;30:1398–1404. Google Scholar
33 Muiños-López E , Rendal-VázquezME, Hermida-GómezT, et al.Cryopreservation effect on proliferative and chondrogenic potential of human chondrocytes isolated from superficial and deep cartilage. Open Orthop J2012;6:150–159.CrossrefPubMed Google Scholar
Funding statement:
A. Dang reports receipt of startup funding for this article from the Northern California Institute for Research and Education, and from the UCSF Department of Orthopaedic Surgery. L. Metz reports that the University of California has received a Clinician Scientist Training grant from the Orthopaedic Research and Education Foundation; this funding is not related to this article.
Author contributions:
T. Onur: Data collection, Data analysis, Writing the paper, Performed surgeries
R. Wu: Data collection, Data analysis, Writing the paper
L. Metz: Performed surgeries
A. Dang: Data analysis, Writing the paper
ICMJE Conflict of Interest:
None declared
©2014 The British Editorial Society of Bone & Joint Surgery. This is an open-access article distributed under the terms of the Creative Commons Attributions licence, which permits unrestricted use, distribution, and reproduction in any medium, but not for commercial gain, provided the original author and source are credited.
