


Abstract
Objective
The main object of this study was to use a geometric morphometric approach to quantify the left-right symmetry of talus bones.
Methods
Analysis was carried out using CT scan images of 11 pairs of intact tali. Two important geometric parameters, volume and surface area, were quantified for left and right talus bones. The geometric shape variations between the right and left talus bones were also measured using deviation analysis. Furthermore, location of asymmetry in the geometric shapes were identified.
Results
Numerical results showed that talus bones are bilaterally symmetrical in nature, and the difference between the surface area of the left and right talus bones was less than 7.5%. Similarly, the difference in the volume of both bones was less than 7.5%. Results of the three-dimensional (3D) deviation analyses demonstrated the mean deviation between left and right talus bones were in the range of -0.74 mm to 0.62 mm. It was observed that in eight of 11 subjects, the deviation in symmetry occurred in regions that are clinically less important during talus surgery.
Conclusions
We conclude that left and right talus bones of intact human ankle joints show a strong degree of symmetry. The results of this study may have significance with respect to talus surgery, and in investigating traumatic talus injury where the geometric shape of the contralateral talus can be used as control.
Cite this article: Bone Joint Res 2014;3:139–45.
Article focus
Investigating the left-right symmetry of talus bones from intact ankle joints using a reliable 3D geometric morphometric approach which is based on deviation analysis, and is independent of landmark placing.
Can we use the geometric shape of the contralateral talus bone as a control to produce a mirror image as a template for the creation of an artificial prosthesis?
Investigating the 3D geometric shape variation between left and right talus bones for male and female subjects using a novel approach called deviation colour maps (DCMs).
Key messages
Left and right talus bones of intact human ankle joints show a strong degree of symmetry.
The deviation in symmetry occurred in regions that are clinically less important during talus surgery.
Left-right symmetry analysis of bones is important for implant design, mechanical testing, and for using the contralateral bone as a control. However, surgeons have not had any solid evidence that the two bones are symmetrical in 3D. The results obtained from this study may have significant clinical importance for talus bone replacement surgery where the geometric shape of the contralateral talus bone can be used as a control.
Location of asymmetry in the geometric shape between the left and right talus bone within the same subjects may help orthopaedic surgeons to plan pre-operatively for complex talar fractures, and thus design accurate and functional talus bone prostheses. The findings of the current research will be used in future studies to develop a geometrically engineered talus implant to avoid mismatch during implant design.
Strengths and limitations
Although symmetry analyses of bone structures have been performed in the past, these studies used only volumetric and cross-sectional properties to quantify left-right symmetry of bones. To our knowledge, there has not been a thorough investigation on the symmetrical/asymmetrical nature of talus bones.
There was no clear distinction in DCMs between male and female talus bones. In this study, eight male and three female subjects were used. Additional subjects will be included in future studies, but the current number is sufficient to establish the principle.
Another limitation of the study is slice thickness and the image quality of the CT scan. Future studies will use advanced CT scan imaging techniques to generate higher resolution images with a narrower slice thickness.
Introduction
Bilateral symmetry is a ubiquitous concept, frequently used in geometric morphometric studies of biological structures. Symmetry is an extrinsic geometric property of shape,1 and it implies that the geometric shape of a structure is similar to, or repeated in, another structure in a different orientation. Bilateral symmetry consists of matching symmetry and object symmetry.2 In cases of matching symmetry, two geometric shapes exist on the left and right side as mirror images of one another. Symmetry can be identified by matching the two shapes through reflection and superposition and symmetry analysis of shapes is a common concept which has been used in various engineering and medical applications.3-5
Although symmetry analyses of bone structures have been performed,6-10 these studies used only volumetric and cross-sectional properties to quantify left-right symmetry of bones - no thorough investigation has been performed on the symmetrical/asymmetrical nature of talus bones. Furthermore, these previous studies failed to capture the complex overall 3D geometry of the bone structures. A geometric morphometric approach is any computational technique used to investigate the shape of simple and complex structures. This approach is gaining popularity in computational biomechanics for investigating the complex geometric shape variations of skeletal structures.11-13 Given that any deviation from the normal geometric shape is an indication of abnormality, the task of identifying deviations in geometric shape from the healthy, normal geometry is of primary concern in any biomechanical analysis.14 Injury, disease, or abnormal mechanical stimuli can change bone geometry.15 In the interest of identifying and addressing these geometric abnormalities, a geometric morphometric approach is a popular non-invasive technique by which to analyse complex geometric shapes.
The ankle joint of the human body is a complex load-bearing joint. The talus articulates with four other bones – the tibia, fibula, calcaneus, and navicular; thus, making the design of talus implants very challenging. A clear understanding of complex ankle anatomy and morphology is essential for successful talar bone replacement. The clinical situation where a talar bone replacement is indicated, occurs in the case of avascular necrosis of the talus with collapse post-trauma or due to idiopathic causes.16-20 A significant anatomical characteristic of the talus bone is its ability both to effectively resist high compressive forces exerted by the tibia (five to six times body weight during walking), and to distribute these forces over the entire articulating surface. The complex talus morphology and articular surfaces are highlighted in Figure 1. Many two- and three-dimensional (2D and 3D) morphometric studies have placed manual landmarks in various anatomical locations to study complex shapes by performing principal component analysis, or canonical variate analysis.11-13,21-23 Some morphometric studies describe complex 3D shapes using a statistical shape-modelling technique, but this technique is contingent upon body size and mass, and is dependent on landmarks.11 In this study, we investigated the left-right symmetry of the talus bone using a reliable 3D geometric morphometric approach which is based on deviation analysis, and is independent of landmark placing. This analysis represents the outcome as 3D deviation colour maps (DCMs) that provide a visual understanding of the shape variations. Recently, our research group applied a similar technique to investigate different biomechanical engineering problems.24,25
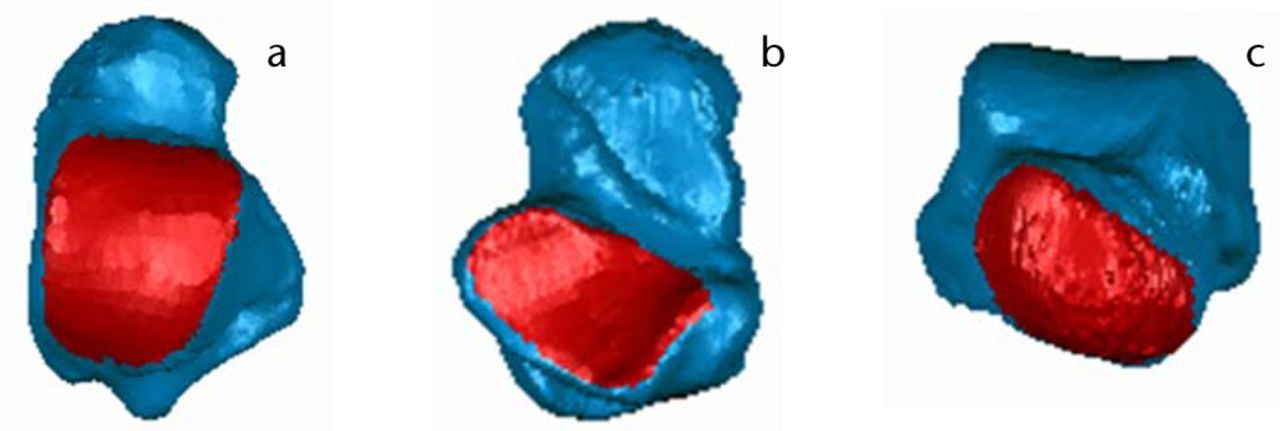
Fig. 1
Images of talus bone morphology (from left) a) Dorsal view; b) Plantar view; c) Anterior view. Articular surfaces (i.e., talar dome (a), subtalar (b), and talar head (c) are shown in red.
An accurate 3D geometric analysis of the shape of the talus bone is essential for successful surgical intervention and talar replacement in the setting of complex injuries. One option in current clinical practice is to scan the contralateral unaffected talus to produce a mirror image as a template for the creation of an artificial prosthesis.16-20 However, there is presently no evidence that the talus bones of the ankle joint are symmetrical in shape. It is important to document the symmetry between left and right talus bones if improvements in the treatment of severe talus bones injuries are to be continued. A mismatch in the size and shape will not only increase the stress on the articulating surface, but might also have long-term detrimental effects on ankle movement. Additionally, verifying the left-right symmetry would be useful for paired biomechanical experiments. The specific objective of this work is to investigate the left-right symmetry of talus bones from intact ankle joints using geometric morphometric analysis, with the results of the study intended for future use in the development of an artificial talus implant. We hypothesised that the left and right talus bones would be symmetrical to a high degree.
Materials and Methods
A total of 11 pairs of left-right intact talus bone CT scans (eight male, three female; mean age: 33 years, sd 14; 21 to 64) were obtained from the University of Alberta Hospital. Ethical approval was obtained through the regional human ethics board at the University of Alberta to use the CT scans for analysis. All subjects had been scanned in a supine position. The CT scans were performed using high-resolution Somatom definition flash scanner with the following specifications: pitch 0.8 mm, gantry tilt 0 degree, current 80 mA, voltage 120 kVp, time of the individual scan projection 10 seconds or less. Each CT scan data set was made up of an average 191 slices, with 512 × 512 pixels per slice. The pixel size of the CT scans was 0.36 mm, with a constant slice thickness of 1 mm.
The image processing software MIMICS (Materialize NV, Belgium) was used to create a 3D digitised geometry of the talus bone from the CT scan images. Once the digitisation was completed, 3D geometries of the talus bones were imported into Geomagic Studio 2013 (Geomagic®, Morrisville, North Carolina). In order to compare the left and right talus bones, the left talus was first reflected using the mirror function. Next, the left and right talus bones were aligned, one on top of the other, using two built-in registration methods (manual and automatic) of Geomagic Studio 2013. The automatic registration method uses an iterative closest point algorithm to best-fit the objects. Once the alignment had been completed, both talus bones were imported into Geomagic Qualify 2013 (Geomagic®), and a deviation analysis was performed, in which the right talus bone was used as the reference model, while the left talus bone was used as a target model.24,25 Finally, 3D deviation analysis was -performed between the two talus bone geometries in order to quantify the extent to which the target model (left talus bone) deviated from the reference model (right talus bone). The output parameters generated from the 3D comparisons showed positive as well as negative deviations (orthogonal distance), indicating that the surfaces of the target models were above or below the surface of the reference models, respectively. The 3D deviation analysis between two surfaces provided maximum positive and negative deviation, average positive and negative deviation, and root mean square (RMS) values. From this point onwards, the term ‘deviation’, when used alone, indicates the absolute value of the deviation between the target and the reference model. Also, a subroutine was developed in Wolfram Mathematica (Wolfram Research, Inc., Mathematica, Version 8.0.4.0) to observe and assess the regions of asymmetry, and the regions with a deviation higher than 1 mm between the target and reference models were automatically isolated using the DCMs.24
Since in the real-world bones are not perfectly symmetrical, we can use the term approximate symmetry in the context of investigating the symmetry of geometric shapes. In addition to the deviation analyses, geometric parameters such as surface areas (SA) and bone volumes (BV) of the left and right talus bones were also quantified using Geomagic Qualify 2013. Left-right comparisons of SA and BV of the talus bones were calculated using an approach similar to that of Adams et al (1995).7
A paired two-tailed t-test was also conducted using Statistica 10.0 (StatSoft, Tulsa, Oklahoma); normality was checked and significance was set at p < 0.05 to compare the variation between the surface area and the volume of the left and right talus bones.
Results
Variations in the geometric parameters between left and right talus bones are presented in Table I. The volumetric differences between left and right talus bones were found to be < 7.5%, and the differences between surface areas were also found to be < 7.5%. No statistically significant differences (p > 0.05) were found in the surface area and the volume between left and right talus bones.
Table I
Percentage differences between left and right talus bones in geometric parameters. M, Male; F, Female; BV (Left), volume of left talus bone; BV (Right), volume of right talus bone; SA (Left), surface area of left talus bone; SA (Right), surface area of right talus bone.
| Subject | Sex (M/F) | BV(Left) (mm3) | BV (Right) (mm3) | % Difference | SA (Left) (mm2) | SA (Right) (mm2) | % Difference |
|---|---|---|---|---|---|---|---|
| S1 | F | 28103.25 | 28858.46 | -2.65 | 5752.32 | 5829.37 | -1.33 |
| S2 | M | 44300.37 | 44283.15 | 0.04 | 7608.31 | 7638.8 | -0.40 |
| S3 | M | 37555.184 | 36753.22 | 2.16 | 6705.57 | 6705.62 | 0.00 |
| S4 | M | 39201.02 | 40366.78 | -2.93 | 7227.5 | 7370.1 | -1.95 |
| S5 | F | 32990.87 | 32348.83 | 1.97 | 6504.6 | 6326.18 | 2.78 |
| S6 | M | 45204.88 | 45103.61 | 0.22 | 7937.3 | 7941.02 | -0.05 |
| S7 | M | 50930.24 | 51540.84 | -1.19 | 8006.78 | 8091.01 | -1.05 |
| S8 | F | 29866.84 | 29504.52 | 1.22 | 5832.31 | 5795.01 | 0.64 |
| S9 | M | 48439.56 | 49529.7 | -2.23 | 8269.51 | 8441.2 | -2.05 |
| S10 | M | 47461.14 | 49598.92 | -4.41 | 7927.08 | 8158.56 | -2.88 |
| S11 | M | 38301.21 | 41207.4 | -7.31 | 7021.61 | 7565.46 | -7.46 |
The maximum positive and negative deviation, mean positive and negative deviation, and RMS are given in Table II. The detailed results of the complete talus geometries, presented in Table III, show the extent of left and right deviation. In comparing the whole geometry, 69.5, less than 7.6% of the surface of the left and right talus bones were found to be within a deviation of less than 0.5 mm. Figures 2 and 3 depict the DCMs generated after deviation analysis, as well as the region of higher deviation. Figures 4 and 5 depict the regions of asymmetry where the deviations are greater than 1mm. A total of 9.33, < 6.67% of the surface had a deviation greater than 1mm. The DCM represents the distance (mm) between right talus bone surface and left talus bone surface, where the light blue/yellow colour indicates that the deviation between two surfaces is very small (< 0.5mm), and the dark red/blue colour is > 2.0 mm. Furthermore, positive values in the legend indicate outward deviation and negative values indicate inward deviation.

Fig. 2
Dorsal view of analysed talus models and deviation colour maps (mm).
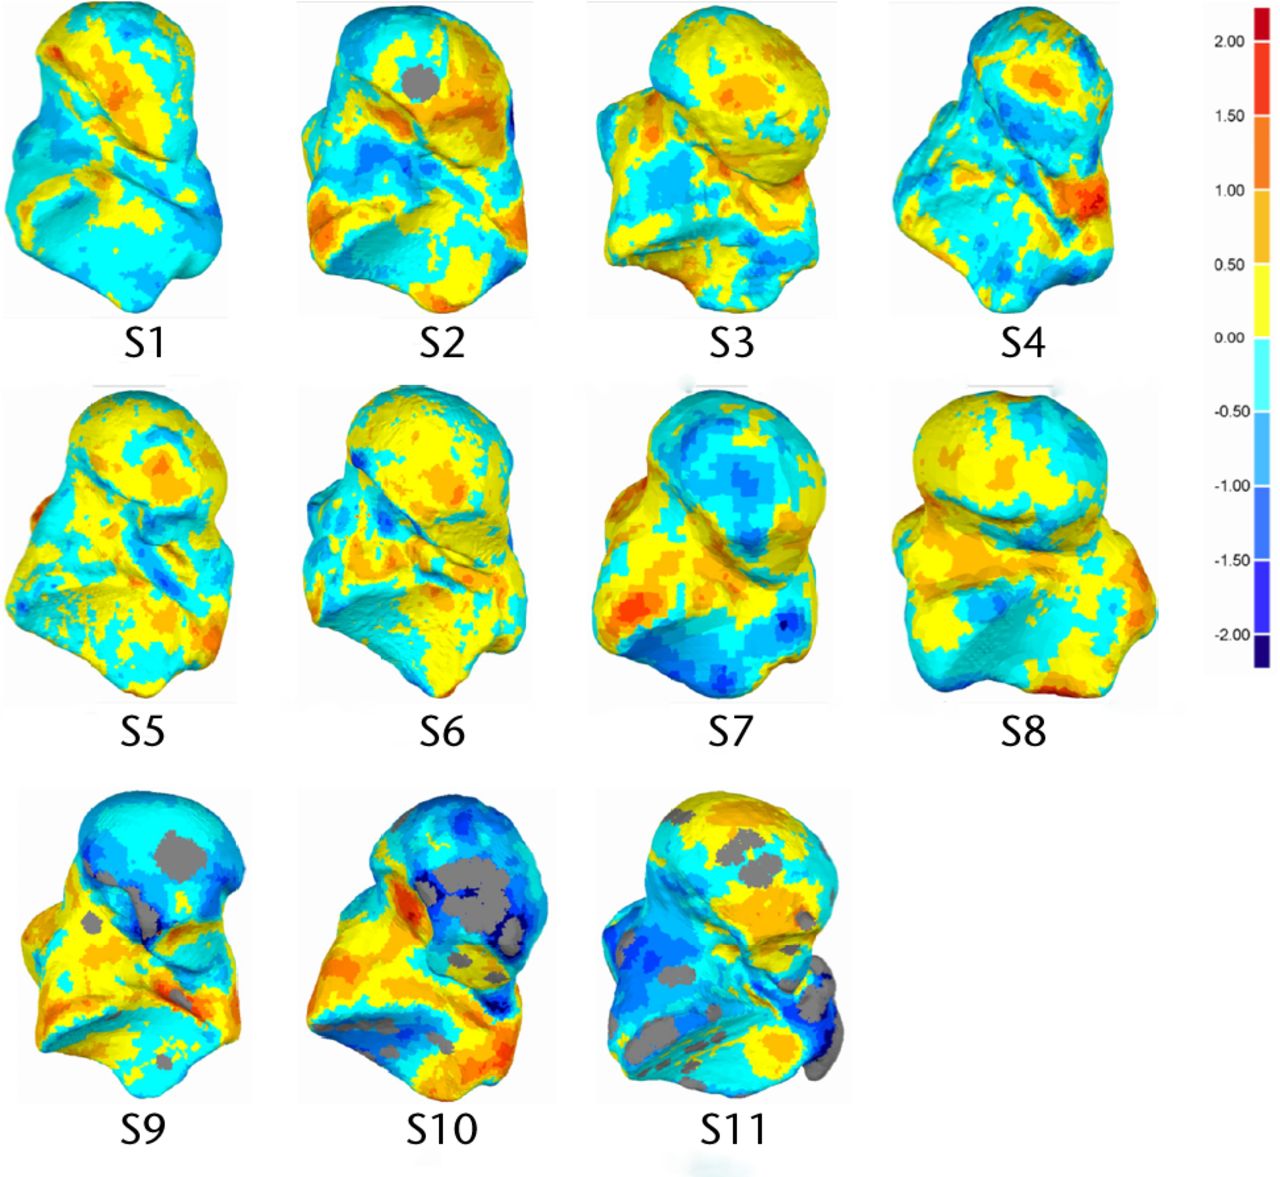
Fig. 3
Plantar view of analysed talus models and deviation colour maps (DCM) (mm).
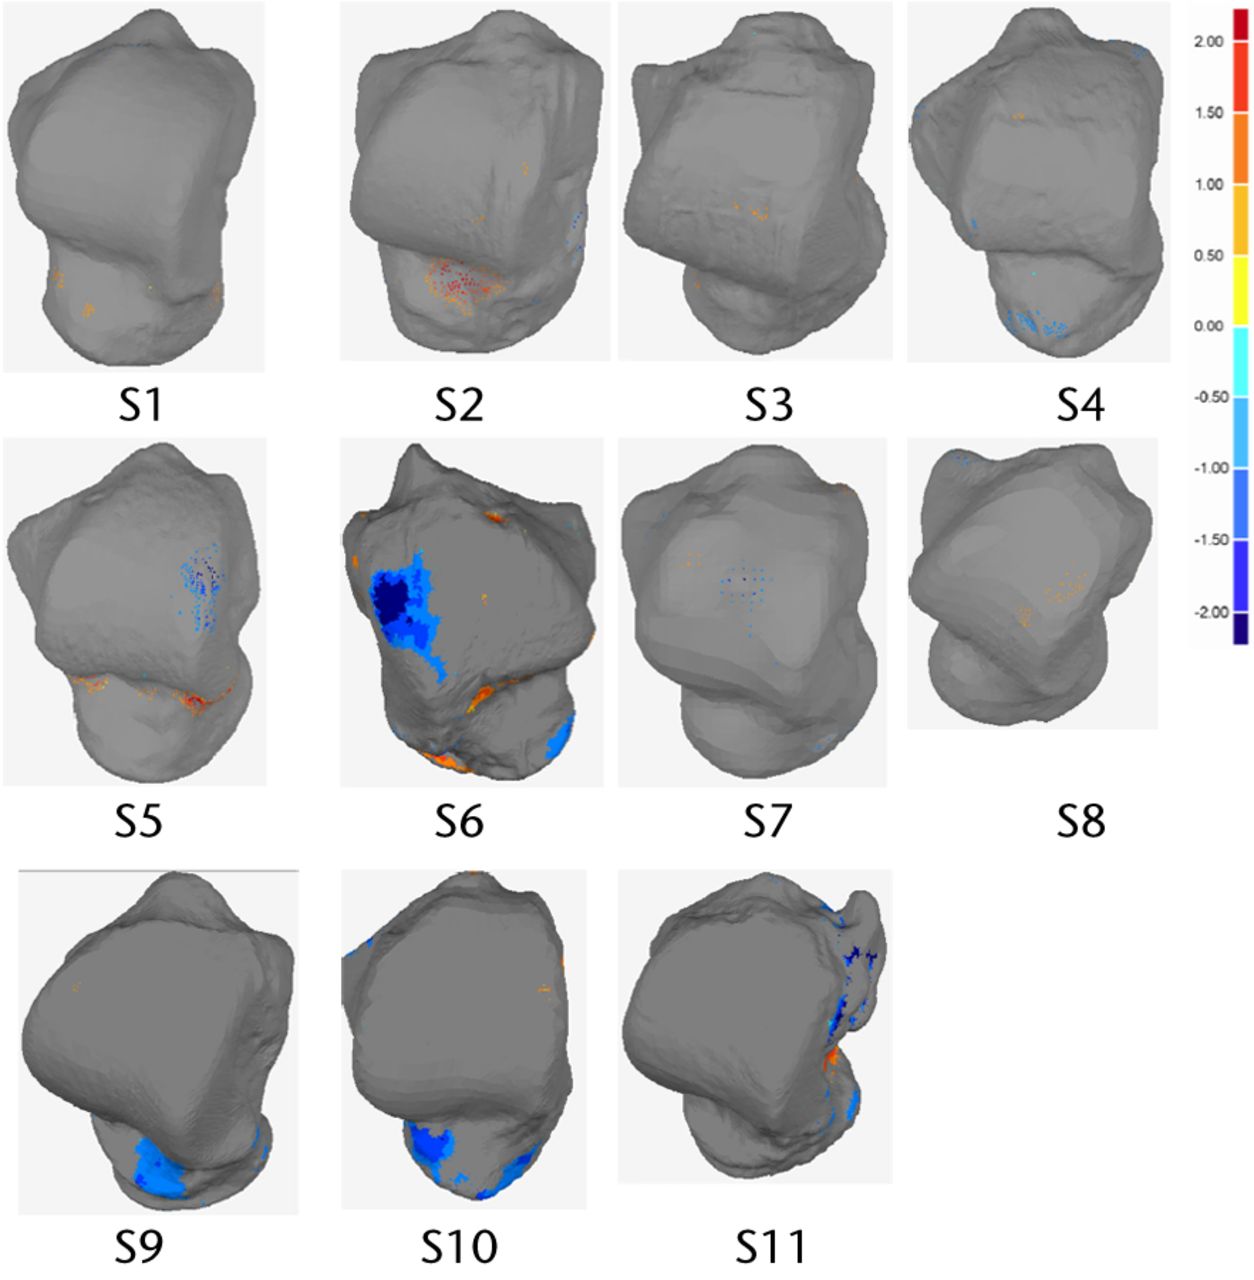
Fig. 4
Dorsal view of analysed talus models and deviation colour maps (DCM) (mm) showing the regions with deviation higher than 1mm.
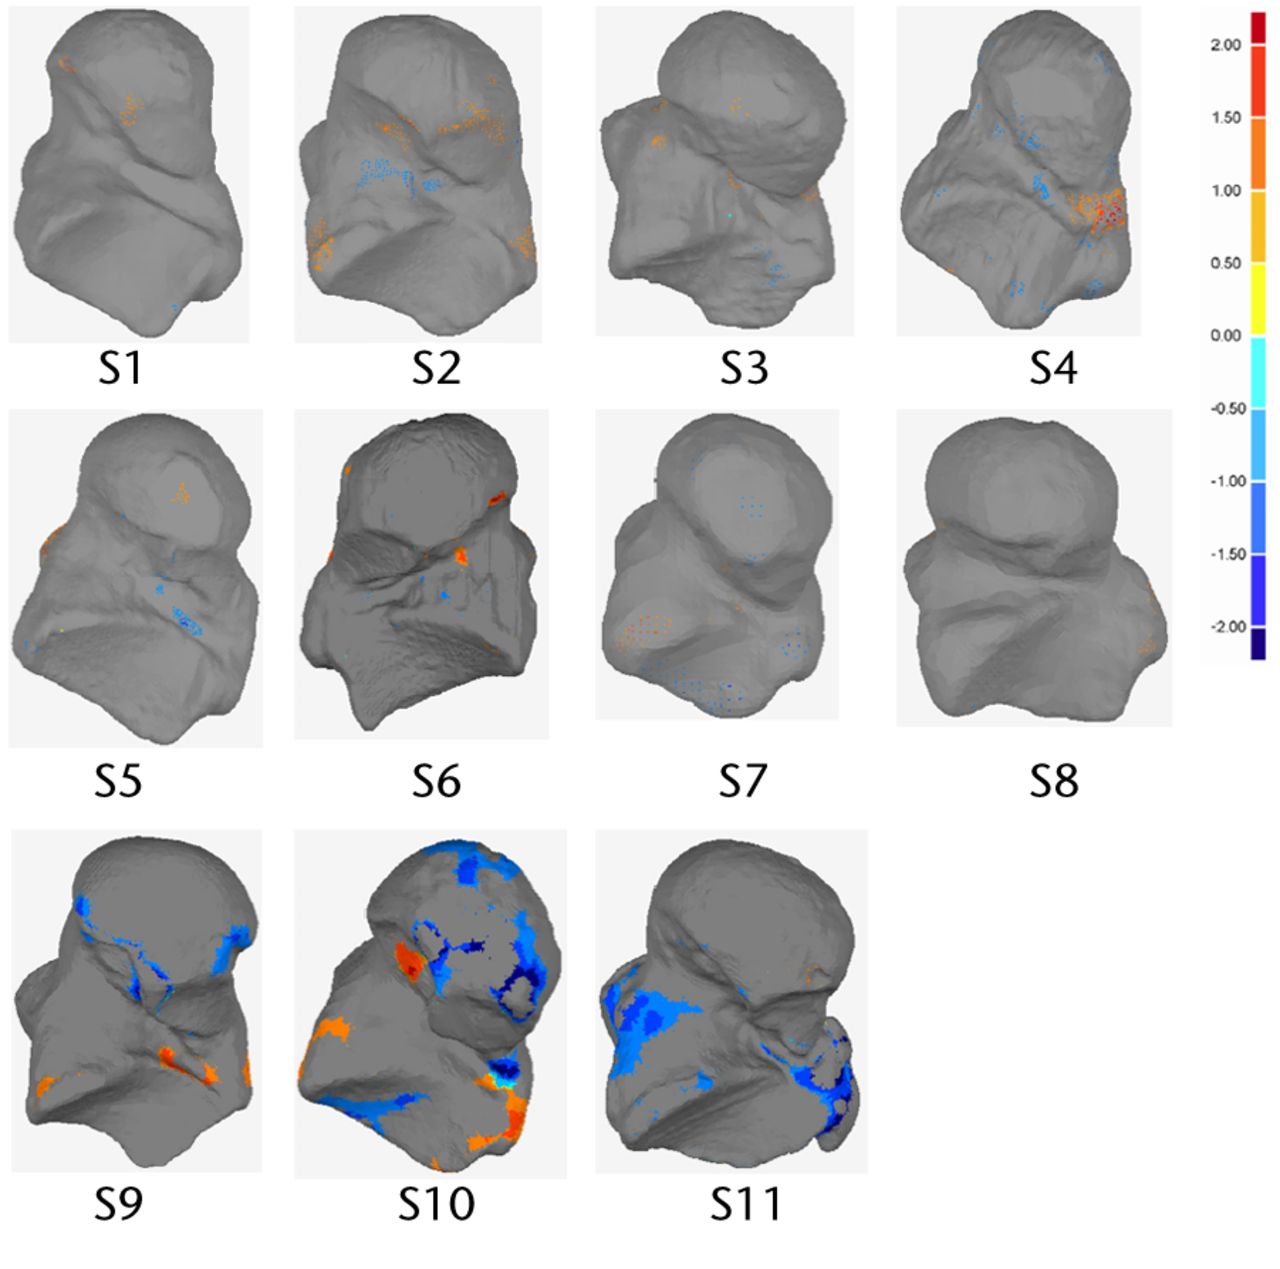
Fig. 5
Plantar view of analysed talus models and deviation colour maps (DCM) (mm) showing the regions with deviation higher than 1mm
Table II
Summary of deviation analyses.dmax(+), maximum positive deviation; dmax(-), maximum negative deviation; davg(+), mean positive deviation; davg(-), mean negative deviation; RMS, root mean square of deviation
| Subject | dmax(+) (mm) | dmax(-) (mm) | davg(+) (mm) | davg(-) (mm) | RMS |
|---|---|---|---|---|---|
| S1 | 2.02 | -1.7 | 0.33 | -0.34 | 0.43 |
| S2 | 2.58 | -2.39 | 0.51 | -0.45 | 0.61 |
| S3 | 1.63 | -1.34 | 0.38 | -0.27 | 0.43 |
| S4 | 2.13 | -1.64 | 0.32 | -0.38 | 0.47 |
| S5 | 2.89 | -2.84 | 0.43 | -0.3 | 0.55 |
| S6 | 3.04 | -2.99 | 0.42 | -0.41 | 0.57 |
| S7 | 2.12 | -2.05 | 0.46 | -0.48 | 0.61 |
| S8 | 2.42 | -1.82 | 0.43 | -0.35 | 0.51 |
| S9 | 2.67 | -3.15 | 0.43 | -0.58 | 0.67 |
| S10 | 2.28 | -3.16 | 0.62 | -0.74 | 0.88 |
| S11 | 2.21 | -2.87 | 0.46 | -0.67 | 0.78 |
Table III
Deviation distribution between left and right talus bone geometry
| Subject | % below 0.5 mm | % between 0.5 mm and 1 mm | % between 1.0 mm and 1.5 mm | % above 1.5 mm |
|---|---|---|---|---|
| S1 | 77.61 | 20.12 | 1.96 | 0.31 |
| S2 | 60.38 | 30.44 | 7.45 | 1.73 |
| S3 | 76.22 | 21.44 | 2.29 | 0.05 |
| S4 | 75.29 | 20.29 | 3.83 | 0.59 |
| S5 | 76.84 | 15.18 | 5.06 | 2.92 |
| S6 | 69.3 | 22.37 | 5.88 | 2.45 |
| S7 | 62.54 | 26.88 | 8.53 | 2.05 |
| S8 | 69.04 | 26.43 | 3.57 | 0.96 |
| S9 | 58.1 | 29.78 | 9.13 | 2.99 |
| S10 | 43.67 | 31.39 | 16.88 | 8.06 |
| S11 | 52.37 | 31.73 | 9.15 | 6.75 |
| Mean | 69.480 | 23.659 | 4.821 | 1.561 |
| sd | 7.584 | 5.048 | 2.360 | 1.124 |
Discussion
Severe talus bone fractures can result in talus collapse, with significant pain and dysfunction. Talus body replacement is a new and evolving treatment option that can decrease pain and improve function.17 Successful development of a talar body prosthesis depends on improved understanding of the proper morphometric and geometric shape of the talus bone. Furthermore, landmark-based 2D and 3D shape analysis is not capable of capturing the complex geometric shape of this bone. To address this shortcoming in existing research, we performed asymmetry analysis of left and right talus bones using a 3D geometric morphometric method that is independent of landmark placement. Our approach involved segmentation of the talus bone geometry from CT scan images, and performing symmetry analysis using an iterative closest point algorithm in Geomagic Studio/Qualify 2013.
Two important geometric parameters, BV and SA, were quantified for left and right talus bones using 11 pairs of intact ankle joints. Although the curvatures of the left and right talus bones were not explicitly measured, the shapes were compared using the deviation tool. Percent differences in those parameters between left and right talus bones were small, which indicated that left and right talus bones are geometrically symmetrical (see Table I). It is also notable that there was no difference in degree of symmetry in male versus female talus bones.
The geometric shape variations between the right and left talus bones were measured and presented using a deviation analysis (Tables II and III) and DCMs (Figs. 2 and 3). Deviation analysis confirmed that left and right talus bone geometries were symmetrical, as the deviation between the two geometric shapes was small (in the range of -0.74 mm to 0.62 mm, as seen in Table II) and is within a clinically acceptable range with respect to causing increased local pressures.26 The detailed deviation analysis quantified the extent to which the right talus bone geometry deviated from the left (Table III), and it was found that a very small portion (1.56 ± 1.124%) of the left and right bones deviated from one another by more than ± 1.5 mm (Table III), meaning that left and right talus bones are geometrically symmetrical. As seen in figure 5 samples S10 and S11, the significant proportion of these larger discrepancies come from the non-articular surfaces. The RMS of deviation were also quantified, and this showed an indirect correlation with the magnitude of deviations. Specifically, the RMS elevates with an increase in deviation. It is also notable that for the regions which showed the greatest deviation, this may be due to image artifacts, noise in the CT scan images, or manual segmentation of bones in MIMICS. It is also worth noting that while the CT slice thickness was 1mm, the resolution within each slice was 0.36mm. The algorithm to create the geometry assumes the cross section to be in the middle of the slides, and creates stereo lithography (STL) geometry by interpolating between cross sections. The exact precision of this method is not easily defined, but it lies somewhere between 0.36 mm and 1mm. The images noise, the manual segmentation and the resolution of the image are all sources of error. However, the results indicate that with all these sources, the left and the right talus bones are, from a practical point of view, symmetrical.
Graphically, the DCMs gave a clear visualisation of deviation, highlighting the regions of higher deviation. It should be noted that the DCMs presented in Figures 2 and 3 did not show any general trend. Deviations larger than ± 1mm were not located on the articular surfaces except in three subjects (S5, S6 and S10) (Figs 4 and 5). Clinically, this is important as the articular surfaces should be a good match (typically < 2mm deviation) for clinical function and prevention of joint deterioration. Moreover, there was no clear distinction in DCMs between male and female talus bones. Additional male and female subjects will be investigated in the future study to confirm this finding. We did not explore patient particulars such as race or occupation, or other factors that might affect bone development. Although we do not expect factors like that to affect symmetry within an individual, it could be investigated, with a specific study directed to the characteristic of interest.
Left-right symmetry analysis of bones is important for implant design, mechanical testing, and for using the contralateral bone as a control. Images of the contralateral talus bone have been used to design replacement prostheses for severely damaged talus bones in difficult cases. However, surgeons have not had any solid evidence that the two bones are symmetrical in 3D. Furthermore, it is unknown whether or not there are any mechanical complications related to using the contralateral bone, since no previous reports have been documented in this particular area. To the authors’ knowledge, this is the first study in the English language to compare left-right symmetry of the entire talus bone.
Conclusions
Based on this study, we conclude that left and right talus bones of intact human ankle joints show a strong degree of symmetry, and that the talus bones of the ankle joints can be categorised as matching symmetry as they are mirror images of one another. Volume varied by < 7.5% and maximum deviation was within ± 1mm for 90.67 ± 6.67% of the surface. In most of the cases, deviations larger than ± 1mm were not located on the articular surfaces. The results obtained from this study may have significant clinical importance for talus bone replacement surgery, where the geometric shape of the contralateral talus bone can be used as a control. 3D deviation analyses, and location of asymmetry in the geometric shape between left and right talus bone within the same subjects, may help orthopaedic surgeons to pre-operatively plan for complex talar fractures and design accurate and functional talus bone prostheses. The findings of the current research will be used in future studies to develop a geometrically engineered talus implant that will avoid mismatch during implant design.
1 Raviv D, Bronstein AM, Bronstein MM, Kimmel R. Symmetries of non-rigid shapes. In: IEEE 11th International Conference on Computer Vision, 2007. ICCV; 2007:1–7. doi:10.1109/ICCV.2007.4409181. Google Scholar
2 Mardia KV . Statistical assessment of bilateral symmetry of shapes. Biometrika2005;92:249–250. Google Scholar
3 Alterson R , PlewesDB. Bilateral symmetry analysis of breast MRI. Phys Med Biol2003;48:3431–3443.CrossrefPubMed Google Scholar
4 Huisinga-Fischer CE , SourenJPHJA, v d WerkenF, Prahl-AndersenB, van GinkelF. Perception of symmetry in the face. J Craniofac Surg2004;15:128–134.CrossrefPubMed Google Scholar
5 Mealey L , BridgstockR, TownsendGC. Symmetry and perceived facial attractiveness: a monozygotic co-twin comparison. J Pers Soc Psychol1999;76:151–158.CrossrefPubMed Google Scholar
6 Barker DS , SchultzC, KrishnanJ, HearnTC. Bilateral symmetry of the human metacarpal: implications for sample size calculations. Clin Biomech (Bristol, Avon)2005;20:846-52.CrossrefPubMed Google Scholar
7 Adams DJ , PedersenDR, BrandRA, RubinCT, BrownTD. Three-dimensional geometric and structural symmetry of the turkey ulna. J Orthop Res1995;13:690-9.CrossrefPubMed Google Scholar
8 Sumner DR , TurnerTM, GalanteJO. Symmetry of the canine femur: implications for experimental sample size requirements. J Orthop Res1988;6:758–765.CrossrefPubMed Google Scholar
9 Kuhn JL , GouletRW, PappasM, GoldsteinSA. Morphometric and anisotropic symmetries of the canine distal femur. J Orthop Res . 1990;8:776–780.CrossrefPubMed Google Scholar
10 Miller GJ , Purkey Jr. The geometric properties of paired human tibiae. J Biomech1980;13:1–8.CrossrefPubMed Google Scholar
11 Zhang KY , Wiktorowicz-ConroyA, HutchinsonJR, et al.3D Morphometric and posture study of felid scapulae using statistical shape modelling. PLoS ONE2012;7:34619.CrossrefPubMed Google Scholar
12 Parr WCH , WroeS, ChamoliU, et al.Toward integration of geometric morphometrics and computational biomechanics: new methods for 3D virtual reconstruction and quantitative analysis of Finite Element Models. J Theor Biol2012;301:1–14.CrossrefPubMed Google Scholar
13 Depecker M , BergeC, PeninX, RenousS. Geometric morphometrics of the shoulder girdle in extant turtles (Chelonii). J Anat2006;208:35–45.CrossrefPubMed Google Scholar
14 Parent S , LabelleH, SkalliW, de GuiseJ. Thoracic pedicle morphometry in vertebrae from scoliotic spines. Spine (Phila Pa 1976) . 2004;29:239–248.CrossrefPubMed Google Scholar
15 Stokes IA , ArmstrongJG, MorelandMS. Spinal deformity and back surface asymmetry in idiopathic scoliosis. J Orthop Res1988;6:129–137.CrossrefPubMed Google Scholar
16 Harnroongroj T , VanadurongwanV. The talar body prosthesis. J Bone Joint Surg [Am]1997;79-A:1313–1322.CrossrefPubMed Google Scholar
17 Taniguchi A , TakakuraY, SugimotoK, et al.The use of a ceramic talar body prosthesis in patients with aseptic necrosis of the talus. J Bone Joint Surg [Br]2012;94-B:1529–1533.CrossrefPubMed Google Scholar
18 Yasuhito Tanaka YT . Alumina Ceramic Talar Body Prosthesis for Idiopathic Aseptic Necrosis of the Talus. Key Eng Mat 2003805–808. Google Scholar
19 Stevens BW , DolanCM, AndersonJG, BukreyCD. Custom talar prosthesis after open talar extrusion in a pediatric patient. Foot Ankle Int2007;28:933–938.CrossrefPubMed Google Scholar
20 Magnan B , FacciE, BartolozziP. Traumatic Loss of the Talus Treated with a Talar Body Prosthesis and Total Ankle Arthroplasty: a Case Report. J Bone Joint Surg [Am]2004;86-A:1778–1782. Google Scholar
21 Parr WCH , RutoA, SoligoC, ChatterjeeHJ. Allometric shape vector projection: a new method for the identification of allometric shape characters and trajectories applied to the human astragalus (talus). J Theor Biol2011;272:64–71.CrossrefPubMed Google Scholar
22 Parr WCH , ChatterjeeHJ, SoligoC. Inter- and intra-specific scaling of articular surface areas in the hominoid talus. J Anat2011;218:386–401.CrossrefPubMed Google Scholar
23 Yang YM , and RueckertD, BullAMJ. Predicting the shapes of bones at a joint: application to the shoulder. Comput Methods Biomech Biomed Engin . 2008;11:19–30.CrossrefPubMed Google Scholar
24 Komeili A, Westover L, Parent E, et al. Surface Topography asymmetry maps categorizing external deformity in scoliosis. Spine J 2013 S1529-9430(13)01572-6. Google Scholar
25 Zhao H , HermanB, AdeebS, ShepsD, El-RichM. Investigation of the geometries of the coronoid process and the fibular allograft as a potential surgical replacement. Clin Biomech2013;28:626–634.CrossrefPubMed Google Scholar
26 Moody ML , KoenemanJ, HettingerE, KarpmanRR. The Effect of Fibular and Talar Displacement on Joint Contact Areas About the Ankle. Orthop Rev1992;21:741–744. Google Scholar
Funding statement:
This study was funded by the University of Alberta Hospital Foundation, Natural Sciences and Engineering Research Council (NSERC) and Edmonton Orthopaedic Research Committee
Author contributions:
K. Islam: Study design, Data collection, Data analysis, Writing the paper
A. Dobbe: Review of data analysis, Writing the paper
A. Komeili: Data analysis, Review of paper
K. Duke: Experimental design, Statistical analysis, Review of paper
M. El-Rich: Data analysis, Review of paper
S. Dhillon: Collection and imaging review of case material, Review of paper
S. Adeeb: Study design, Data analysis, Writing the paper
N. M. Jomha: Study design, Data analysis, Review of paper
ICMJE Conflict of Interest:
None declared
©2014 The British Editorial Society of Bone & Joint Surgery. This is an open-access article distributed under the terms of the Creative Commons Attributions licence, which permits unrestricted use, distribution, and reproduction in any medium, but not for commercial gain, provided the original author and source are credited.
Supplementary material. The equation used to calculate left-right comparisons of SA and BV of the talus bones, is available with the online version of this article www.bjr.boneandjoint.org.uk
