


Abstract
Objectives
To quantify and compare peri-acetabular bone mineral density (BMD) between a monoblock acetabular component using a metal-on-metal (MoM) bearing and a modular titanium shell with a polyethylene (PE) insert. The secondary outcome was to measure patient-reported clinical function.
Methods
A total of 50 patients (25 per group) were randomised to MoM or metal-on-polyethlene (MoP). There were 27 women (11 MoM) and 23 men (14 MoM) with a mean age of 61.6 years (47.7 to 73.2). Measurements of peri-prosthetic acetabular and contralateral hip (covariate) BMD were performed at baseline and at one and two years’ follow-up. The Western Ontario and McMaster Universities osteoarthritis index (WOMAC), University of California, Los Angeles (UCLA) activity score, Harris hip score, and RAND-36 were also completed at these intervals.
Results
At two years, only zone 1 showed a loss in BMD (-2.5%) in MoM group compared with a gain in the MoP group (+2.2%). Zone 2 showed loss in both groups (-2.2% for MoM; -3.9% for MoP) and zones 3 and 4 a gain in both groups (+0.1% for MoM; +3.3% for MoP). No other between-group differences were detected. When adjusting for BMD of the contralateral hip, no differences in BMD were observed. The only significant differences in functional scores at two years were higher UCLA activity (7.3 (sd 1.2) vs 6.1 (sd 1.5); p = 0.01) and RAND-36 physical function (82.1 (sd 13.0) vs 64.5 (sd 26.4); p = 0.02) for MoM bearings versus MoP. One revision was performed in the MoM group, for aseptic acetabular loosening at 11 months.
Conclusions
When controlling for systemic BMD, there were no significant differences between MoM and MoP groups in peri-acetabular BMD. However, increasing reports of adverse tissue reactions with large head MoM THR have restricted the use of the monoblock acetabular component to resurfacing only.
Article focus
Is acetabular bone remodelling different between modular block metal shells and modular titanium shells with polyethylene insert?
Key messages
There is no significant difference in bone mineral density at minimum two-year follow-up between monoblock acetabular shells and modular titanium shells
Strengths and limitations of this study
Strengths: randomised clinical trial with objective endpoint using bone mineral density
Weaknesses: relatively small number of patients in each group
Introduction
Metal femoral heads of 28 mm and 32 mm diameter articulating with polyethylene are the gold standard in total hip replacement (THR).1,2 Having said that, the use of larger femoral heads offers greater stability and may provide more natural joint kinematics.3 As volumetric wear increases with larger head size with metal-on-polyethylene (MoP) bearings,4 metal-on-metal (MoM) has been proposed as an alternative due to its theoretical lower wear, regardless of head size.5 In addition, due to a thinner monoblock acetabular shell, MoM bearings also address the limitations of polyethylene thickness for larger head sizes. However, the use of a more rigid cobalt–chrome acetabular component introduces the possibility of stress-shielding, with associated peri-acetabular bone loss.6-8 Peri-prosthetic bone loss is of interest because of its potential impact on fixation of the component, risk of peri-prosthetic fractures and complicating revision surgery.9-12
The primary goal of this preliminary report was to quantify BMD on the acetabular side with a large-head MoM bearing and compare it with that of a standard MoP bearing in primary THR. Our hypothesis was that a more rigid cobalt–chrome monoblock acetabular component in MoM THR would demonstrate decreased peri-acetabular BMD compared with a modular acetabular component made of titanium. The secondary goal was to measure and compare the patient-reported outcomes (including pain, function and activity level).
Patients and Methods
Recruitment for this study took place between July 2007 and May 2010 at our institution (The Ottawa Hospital, Ottawa, Canada). Ethical approval was obtained from our institutional research ethics board, and the trial is registered on www.clinicaltrials.gov (NCT00911599). Inclusion criteria were any patient between 45 and 75 years of age undergoing primary THR for non-inflammatory degenerative joint disease, including osteo-/degenerative arthritis, traumatic arthritis, congenital hip dysplasia and avascular necrosis. Exclusion criteria included patients with previous arthrodesis of the hip, previous Girdlestone procedure, acute fracture of the femoral neck, above-knee amputations, significant knee arthritis (including previous total knee replacement), evidence of active infection, neurological or musculoskeletal disease that may adversely affect gait or weight-bearing, previous ipsilateral hemi-/total resurfacing, uni-/bipolar arthroplasty or THR. Patients with neuropathic joints, a requirement for structural bone grafts, severe documented psychiatric disease or a documented allergy to cobalt chromium molybdenum were also excluded from participation. A total of 57 patients were assessed for eligibility, with three not meeting inclusion criteria, three declining to participate and one excluded for other reasons (Fig. 1).
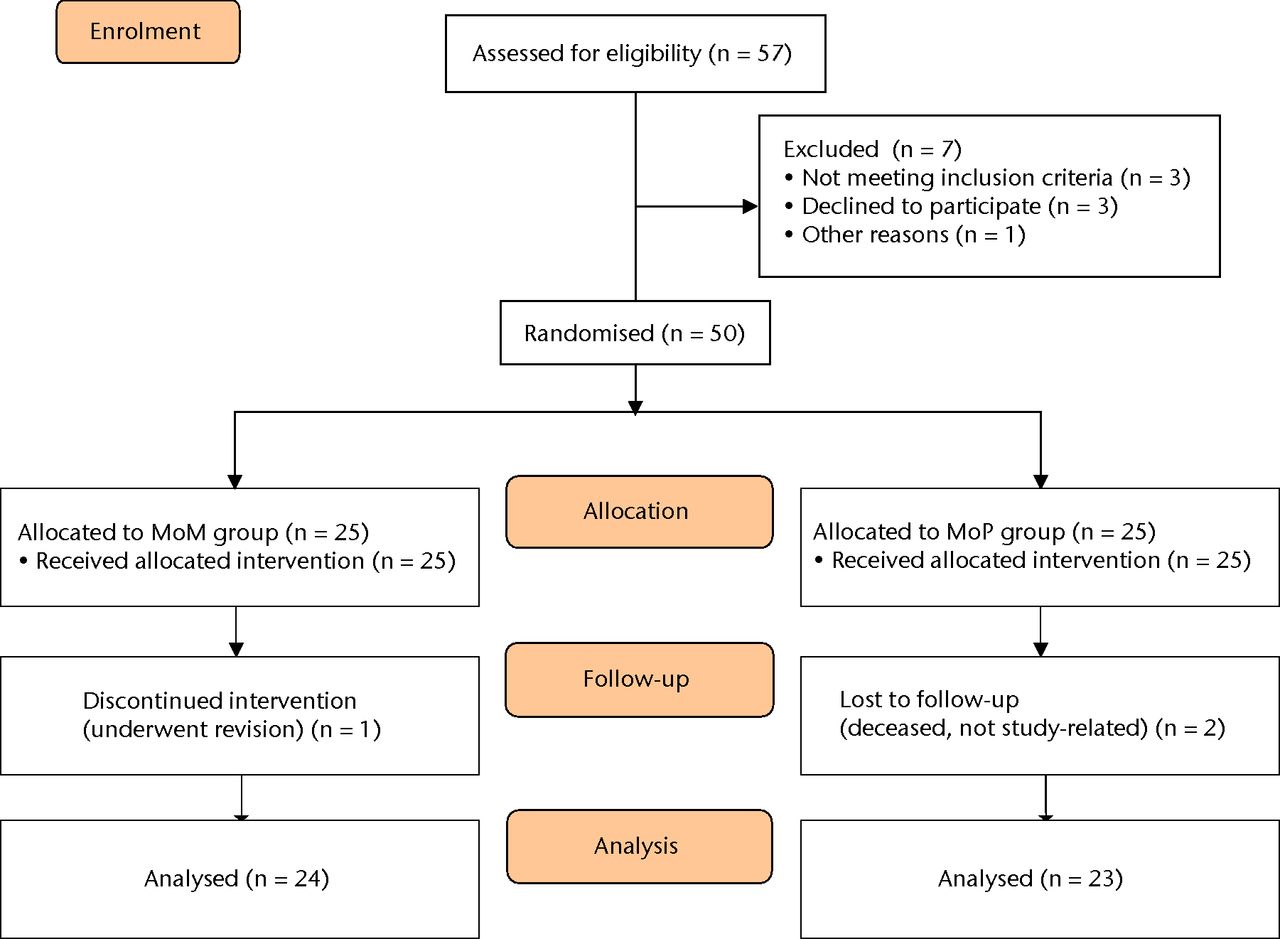
Fig. 1
Patient flow diagram.
A total of 50 patients (25 per group) were randomised to receive THR with either: a) a large femoral head with MoM bearing within a monoblock acetabular component; or b) a cobalt–chrome femoral head with polyethylene insert (MoP) within a titanium shell. Patients were randomised in blocks of ten to one of the two treatment groups using a web-based randomisation program (www.randomization.com). Group assignment was revealed to the surgeon and theatre staff immediately before each case in order to ensure appropriate implants were present. The MoM group comprised 14 males and 11 females, with a mean age of 60.2 years (sd 7.2), and a mean body mass index (BMI) of 30.8 kg/m2 (sd 5.6). The MoP group contained nine males and 16 females, with a mean age of 60.2 years (sd 7.2), and a mean BMI of 29.2 kg/m2 (sd 5.0). No differences in age (p = 0.12), gender (p = 0.26), or BMI (p = 0.29) were present between groups (Table I). The median head size for the MoM was 46 mm (interquartile range (IQR) 44 to 49) and for MoP was 32 mm (IQR 28 to 32). The median acetabular component size in the MoM group was 54 mm (IQR 52 to 56) and 52 mm (IQR 50 to 54) in the MoP group. One patient in the MoM group was excluded from the final analysis due to undergoing revision at one year post-operatively and two patients were excluded from the MoP group (both deceased for reasons unrelated to study) (Fig. 1).13
Table I
Patient baseline demographics and surgical variables
| Variable | MoM (n = 25) | MoP (n = 25) | p-value |
|---|---|---|---|
| Mean (sd) age (yrs) | 60.2 (7.2) | 63.0 (5.5) | 0.12* |
| Male (n, %) | 14 (56) | 9 (36) | 0.26† |
| Mean (sd) body mass index (kg/m2) | 30.8 (5.6) | 29.2 (5.0) | 0.29* |
| Left side operated (n, %) | 11 (44) | 8 (32) | 0.56† |
| Surgeon (n, %) | |||
| 1 | 18 (72) | 17 (68) | |
| 2 | 3 (12) | 3 (12) | |
| 3 | 3 (12) | 3 (12) | |
| 4 | 1 (4) | 2 (8) | |
| Surgical approach (n, %) | |||
| Anterior | 14 (56) | 13 (52) | |
| Lateral | 6 (24) | 8 (32) | |
| Posterolateral | 5 (20) | 4 (16) | |
-
* independent samples t-test † chi-squared test
The MoM components used in the study were the CONSERVE A-Class Total Hip System with Big Femoral Head (BFH) technology (Wright Medical Technology, Memphis, Tennessee). The BFH system uses a monoblock acetabular component (6 mm or 10 mm outside diameter), made of high-carbon cast alloy conforming to the ASTM F-75 standard,14 with a cobalt–chromium–molybdenum (CoCrMo) porous beaded surface. The acetabular component undergoes two heat treatment regimes before final machining and polishing. Hot isostatic pressing is performed to eliminate tiny voids left in the castings during the cooling process. Solution annealing is done for the dissolution of large blocky carbides into the matrix. The large femoral head (36 mm to 54 mm; CONSERVE A-Class) is made of a wrought CoCrMo alloy giving a differential hardness bearing. The head has an open design with no modular sleeve and three different neck lengths.
The MoP components were the Lineage acetabular system with a highly cross-linked polyethylene liner (Wright Medical Technology). The titanium shell has a plasma-sprayed titanium surface. The femoral side used was the Profemur TL (Wright Medical Technology) with neck modularity in both groups. Both femoral component and modular neck are made of titanium–vanadium alloy with the stem having a proximal plasma-spray coating.
All study patients received the component to which they were randomised. The surgical procedures were carried out by four arthroplasty surgeons (PEB, RF, PK, PT) using three different surgical approaches: anterior, lateral and posterior (Table I).
The post-operative protocol comprised weight-bearing as tolerated and physiotherapist-based inpatient then outpatient exercise programmes. Precautions depended on approach, consisting of either anterior hip precaution with no hip extension beyond 0°in combination with external rotation for six weeks, or no posterior hip precautions consisting of no hip flexion beyond 90° in combination with internal rotation/adduction for six weeks. Patients were evaluated by the treating surgeon as per standard clinical practice at six weeks and three, six, 12 and 24 months post-operatively.
For our primary outcome BMD was measured via dual-energy X-ray absorptiometry (DEXA) (GE Lunar Prodigy Advance; GE Lunar, Madison, Wisconsin) in four regions of interest (ROI) of the peri-acetabular area.15,16 These ROI aim to create simple rectangular ROI which contained only areas of predicted bone loss or bone gain. The medial and lateral borders of the regions are created by two vertical lines; one projected along the medial border of the obturator foramen, and the other along the lateral border of the femoral prosthesis. The superior limit of region 1 was defined by a horizontal line lying 30 pixels superiorly from a horizontal line touching the top border of the acetabular component, which defined its lower limit. Region 2 extended from here to a horizontal line bisecting the centre of the acetabular component, and region 3 extended from there to the lower border of the acetabular component. Region 4 extended from the line marking the lower border of the acetabular component to a further line lying 30 pixels below that (Fig. 2a). BMD was measured at ten to 14 days post-operatively (baseline) and at one and two years post-operatively. BMD was also measured in the contralateral hip as an internal control (Fig. 2b). Reporting on the in vivo precision of the BMD measurements, Wilkinson et al16 reported the coefficient of variation for the four ROI of 2.5% to 4.8%.
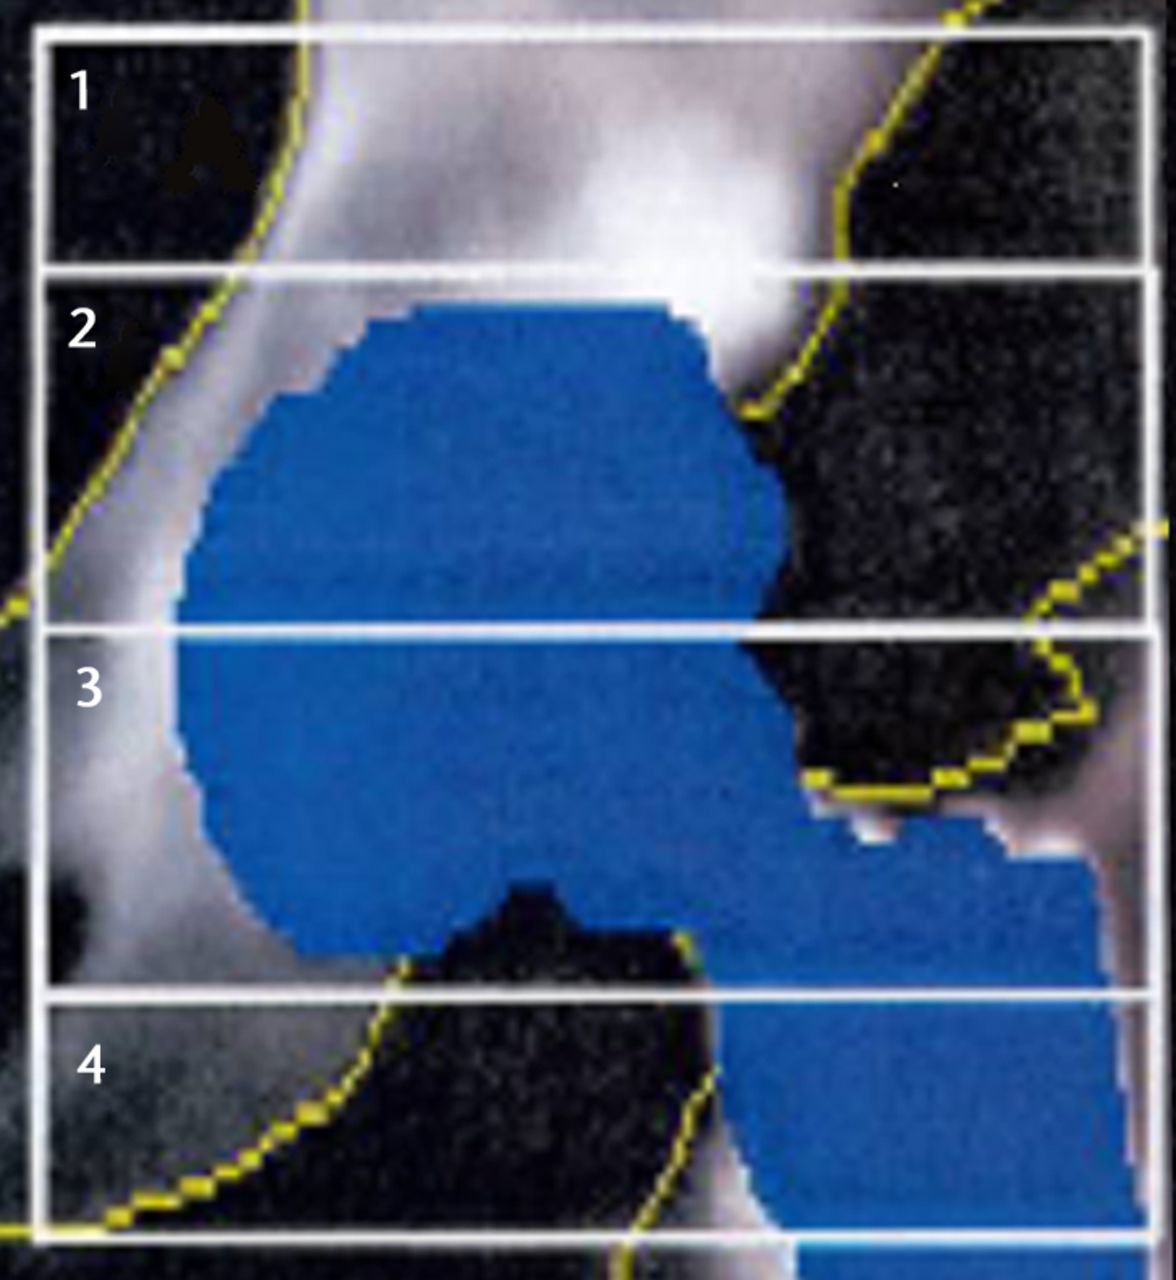
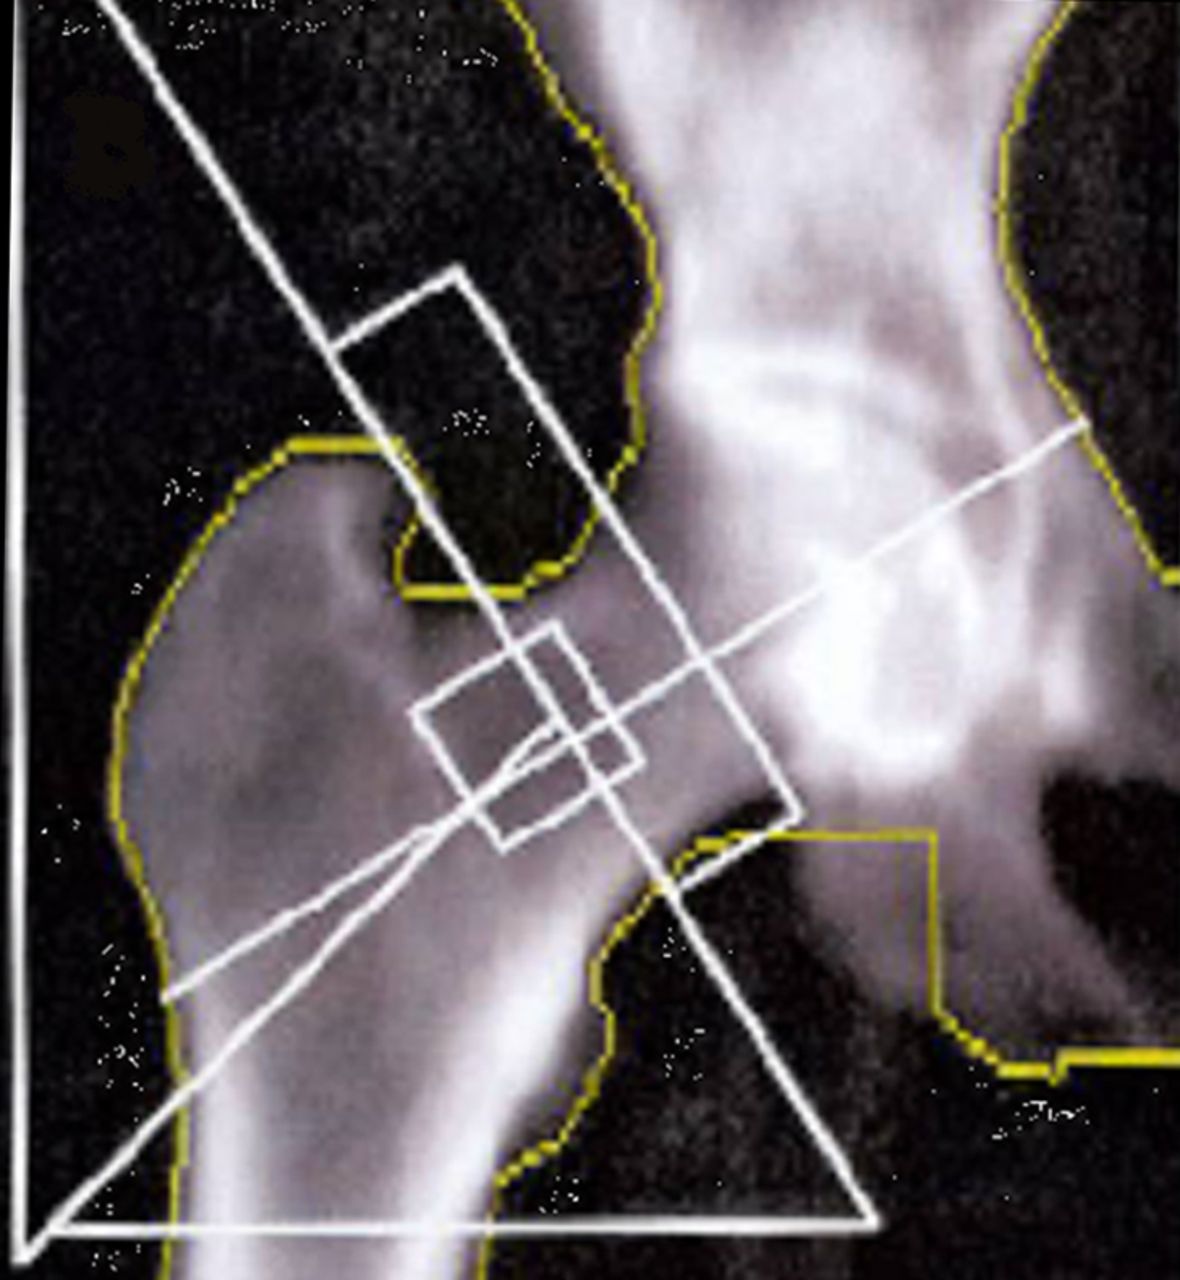
Figs. 2a - 2b
Images showing the regions of interest for the assessment of bone mineral density in a) the affected hip and b) the contralateral hip.
As secondary outcomes, patients filled out the University of California, Los Angeles (UCLA) activity scale,17 Western Ontario and McMaster Universities osteoarthritis index (WOMAC),18 the Harris hip score (HHS)19 and the RAND-36 Item Health Survey20 at each time interval.
Statistical analysis
At the time of the formulation of this study, there were no longitudinal studies of BMD measurements in the peri-acetabular area after total hip replacement, so no a priori power analysis was done. Post-hoc power analysis is described in the results section. Independent samples t-tests were used to compare BMD levels between study groups at baseline, and at one and two years. In order to control for potential systemic changes in BMD, data were also analysed using the contralateral overall hip BMD as a covariate both by using analysis of covariance (ANCOVA) and also by assigning the value in each of the peri-prosthetic regions of interest at each given time point as its percentage difference from the contralateral side.21 Independent samples t-tests or Mann–Whitney U tests (according to data normality, as verified by the Shapiro–Wilk test) were used to compare the outcome scores between groups. Paired t-tests were used to assess within-group score changes. All analyses were completed using SPSS version 17.0 (SPSS Inc., Chicago, Illinois), with the level of significance set at α = 0.05.
Results
Compared with baseline values, the MoM group at the two-year interval had experienced decreases in mean peri-acetabular BMD in zones 1 (-2.5%, p = 0.06) and 2 (-2.2%, p = 0.21). Increases were observed in zones 3 (+4.8%, p = 0.61) and 4 (+0.1%, p = 0.58) (Table II). The MoP group experienced increases in peri-acetabular BMD in zones 1 (+2.2%, p = 0.59), 3 (+7.6%, p = 0.24) and 4 (+3.3%, p = 0.32), and a decrease in zone 2 (-3.9%, p = 0.19). The BMD in contralateral hip decreased in both groups: -0.2% (p = 0.57) in the MoM and -1.3% (p = 0.03) for MoP (Table II). Table III provides the mean BMD values for each of the zones at the varying time intervals as well as for the contralateral hip. When adjusting for changes in the contralateral hip, there was no difference between the two groups with regards to mean BMD.
Table II
Bone mineral density (BMD) in acetabular zones 1 to 4 and the total contralateral hip at one and two years (CI, confidence interval; MoM, metal-on-metal; MoP, metal-on-polyethylene)
| Mean BMD as percentage of baseline (95% CI) | ||||
|---|---|---|---|---|
| Acetabular zone | MoM | MoP | p-value | |
| Zone 1 | ||||
| One year | 94.4 (90.0 to 98.8) | 99.4 (93.1 to 105.7) | 0.17 | |
| Two year | 97.5 (93.7 to 101.3) | 102.2 (95.6 to 108.8) | 0.19 | |
| p-value | 0.06 | 0.59 | ||
| Zone 2 | ||||
| One year | 94.3 (87.6 to 101.0) | 100.7 (90.9 to 110.5) | 0.26 | |
| Two year | 97.8 (92.4 to 103.2) | 96.1 (87.5 to 104.7) | 0.73 | |
| p-value | 0.21 | 0.19 | ||
| Zone 3 | ||||
| One year | 102.7 (95.9 to 109.5) | 104.4 (97.4 to 111.4) | 0.71 | |
| Two year | 104.8 (97.1 to 112.5) | 107.6 (97.6 to 117.6) | 0.64 | |
| p-value | 0.61 | 0.24 | ||
| Zone 4 | ||||
| One year | 99.1 (94.2 to 104.0) | 99.7 (92.5 to 106.9) | 0.88 | |
| Two year | 100.1 (94.3 to 105.9) | 103.3 (95.9 to 110.7) | 0.49 | |
| p-value | 0.58 | 0.32 | ||
| Contralateral | ||||
| One year | 100.3 (99.3 to 101.3) | 99.1 (97.9 to 100.3) | 0.09 | |
| Two year | 99.8 (98.4 to 101.2) | 98.7 (97.5 to 99.9) | 0.22 | |
| p-value | 0.57 | 0.03 | ||
Table III
Bone mineral density (BMD) in the groups (MoM, metal-on-metal; MoP, metal-on-polyethylene)
| Mean (sd) BMD (g/cm2) | p-values | ||||
|---|---|---|---|---|---|
| Acetabular zone | MoM | MoP | t-test | ANCOVA* | |
| Baseline | |||||
| Zone 1 | 1.68 (0.40) | 1.66 (0.35) | 0.87 | 0.34 | |
| Zone 2 | 1.52 (0.35) | 1.36 (0.36) | 0.14 | 0.38 | |
| Zone 3 | 1.14 (0.36) | 1.03 (0.30) | 0.30 | 0.66 | |
| Zone 4 | 1.00 (0.28) | 0.90 (0.20) | 0.20 | 0.57 | |
| Contralateral | 1.06 (0.18) | 0.98 (0.15) | 0.14 | n/a | |
| One year | |||||
| Zone 1 | 1.56 (0.35) | 1.51 (0.29) | 0.62 | 0.58 | |
| Zone 2 | 1.39 (0.31) | 1.24 (0.32) | 0.12 | 0.22 | |
| Zone 3 | 1.13 (0.35) | 0.99 (0.22) | 0.12 | 0.33 | |
| Zone 4 | 0.97 (0.26) | 0.84 (0.25) | 0.11 | 0.84 | |
| Contralateral | 1.04 (0.14) | 0.95 (0.15) | 0.06 | n/a | |
| Two years | |||||
| Zone 1 | 1.65 (0.35) | 1.60 (0.38) | 0.62 | 0.20 | |
| Zone 2 | 1.49 (0.30) | 1.23 (0.36) | 0.01 | 0.08 | |
| Zone 3 | 1.17 (0.28) | 1.05 (0.31) | 0.17 | 0.57 | |
| Zone 4 | 0.99 (0.25) | 0.88 (0.28) | 0.16 | 0.93 | |
| Contralateral | 1.05 (0.16) | 0.96 (0.15) | 0.06 | n/a | |
-
* ANCOVA, analysis of covariance (using contralateral BMD as covariate)
Both patient groups exhibited significant improvements in all outcome scores (p < 0.01) from baseline at one and two years, with no differences between groups at baseline or at the one-year follow-up (Figs 3a and 3b). At the two-year follow-up, the mean UCLA activity score (7.3 (sd 1.2) vs 6.1 (sd 1.5); p = 0.01) and RAND-36 Physical Function (82.1 (sd 13.0) vs 64.5 (sd 26.4); p = 0.02) were significantly greater in the MoM group compared with the MoP group (Figs 3c and 3d). There were no statistically significant correlations between BMD and functional scores. One revision was required at 11months post-operatively in the MoM group, due to aseptic loosening of the acetabular component.
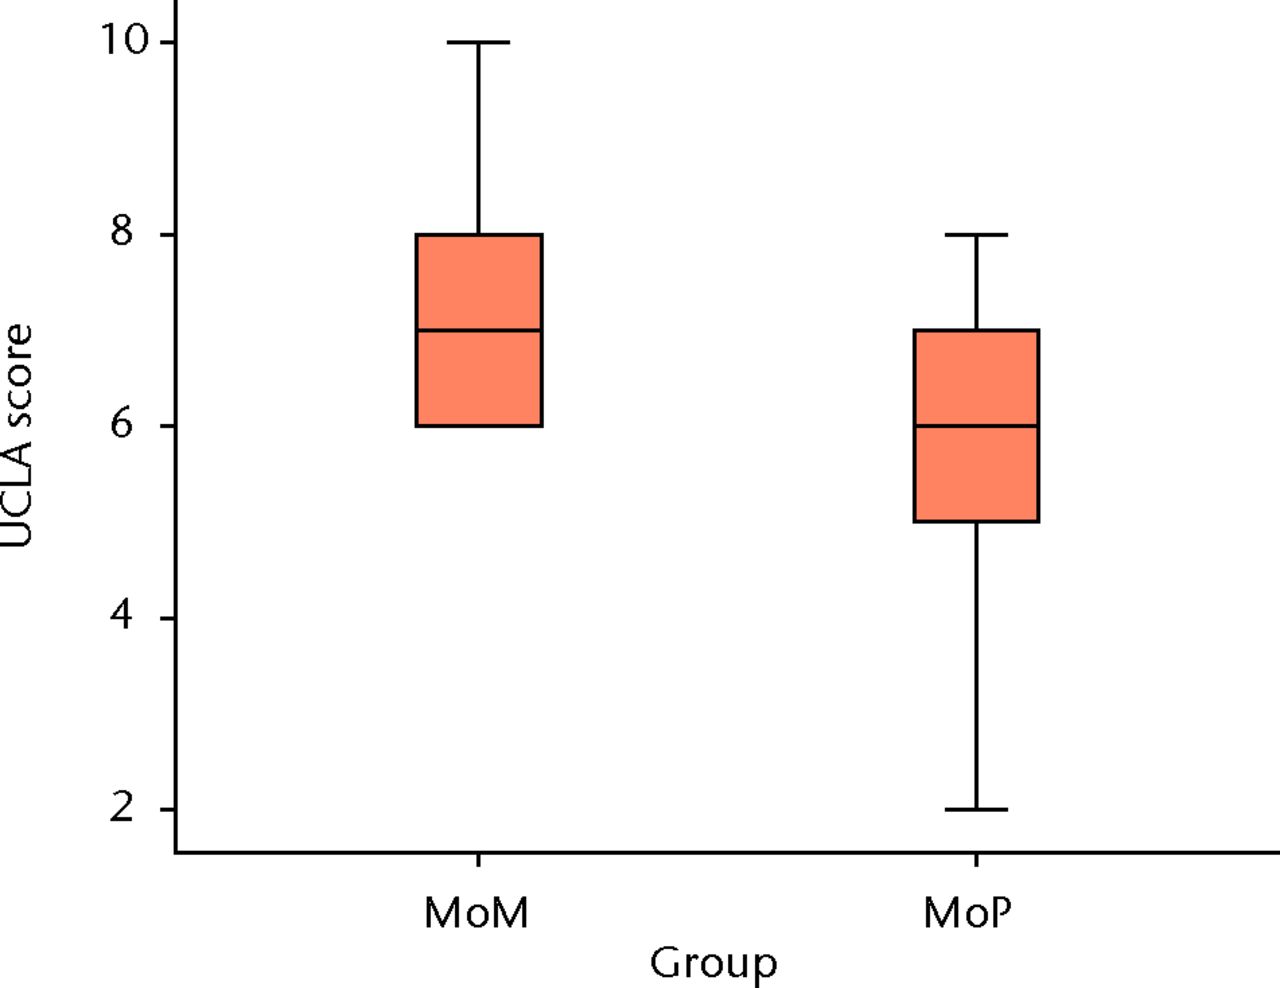
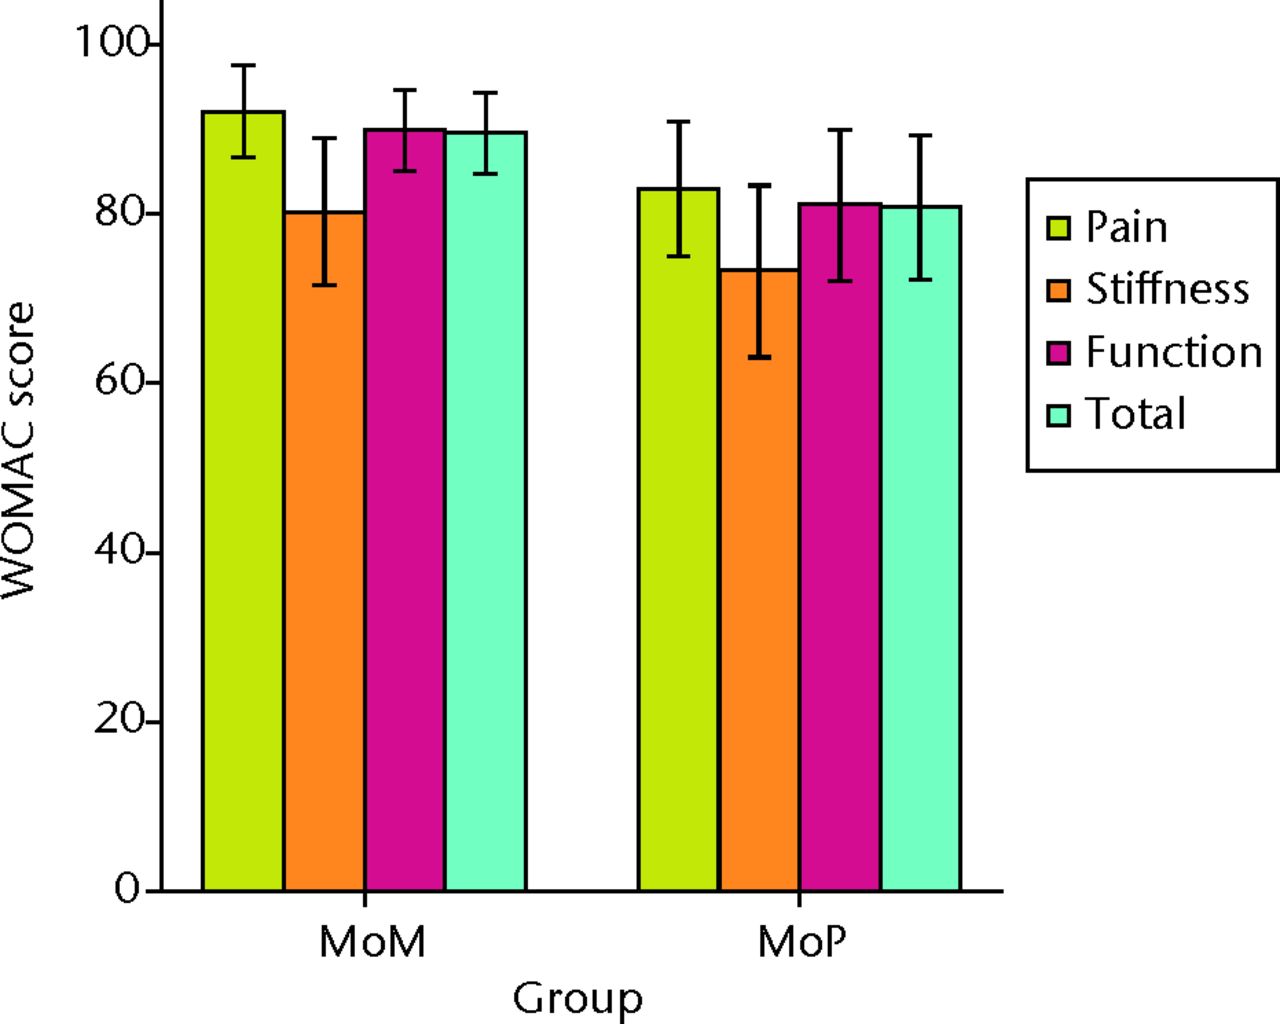
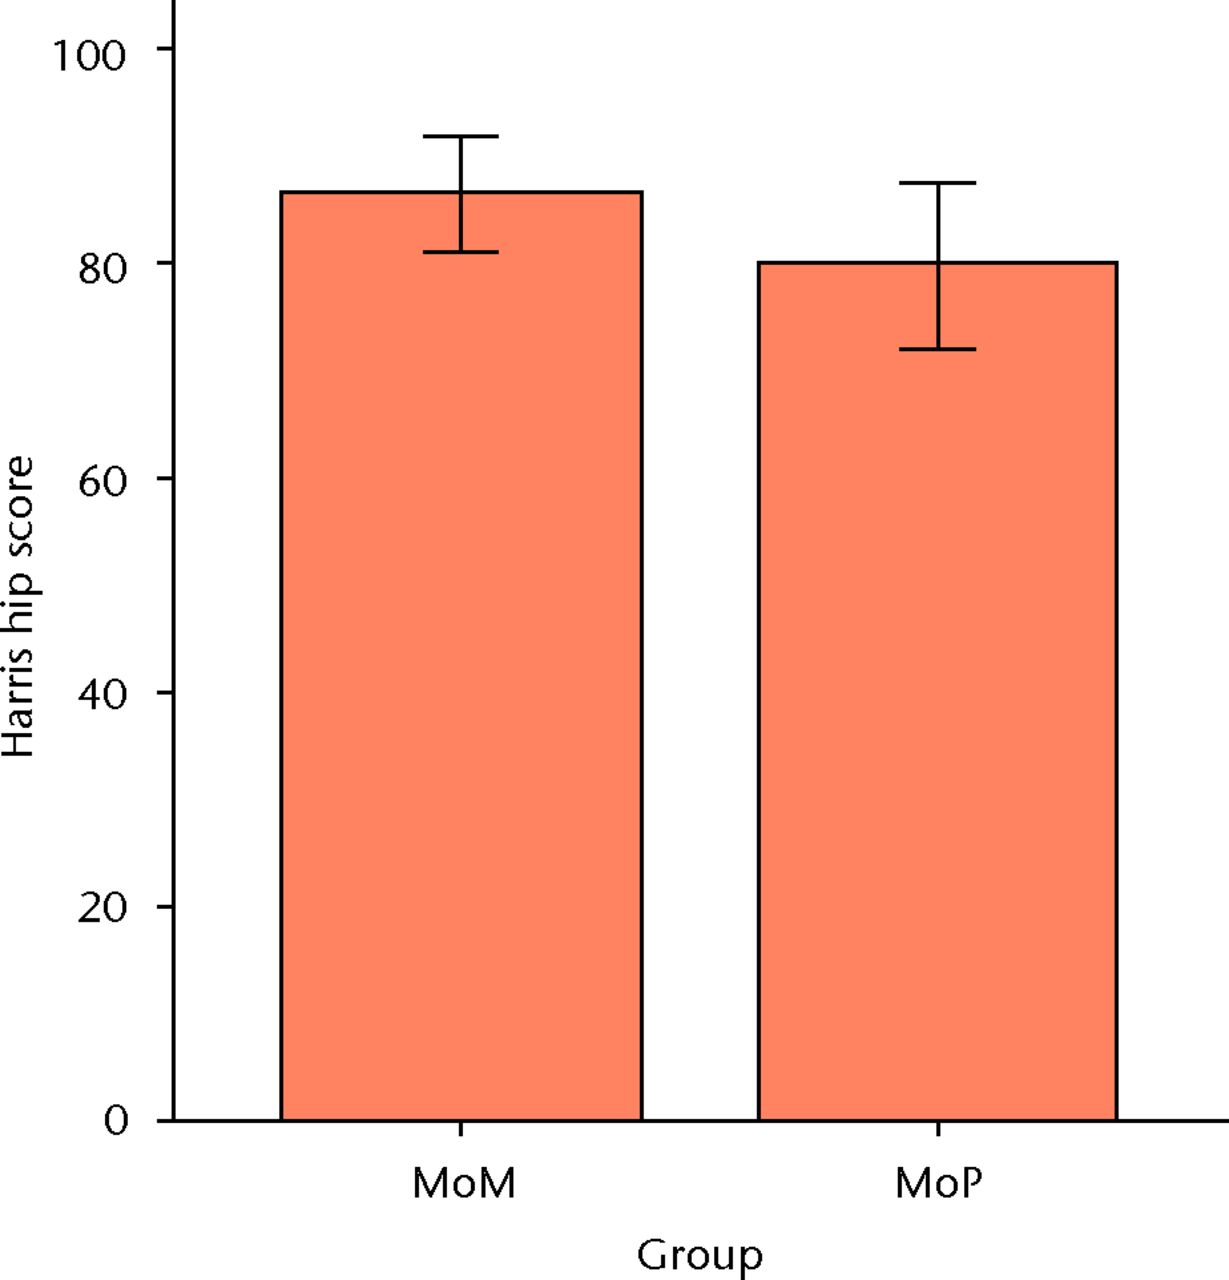
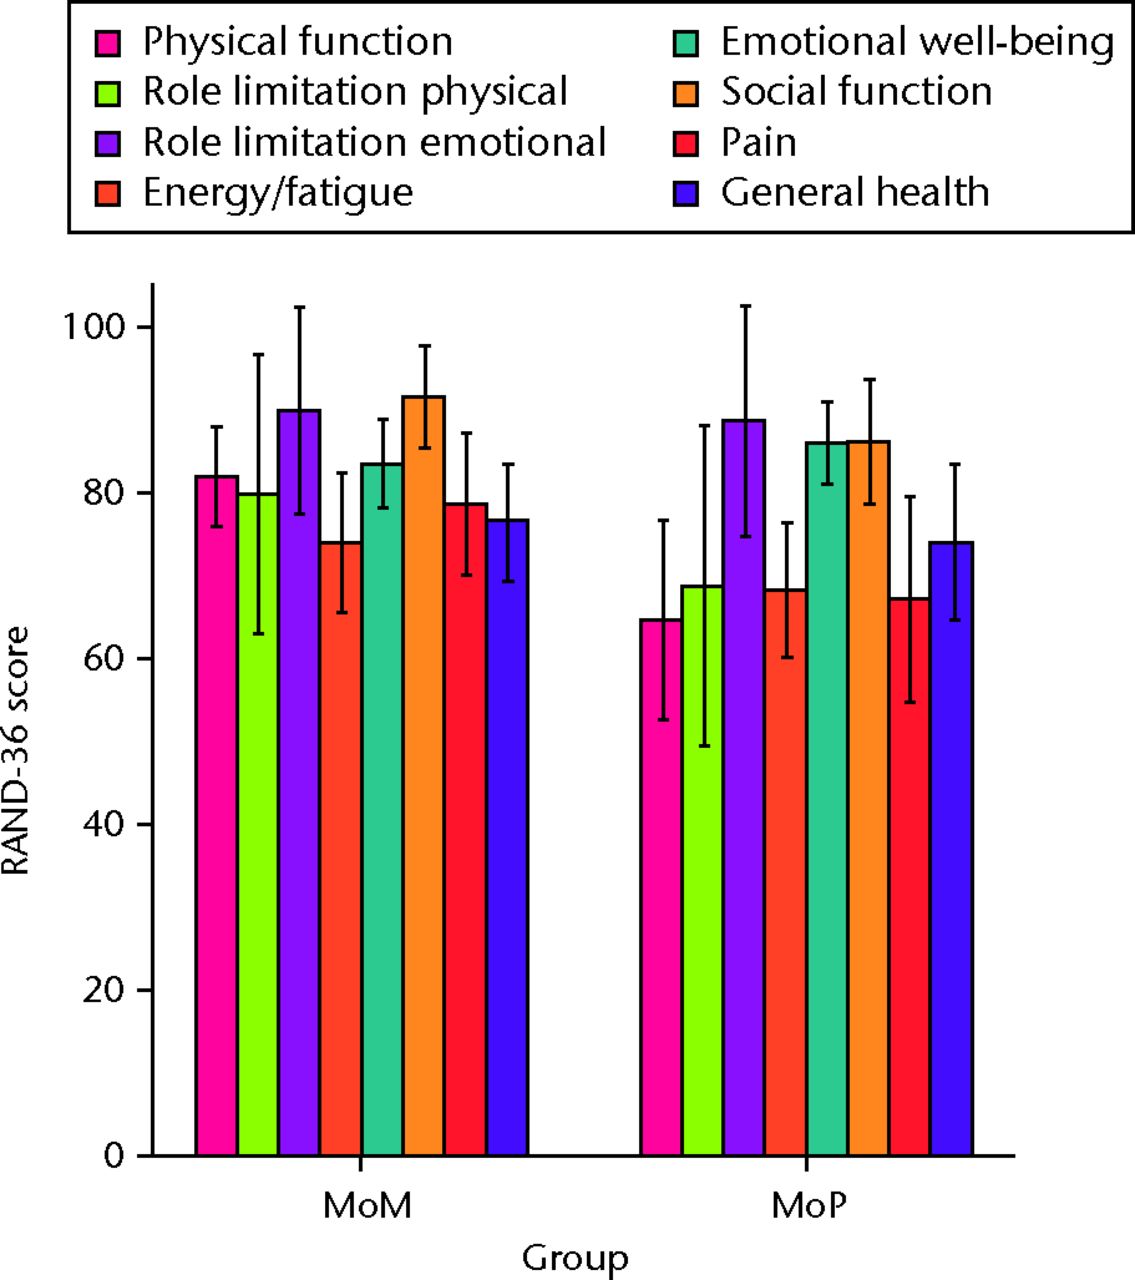
Figs. 3a - 3d
Graphs showing the outcome at two years in the metal-on-metal (MoM) and metal-on-polyethylene (MoP) groups. Figure 3a – boxplots showing the mean University of California, Los Angeles (UCLA) activity score. The boxes represent the mean and interquartile range (IQR) and the whiskers denote the range of data. Figure 3b – histogram showing the mean Western Ontario and McMaster Universities (WOMAC) osteoarthritis index by total score and subscore. The error bars denote the standard deviation. Figure 3c – boxplots showing the mean Harris hip score. The boxes represent the mean and IQR and the whiskers denote the range of data. Figure 3d – histogram showing the mean RAND-36 score by different parameter. The error bars denote the standard deviation.
As a product of the small changes and between-group differences that we observed in peri-acetabular BMD, a post hoc power analysis shows our study to be underpowered to avoid a type II error.
Discussion
In order to avoid excessive bone removal, monoblock CoCr acetabular components were developed to allow the use of large femoral head sizes in both primary THR and hip resurfacing.22 This represents a significant change in practice compared with titanium modular acetabular shells with PE inserts, with titanium having a lower modulus of elasticity and better osteointegration properties than cobalt–chrome.23 The more rigid acetabular components used with large femoral head MoM THRs may increase the risk of stress shielding and associated acetabular bone loss, potentially affecting both short and long-term fixation as well as bone stock available at the time of revision surgery.24 Consequently, we sought to compare peri-acetabular BMD as well as functional outcomes between a CoCr monoblock acetabular component in MoM THR with that of a modular titanium shell with a polyethylene insert.
Our study has several limitations, the most important being the insufficient number of patients recruited in each group to avoid a type-II error (stating no difference when there is one between the two groups). More importantly the wide confidence intervals in the majority of the zones – some close to 20% – would make recruitment of sufficient numbers difficult. As mentioned in the Methods section, there were no existing clinical data on long-term BMD changes in the peri-acetabular bone after THR at the time of study development, nor on what changes would be considered clinically significant. More importantly, the mounting concerns regarding metal ion release as well as early high failure rates of large-head MoM25,26 made continued recruitment unjustifiable. Having said that, our study provides baseline data that can be used for future clinical trials studying peri-acetabular BMD after THR. In addition, by using the contralateral hip as an internal control for each patient, we were able to adjust for normal physiological changes in BMD permitting a more accurate assessment of peri-acetabular bone changes.
A second limitation is the use of DEXA, which has been the gold standard for densitometry studies,27-29 with a reported level of agreement between two measurements of -7% to 7%.29 It is limited in regards to assessing the retro-acetabular or bone posterior to the implant due its two-dimensional nature. In order to address this, some have advocated the use CT densitometry to refine the ability to assess BMD by judging the true volumetric rather than area-based density, and also differentiate cortical from cancellous changes.7 Although this technique is more precise, it is more time-consuming and requires specialised expertise. Consequently, only a limited number of studies have used this technique.7
The patterns of bone remodelling were quite similar for both groups in terms of gain versus loss of BMD, except in zone 1 where in the MoM group there was a loss of 2.5% compared with a gain of 2.2% in the MoP group. For zone 2 there was a loss in both groups (2.2% and 3.9% for MoM and MoP, respectively) and for zones 3 and 4 there was a gain (MoM: 4.8% and 0.1%, respectively; MoP: 7.6% and 3.3%, respectively). Although not significant after adjusting for BMD changes in the contralateral limb, there was a trend for greater bone loss in zone 2 in MoP compared with MoM.
In a recent study using the same zones of Wilkinson et al16 and comparing hip resurfacing with THR, Penny et al29 found an overall loss of BMD of 3.8% and 2.4% for the resurfacing and total hip groups, respectively. The greatest bone loss in both groups was in zone 2, with resurfacing having a mean loss of 10.2% and THR having a mean loss of 9.1%, whereas minor gains were noted in zone 4 (0.4% in resurfacing and 3.5% in THR). As both our study and that of Penny et al29 compared a monoblock acetabular component with a modular MoP titanium shell, it would appear that at short-term follow-up the use of a more rigid acetabular component leads to comparable changes to the gold standard of MoP within a titanium shell, except in zone 1. This difference in BMD change (loss for MoM and gain for MoP) in zone 1 may be due to the actual stress shielding or lack of load transfer to that area as a result of the increased rigidity of the CoCr shell. Although the clinical significance of 2.5% loss of BMD is lacking, the trend of loss is in contrast to the gain seen in MoP group. In a longer term follow-up study comparing an alumina-on-alumina bearing and alumina-on-polyethylene bearing within a titanium shell, Kim et al27 found that although both groups demonstrated bone loss at one and two years in all three DeLee and Charnley zones,30these returned to baseline values at four and five years in zones 1 and 3 but persisted in zone 2, with no significant differences between the two groups. As the DeLee and Charnley30 and Wilkinson16 zones do not exactly correspond to the same anatomical regions, it is difficult to extrapolate these findings to our study regarding long-term trends in BMD changes. In another long-term BMD study using quantitative CT, comparing cementless acetabular components made of different core materials (titanium versus tantalum), Meneghini et al21 found significantly less bone loss with the more flexible tantalum implant in the posterosuperior region of the peri-acetabular area. More importantly, when using the contralateral hip as a control they were able to demonstrate a gain in bone mass in the anterosuperior peri-acetabular area of between 5.3% and 41.0% in the tantalum group compared with 11% to 44.7% loss in the titanium group. This study, as well as ours, supports the concentration of the loads in the periphery of cementless acetabular components producing shielding of the proximal and medial trabecular load.31,32 Another potential variable influencing peri-acetabular bone remodelling is the quality of the initial osteointegration of the implant with titanium being superior to a CoCr interface,21,33 making it difficult to decipher the exact role of implant rigidity. Manley et al34 used a three-dimensional (3D) model to investigate the role of implant material stiffness as well as design, and found that hemispherical acetabular components inevitably lead to bone loss independent of implant material, with a horse-shoe design providing a significant advantage in maintaining peri-acetabular bone mass.
With regard to clinical function, the only noted significant difference was higher UCLA activity score (7.3 versus 6.1) and RAND-36 Physical function (82.1 versus 64.5) in the MoM group compared with MoP. The larger head size may have provided a greater sense of confidence to the patients in performing their activities. The reason for this may be patient bias as well as better stability and/or better hip kinematics achieved with a larger femoral head side.35 Having said that, the use of MoM bearings in THR has been questioned due to the poor initial fixation of the monoblock acetabular component,36 higher levels of metal ion release compared with hip resurfacing37 and 28 mm/32 mm MoM bearings.38 Our overall clinical experience with the use of large-head MoM was poor with a 10% failure rate at just under three years,39 with the majority of failures secondary to aseptic loosening of the acetabular component. Currently, our only indication for the use of these monoblock shells is for resurfacing of the hip.
We found the overall magnitude of BMD changes in this study is similar to other DEXA studies, with changes in the range of 2% to 4%.29,40,41 This does not correlate with our hypothesis, that a MoM monoblock acetabular component would demonstrate decreased peri-acetabular BMD. The CoCr monoblock acetabular component may not be more rigid as we hypothesised. Although CoCr as an alloy is stiffer than titanium, the total acetabular component geometry, rather than just the metal type, may make the flexibility of these two components closer than we thought.34,42 However, the inferior osteointegration capacity of the beaded CoCr interface in comparison with titanium has limited its clinical use to hip resurfacing. Further studies will be needed to understand the clinical relationship of peri-acetabular BMD to implant performance.
The authors would like to thank Dr. R. Feibel, Dr. P. Kim and Dr. P. Thurston for contributing patients to this series, as well as Ms. G. Parker and Mr. K. Kemp for assistance with clinical data collection and analysis.
1 Learmonth ID , YoungC, RorabeckC. The operation of the century: total hip replacement. Lancet2007;370:1508–1519.CrossrefPubMed Google Scholar
2 Berry DJ , HarmsenWS, CabanelaME, MorreyBF. Twenty-five-year survivorship of two thousand consecutive primary Charnley total hip replacements. J Bone Joint Surg [Am]2002;84-A:171–186.CrossrefPubMed Google Scholar
3 Beaulé PE , SchmalzriedTP, UdomkiatP, AmstutzHC. Jumbo femoral head for the treatment of recurrent dislocation following total hip replacement. J Bone Joint Surg [Am]2002;84-A:256–263.CrossrefPubMed Google Scholar
4 Kabo J , GebhardJ, LorenG, AmstutzH. In vivo wear of polyethylene acetabular components. J Bone Joint Surg [Br]1993;75-B:254–258.CrossrefPubMed Google Scholar
5 Dowson D , HardakerC, FlettM, IsaacGH. A hip joint simulator study of the performance of metal-on-metal joints: Part II: design. J Arthroplasty2004;19(Suppl 3):124–130.CrossrefPubMed Google Scholar
6 Devine TM , WulffJ. Cast vs wrought cobalt-chromium surgical implant alloys. J Biomed Mater Res1975;9:151–167. Google Scholar
7 Mueller LA , VoelkM, KressA, PittoRP, SchmidtR. An ABJS Best Paper: Progressive cancellous and cortical bone remodeling after press-fit cup fixation: a 3-year followup. Clin Orthop Relat Res2007;463:213–220.PubMed Google Scholar
8 Rahmy AI , GosensT, BlakeGM, ToninoA, FogelmanI. Periprosthetic bone remodelling of two types of uncemented femoral implant with proximal hydroxyapatite coating: a 3-year follow-up study addressing the influence of prosthesis design and preoperative bone density on periprosthetic bone loss. Osteoporos Int2004;15:281–289.CrossrefPubMed Google Scholar
9 Krismer M , StöcklB, FischerM, et al.Early migration predicts late aseptic failure of hip sockets. J Bone Joint Surg [Br]1996;78-B:422–426.PubMed Google Scholar
10 Korovessis P , PiperosG, MichaelA. Periprosthetic bone mineral density after Mueller and Zweymueller total hip arthroplasties. Clin Orthop Relat Res1994;309:214–221.PubMed Google Scholar
11 Pitto RP , BhargavaA, PanditS, MunroJT. Retroacetabular stress-shielding in THA. Clin Orthop Relat Res2008;466:353–358.CrossrefPubMed Google Scholar
12 Stöckl B , SandowM, KrismerM, et al.Migration of the Duraloc cup at two yearsJ Bone Joint Surg. [Br]1999;81-B:51–53. Google Scholar
13 Moher D , HopewellS, SchulzKF, et al.CONSORT 2010 explanation and elaboration: updated guidelines for reporting parallel group randomised trials. Int J Surg2012;10:28–55.CrossrefPubMed Google Scholar
14 ASTM International. ASTM F75 - 12 Standard Specification for Cobalt-28 Chromium-6 Molybdenum Alloy Castings and Casting Alloy for Surgical Implants (UNS R30075). www.astm.org/Standards.F75.htm (date last accessed 4 July 2013). Google Scholar
15 Shetty NR , HamerAJ, KerryRM, et al.Bone remodelling around a cemented polyethylene cup: a longitudinal densitometry study. J Bone Joint Surg [Br]2006;88-B:455–459. Google Scholar
16 Wilkinson JA , PeelNF, ElsonRA, StockleyI, EastellR. Measuring bone mineral density of the pelvis and proximal femur after total hip arthroplasty. J Bone Joint Surg [Br]2001;83-B:283–288.CrossrefPubMed Google Scholar
17 Amstutz HC , ThomasBJ, JinnahR, et al.Treatment of primary osteoarthritis of the hip: a comparison of total joint and surface replacement arthroplasty. J Bone Joint Surg [Am]1984;66-A:228–241. Google Scholar
18 Bellamy N , BuchananWW, GoldsmithCH. Validation study of WOMAC: a health status instrument for measuring clinically important patient relevant outcomes following total or knee arthroplasty in osteoarthritis. J Orthop Rheumatol1988;1:95–108. Google Scholar
19 Harris WH . Traumatic arthritis of the hip after dislocation and acetabular fractures: treatment by mold arthroplasty: an end result study using a new method of result evaluation. J Bone Joint Surg [Am]1969;51-A:737–755. Google Scholar
20 Hays RD , SherbourneCD, MazelRM. The RAND 36-Item Health Survey 1.0. Health Econ . 1993;2:217–227.CrossrefPubMed Google Scholar
21 Meneghini RM , FordKS, McColloughCH, HanssenAD, LewallenDG. Bone remodeling around porous metal cementless acetabular components. J Arthroplasty2010;25:741–747.CrossrefPubMed Google Scholar
22 Beaulé PE , MussettSA, MedleyJB. Metal-on-metal bearings in total hip arthroplasty. Instr Course Lect2010;59:17–25.PubMed Google Scholar
23 Bobyn J , MortimerE, GlassmanA, et al.Producing and avoiding stress shielding: laboratory and clinical observations of non-cemented total hip arthroplasty. Clin Orthop Relat Res1992;274:79–96. Google Scholar
24 Burroughs BR , MuratogluOK, BragdonCR, et al.In vitro comparison of frictional torque and torsional resistance of aged conventional gamma-in-nitrogen sterilized polyethylene versus aged highly crosslinked polyethylene articulating against head sizes larger than 32 mm. Acta Orthop2006;77:710–718.CrossrefPubMed Google Scholar
25 Langton DJ , JamesonSS, JoyceTJ, et al.Accelerating failure rate of the ASR total hip replacement. J Bone Joint Surg [Br]2011;93-B:1011–1016.CrossrefPubMed Google Scholar
26 Smith AJ , DieppeP, HowardPW, BlomAW. Failure rates of metal-on-metal hip resurfacings: analysis of data from the National Joint Registry for England and Wales. Lancet2012;380:1759–1766.CrossrefPubMed Google Scholar
27 Kim YH , YoonSH, KinJS. Changes in the bone mineral density in the acetabulum and proximal femur after cementless total hip replacement: alumina-on-Alumina versus alumina-on-polyethylene articulation. J Bone Joint Surg [Br]2007;89-B:174–179.CrossrefPubMed Google Scholar
28 Shetty NR , HamerAJ, KerryRM, et al.Bone remodelling around a cemented polyethylene cup: a longitudinal densitometry study. J Bone Joint Surg [Br]2006;88-B:455–459. Google Scholar
29 Penny JO , BrixenK, VarmarkenJE, OvesenO, OvergaardS. Changes in bone mineral density of the acetabulum, femoral neck and femoral shaft, after hip resurfacing and total hip replacement: two-year results from a randomised study. J Bone Joint Surg [Br]2012;94-B:1036–1044.CrossrefPubMed Google Scholar
30 DeLee JG , CharnleyJ. Radiological demarcation of cemented sockets in total hip replacement. Clin Orthop Relat Res1976;121:20–32.PubMed Google Scholar
31 Huiskes R . Finite element analysis of acetabular reconstruction: noncemented threaded cups. Acta Chir Scand1987;58:620–625. Google Scholar
32 Levenston ME , BeaupreGS, SchurmanDJ, CarterDR. Computer simulations of stress-related bone remodeling around noncemented acetabular components. J Arthroplasty1993;8:595–605.CrossrefPubMed Google Scholar
33 Bobyn JD , StackpoolGJ, HackingSA, TanzerM, KrygierJJ. Characteristics of bone ingrowth and interface mechanics of a new porous tantalum biomaterial. J Bone Joint Surg [Br]1999;81-B:907–914.CrossrefPubMed Google Scholar
34 Manley MT , OngKL, KurtzSM. The potential for bone loss in acetabular structures following THA. Clin Orthop Relat Res2006;453:246–253.CrossrefPubMed Google Scholar
35 Mont MA , SeylerTM, RaglandPS, et al.Gait analysis of patients with resurfacing hip arthroplasty compared with hip osteoarthritis and standard total hip arthroplasty. J Arthroplasty2007;22:100–108.CrossrefPubMed Google Scholar
36 Berton C , GirardJ, KrantzN, MigaudH. The Durom large diameter head acetabular component: early results with a large-diameter metal-on-metal bearing. J Bone Joint Surg [Br]2010;92-B:202–208.CrossrefPubMed Google Scholar
37 Garbuz DS , TanzerM, GreidanusNV, MasriBA, DuncanCP. The John Charnley Award: Metal-on-metal hip resurfacing versus large-diameter head metal-on-metal total hip arthroplasty: a randomized clinical trial. Clin Orthop Relat Res2010;468:318–325.CrossrefPubMed Google Scholar
38 Vendittoli PA , RoyA, MottardS, et al.Metal ion release from bearing wear and corrosion with 28 mm and large-diameter metal-on-metal bearing articulations: a follow-up study. J Bone Joint Surg [Br]2010;92-B:12–19.CrossrefPubMed Google Scholar
39 Chatrath V, Catelas I, Beaulé PE. A prospective case series examining the use of a large head metal-on-metal total hip system. ASTM 2013:In press. Google Scholar
40 Wright JM , PellicciPM, SalvatiEA, et al.Bone density adjacent to press-fit acetabular components: a prospective analysis with quantitative computed tomography. J Bone Joint Surg [Am]2001;83-A:529–536. Google Scholar
41 Yahia CA , DiwanjiS, GanapatiM, VendittoliPA, LavigneM. Supra acetabular bone mineral density measurements after hip resurfacing arthroplasty at short term follow up. Hip Int2011;21:468–474.CrossrefPubMed Google Scholar
42 Pitto RP , WillmannG, SchrammM. Initial stability of modular acetabular components: comparative in-vitro study with polyethylene and ceramic liners. Biomed Tech (Berl)2001;46:109–112. Google Scholar
Funding statement:
This work was supported by a research grant from Wright Medical Technology (Arlington, Tennessee).
Author contributions:
L. Gauthier: Data analysis, Manuscript write-up
L. Dinh: Methodology of BMD, Data collection, Statistical analysis
P. E. Beaulé: Data analysis, Statistical analysis, Writing of paper, Performed surgeries
ICMJE Conflict of Interest:
One author (PEB) has acted as a consultant for Wright Medical Technology Inc.
©2013 The British Editorial Society of Bone & Joint Surgery. This is an open-access article distributed under the terms of the Creative Commons Attributions licence, which permits unrestricted use, distribution, and reproduction in any medium, but not for commercial gain, provided the original author and source are credited.
