


Abstract
Objective
The objective of this study was to evaluate the rotation and translation of each joint in the hindfoot and compare the load response in healthy feet with that in stage II posterior tibial tendon dysfunction (PTTD) flatfoot by analysing the reconstructive three-dimensional (3D) computed tomography (CT) image data during simulated weight-bearing.
Methods
CT scans of 15 healthy feet and 15 feet with stage II PTTD flatfoot were taken first in a non-weight-bearing condition, followed by a simulated full-body weight-bearing condition. The images of the hindfoot bones were reconstructed into 3D models. The ‘twice registration’ method in three planes was used to calculate the position of the talus relative to the calcaneus in the talocalcaneal joint, the navicular relative to the talus in talonavicular joint, and the cuboid relative to the calcaneus in the calcaneocuboid joint.
Results
From non- to full-body-weight-bearing condition, the difference in the talus position relative to the calcaneus in the talocalcaneal joint was 0.6° more dorsiflexed (p = 0.032), 1.4° more everted (p = 0.026), 0.9 mm more anterior (p = 0.031) and 1.0 mm more proximal (p = 0.004) in stage II PTTD flatfoot compared with that in a healthy foot. The navicular position difference relative to the talus in the talonavicular joint was 3° more everted (p = 0.012), 1.3 mm more lateral (p = 0.024), 0.8 mm more anterior (p = 0.037) and 2.1 mm more proximal (p = 0.017). The cuboid position difference relative to the calcaneus in the calcaneocuboid joint did not change significantly in rotation and translation (all p ≥ 0.08).
Conclusion
Referring to a previous study regarding both the cadaveric foot and the live foot, joint instability occurred in the hindfoot in simulated weight-bearing condition in patients with stage II PTTD flatfoot. The method used in this study might be applied to clinical analysis of the aetiology and evolution of PTTD flatfoot, and may inform biomechanical analyses of the effects of foot surgery in the future.
Cite this article: Bone Joint Res 2013;2:255–63.
Article focus
To reconstruct a three-dimensional (3D) CT image of stage II posterior tibial tendon dysfunction (PTTD) flatfoot
To evaluate the rotation and translation of each joint in the hindfoot
To compare the load response of hindfoot joint movement in healthy feet with that in stage II PTTD flatfoot
Key messages
The talus position difference relative to the calcaneus in the talocalcaneal joint was more dorsiflexed, more everted, more anterior and proximal in stage II PTTD flatfoot compared with that in healthy feet
The navicular position difference relative to the talus in the talonavicular joint was more everted, more lateral, more anterior and more proximal
The cuboid position difference relative to the calcaneus in the calcanocuboid joint did not change significantly in either rotation or translation
Strengths and limitations
The study was conducted under quasi-static condition, only simulating the stance phase of the gait
The ankle was always in neutral position, but it involved several types of position including dorsiflexion, plantarflexion, eversion, inversion and combined positions during gait
Introduction
Adult acquired flatfoot deformity (AAFD) is characterised by the loss of medial arch height, hindfoot valgus and forefoot abduction when the foot is loaded.1 Posterior tibial tendon dysfunction (PTTD) is thought to be the main aetiology of AAFD and the classification system of PTTD described by Johnson and Strom2 is used for making a diagnosis. Stage II PTTD flatfoot is regarded as the transition stage from flexible to rigid deformity,2 and various surgical procedures including soft-tissue and osseous reconstruction are available. However, because we lack understanding of how joint movement changes three-dimensionally with PTTD progression, no breakthroughs have been made in understanding the kinematics that play a key role in guiding the surgical procedure in stage II PTTD flatfoot. Because stage II PTTD flatfoot is affected by weight-bearing, radiographs taken under these conditions have been reported to be useful both for evaluation of PTTD flatfoot in this stage and pre-operative planning of corrective surgery.3
There are numerous radiological studies using plain radiographs, including those measuring the talo–first metatarsal angle, talonavicular coverage angle, and calcaneal pitch to evaluate flatfoot deformity.4-6 However, computed tomography (CT) is reported to be more accurate for assessing the relationship of the complicated tarsal bones compared with plain radiographs.7,8 Several studies have been conducted in order to evaluate the effect of loading on flatfoot deformity with a CT scan,9-11 and have found subluxation of the subtalar joint, increased tarsal bone shift and joint movement in hindfoot under loading in patients with flatfoot.
Although these studies evaluated the change in translation and rotation of joints under loading using CT, the difference was measured based on two-dimensional (2D) image data. It is difficult to make an evaluation from 2D images, as flatfoot deformity is caused by three-dimensional (3D) changes in the components of the foot, including the bones, ligaments and joint capsules. To our knowledge, there are few 3D reports12,13 that evaluate the load response of bone and joint change in patients with flatfoot deformity, especially in those at stage II PTTD using CT. In the present study, the change in spatial position of the joint in hindfoot under full-body-weight-bearing conditions was measured three-dimensionally in healthy and stage II PTTD flatfoot subjects. From this the effects of loading on tarsal bones and joints through the 3D reconstruction technique using CT image and data could be studied. The main hypothesis of the present study was that the segmental movements observed at the tarsal joints in stage II PTTD flatfoot subjects would increase under full-bodyweight-bearing compared with healthy ones, due to posterior tibial tendon dysfunction or a failure of soft-tissue support.
Patients and Methods
This study was approved by the Medical Ethics Committee of Fudan University. A thorough explanation was provided to all participants to obtain consent. The study consisted of 15 right feet in 15 healthy volunteers, all of whom had no history of foot or ankle injuries and no foot or ankle instability. There were seven men and eight women, with a median age of 31.3 years (sd 7.0; 22 to 43) and a median weight of 60.3 kg (sd 4.4; 55 to 70).They also did not fulfil any of the criteria for patients with either PTTD2 or cavus foot.14
Stage II PTTD flatfoot was defined using the PTTD stage classification by Johnson and Strom.2 A total of 15 right feet in 15 patients were identified with stage II PTTD flatfoot. There were nine men and six women, with a median age of 28.5 years (sd 6.0; 21 to 45) and a median weight of 62.9 kg (sd 5.5; 55 to 74). Foot type was determined by two foot and ankle surgeons (YZ and XW). Classification was verified by radiological measurements.15 Only patients with feet for which both surgeons made the same diagnosis were accepted.
A custom foot-loading device was designed and constructed to simulate normal full-body-weight-bearing, counterbalanced by the constraints of a modern CT scanner (Fig. 1). It was designed by the Medical Technical Department of Huashan Hospital, Fudan University. The device consisted of two main components: a foot plate with stress sensor and a main frame including a loading control component (Fig. 2). The device was made of wood to minimise artefacts during CT scanning.
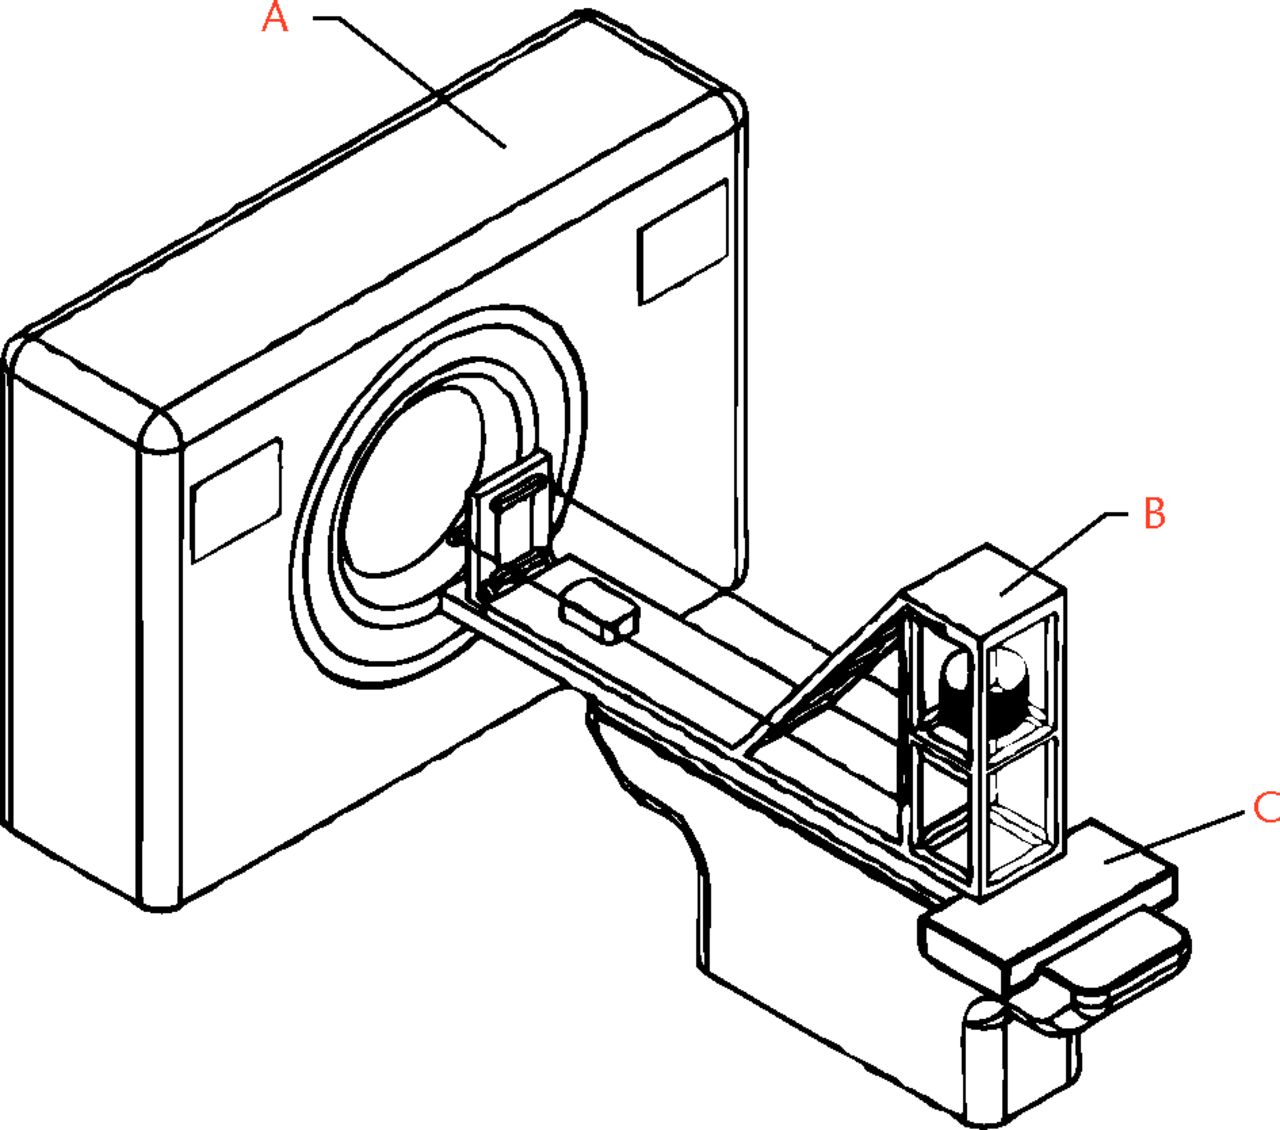
Fig. 1
Diagram of the computed tomography (CT) set-up, showing a) the scanner tube, b) the foot loading device and c) the scanner bed.
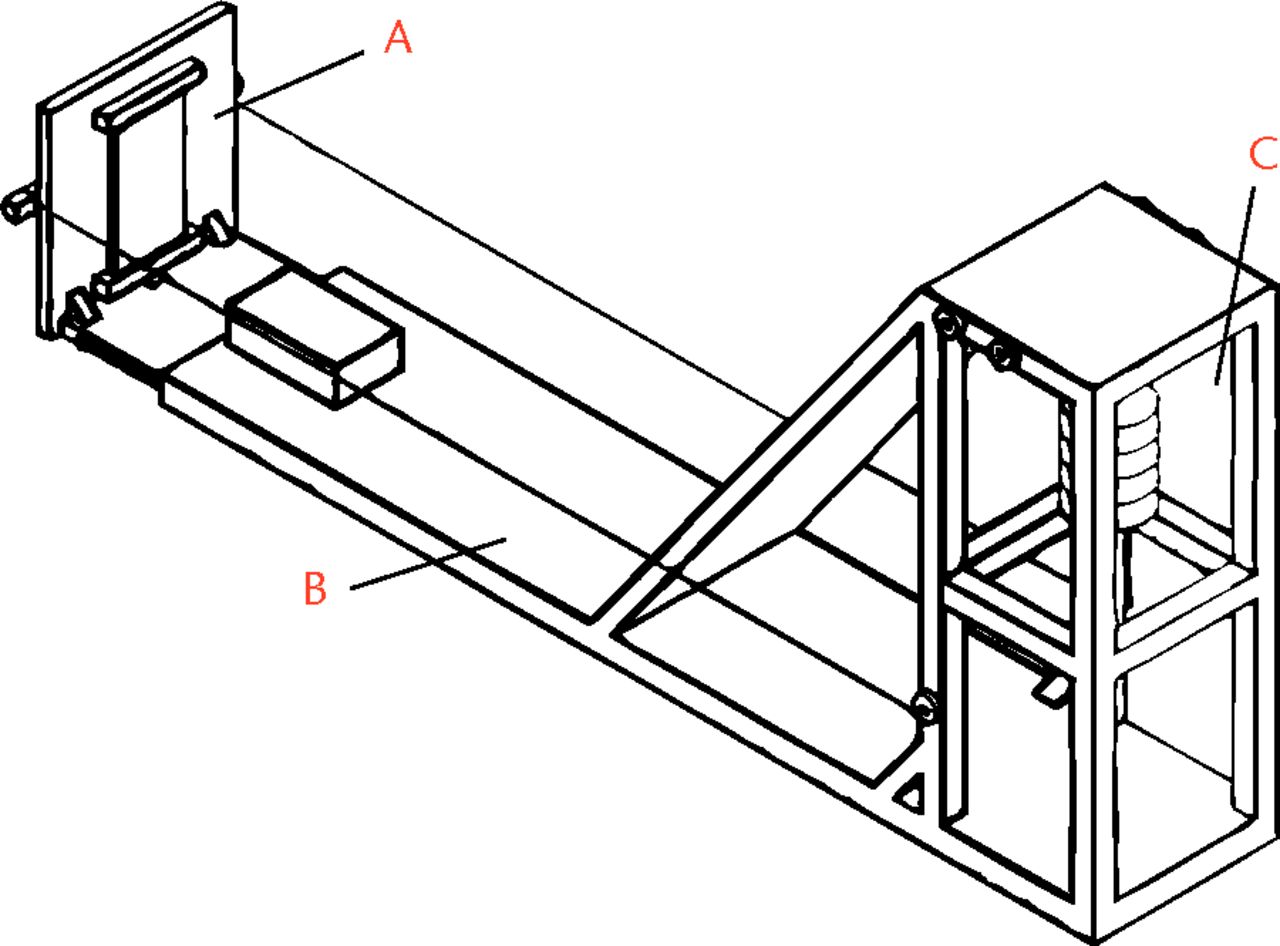
Fig. 2
Diagram of the foot-loading device, showing a) a foot plate with stress sensor, b) the main frame and c) the loading control component.
Each subject was positioned on the scanner bed in a supine position, with the right lower leg fixed to the supporting platform using velcro straps in order to keep it in a neutral position. The supporting platform was placed 8 cm above the scanner bed, allowing for slight flexion of the knee. The right foot sole was placed on a customised foot plate made from radiolucent materials. It was an L-shaped support that slid on the front edges of the main frame base. The flanges fitted into slots on the front edges of the main frame base. An external load (such as standard weights or sandbags) was applied to the foot plate through a system of wires and pulleys to simulate physical full-body-weight-bearing with the lower limb muscles under tension.
CT imaging and data collection
CT scanning of the foot and ankle was undertaken with participants in the supine position, which were set to neutral in all axes to make a vertical line connecting the centre of the heel and the second metatarsal, with the tibial shaft through the ankle centre horizontal and parallel to the CT bed.12,16 CT images of right feet were scanned from 10 cm proximal to the tibiotalar joint to the sole, using a 256 multi-slice CT scanner (100 kV × 150 mA, volume EC, 512 × 512 matrix; 0.67 mm thickness; 0.67 mm interval) (Philips Brilliance 256; Philips Medical Systems, Best, The Netherlands). The CT images were taken in a non-weight-bearing condition, followed by loading with each subject’s full bodyweight, thus mimicking full body-weight-bearing (Fig. 3).13 The coefficient of variance in measured values of the loading force of the foot were 8.7% (sd 3.8) and 5.3% (sd 0.7), respectively.13
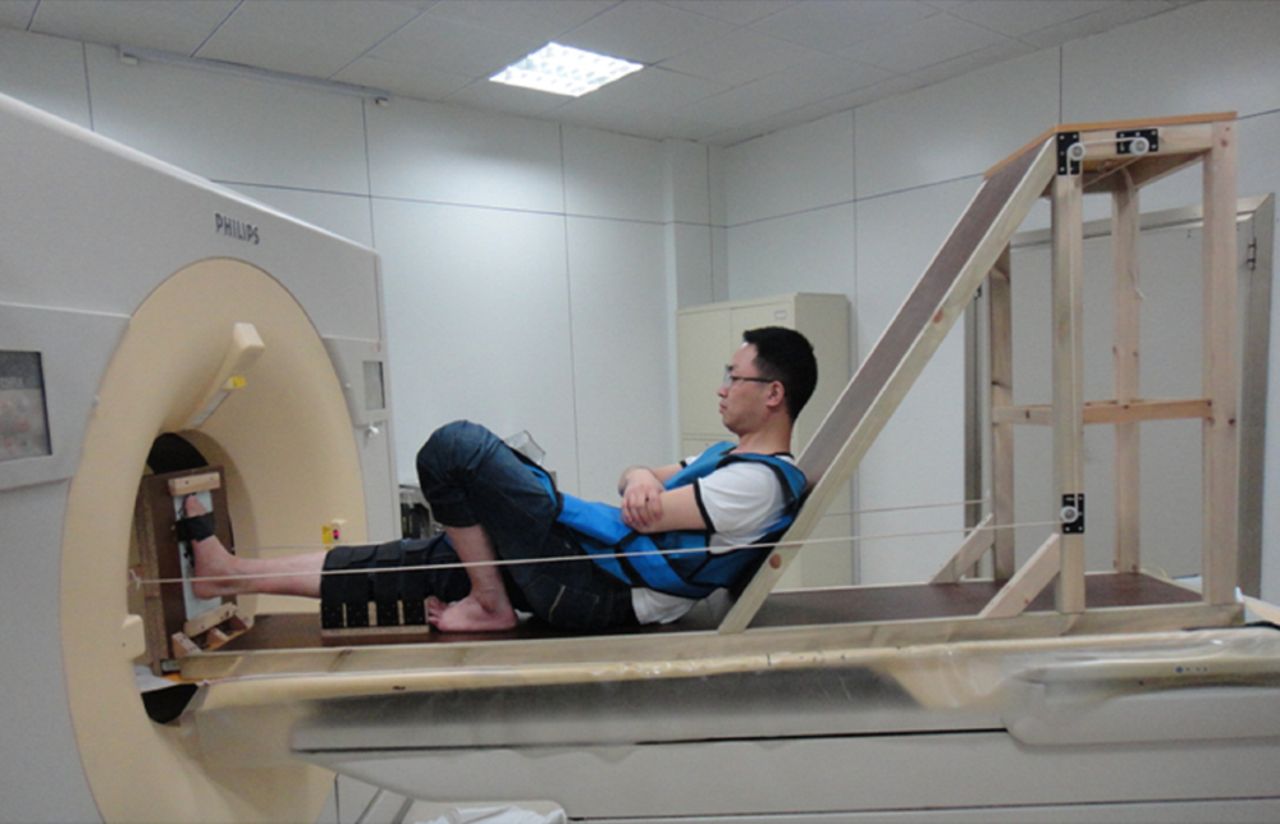
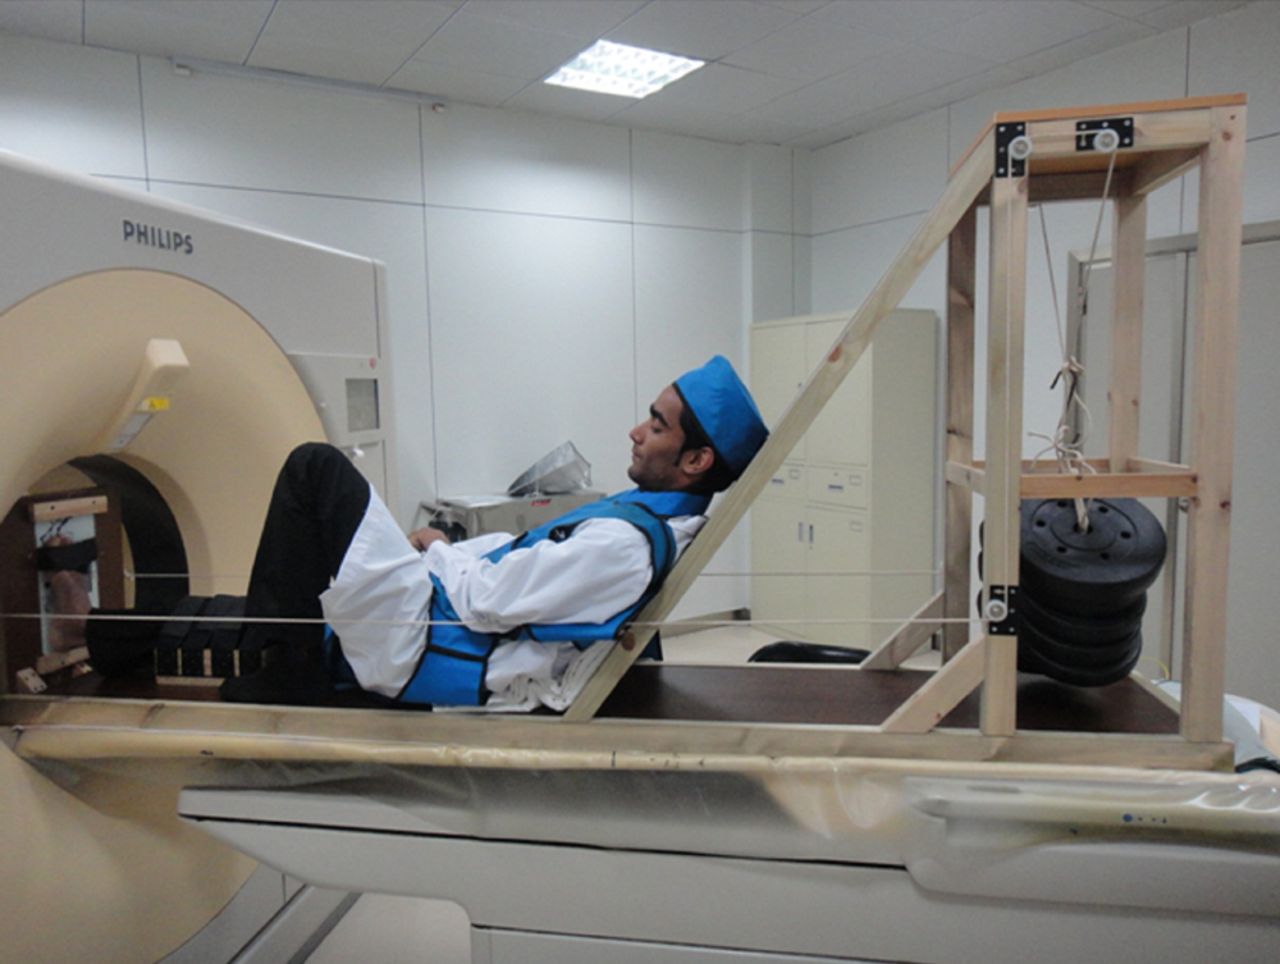
Figs. 3a - 3b
Photographs showing CT scanning in a) non-weight-bearing condition and b) full-body-weight-bearing condition.
3D reconstruction of CT images
In order to identify segmental movement between two bones in the hindfoot from non- to full-body-weight-bearing, 3D image data were reconstructed from 2D Digital Imaging and Communications in Medicine (DICOM) image data obtained from the CT examination. The following image processing and analysis steps were performed: 1) the slices of all axial CT images in non- and full-body-weight-bearing conditions with foot and ankle in the neutral position were imported into a 3D reconstruction software package (Mimics 10.01; Materialise Inc., Leuven, Belgium); 2) a threshold level was set to cortical regions of the bones; and 3) the 3D models of the talus, navicular, calcaneus and cuboid were created following segmentation of these bones (Fig. 4).
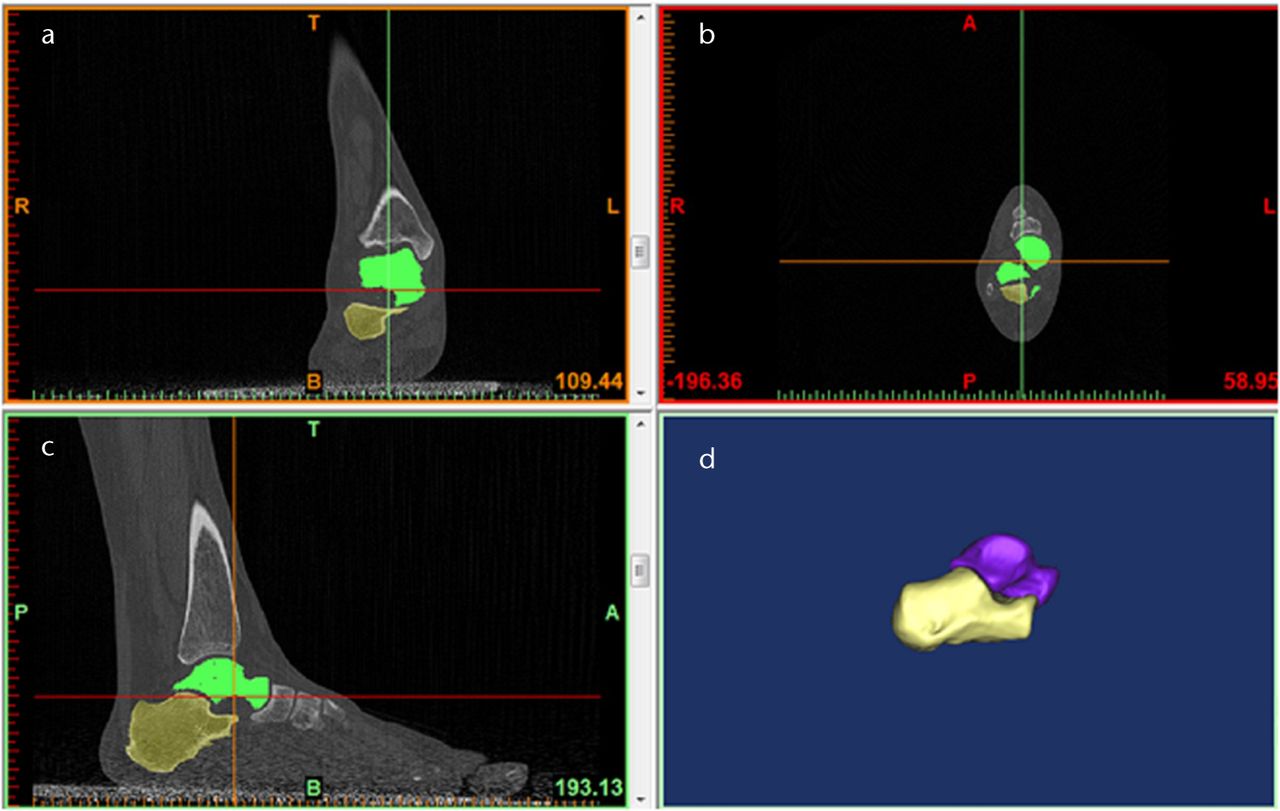
Fig. 4
Figures 4a to 4c – axial CT images of the ankle. Figure 4d – three-dimensional reconstruction of the CT images of the talus and calcaneus.
Segmental movement of the hindfoot
The 3D kinetics in the talocalcaneal, talonavicular and calcaneocuboid joints were evaluated in a reverse engineering software package (Geomagic Studio 12.0; Geomagic Co., Morrisville, North Carolina) by the ‘twice registration’ method, which we report for the first time here. For example, the 3D kinetics in the talocalcaneal joint was evaluated as follows. Briefly, calcaneus and talus bone merge into the talocalcaneal joint in Mimics software, and were then imported into Geomagic studio software (Fig. 5).
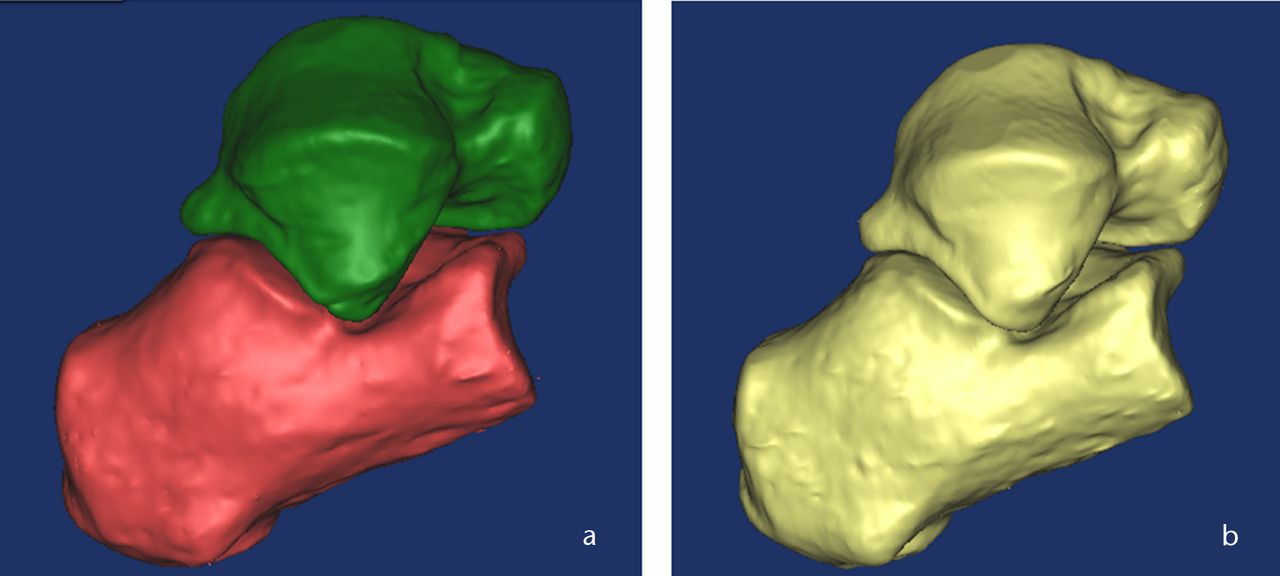
Fig. 5
Three-dimensional CT images of the talocalcaneal joint a) before merge and b) after merge.
The first registration stated as calcaneus (one bone of the joint) in non-weight-bearing condition (moving bone) was moved virtually until it coincided with the same bone in full-body-weight-bearing condition (Fig. 6). The bone registration rate was evaluated by deviation analysis until it reached the maximum rate (Fig. 7). The merged talocalcaneal joint again split into two bones in Mimics software (Fig. 8). The second registration stated as talus (another bone of the joint) in non-weight-bearing condition (moving bone) was virtually moved until it coincided with the same bone in full-body-weight-bearing condition through second registration in Geomagic studio software, and translation and rotation of the moving bone was automatically recorded. The bone registration rate was evaluated by deviation analysis until it reached the maximum rate as described above. Accuracy of the method was 0.1 mm in translation and 0.1 mm in rotation.7,12,17
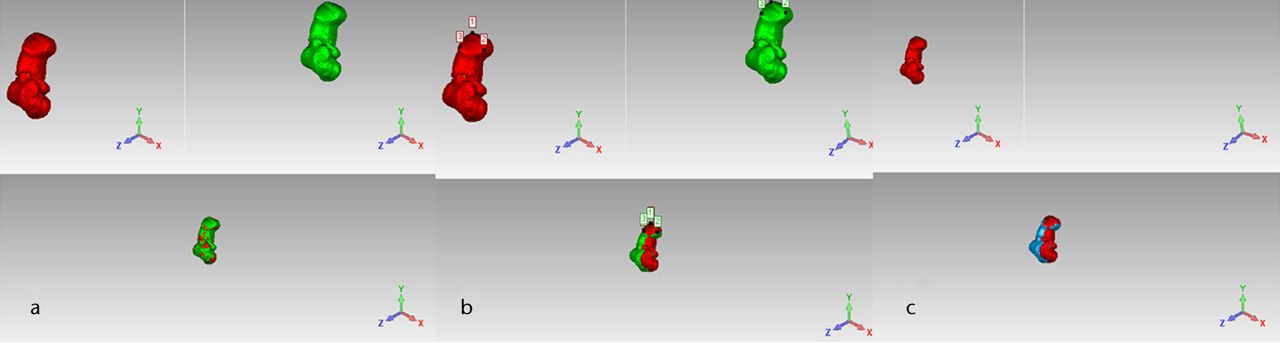
Fig. 6
The first registration of the calcaneus in the talocalcaneal joint a) before registration, b) during registration and c) after registration.
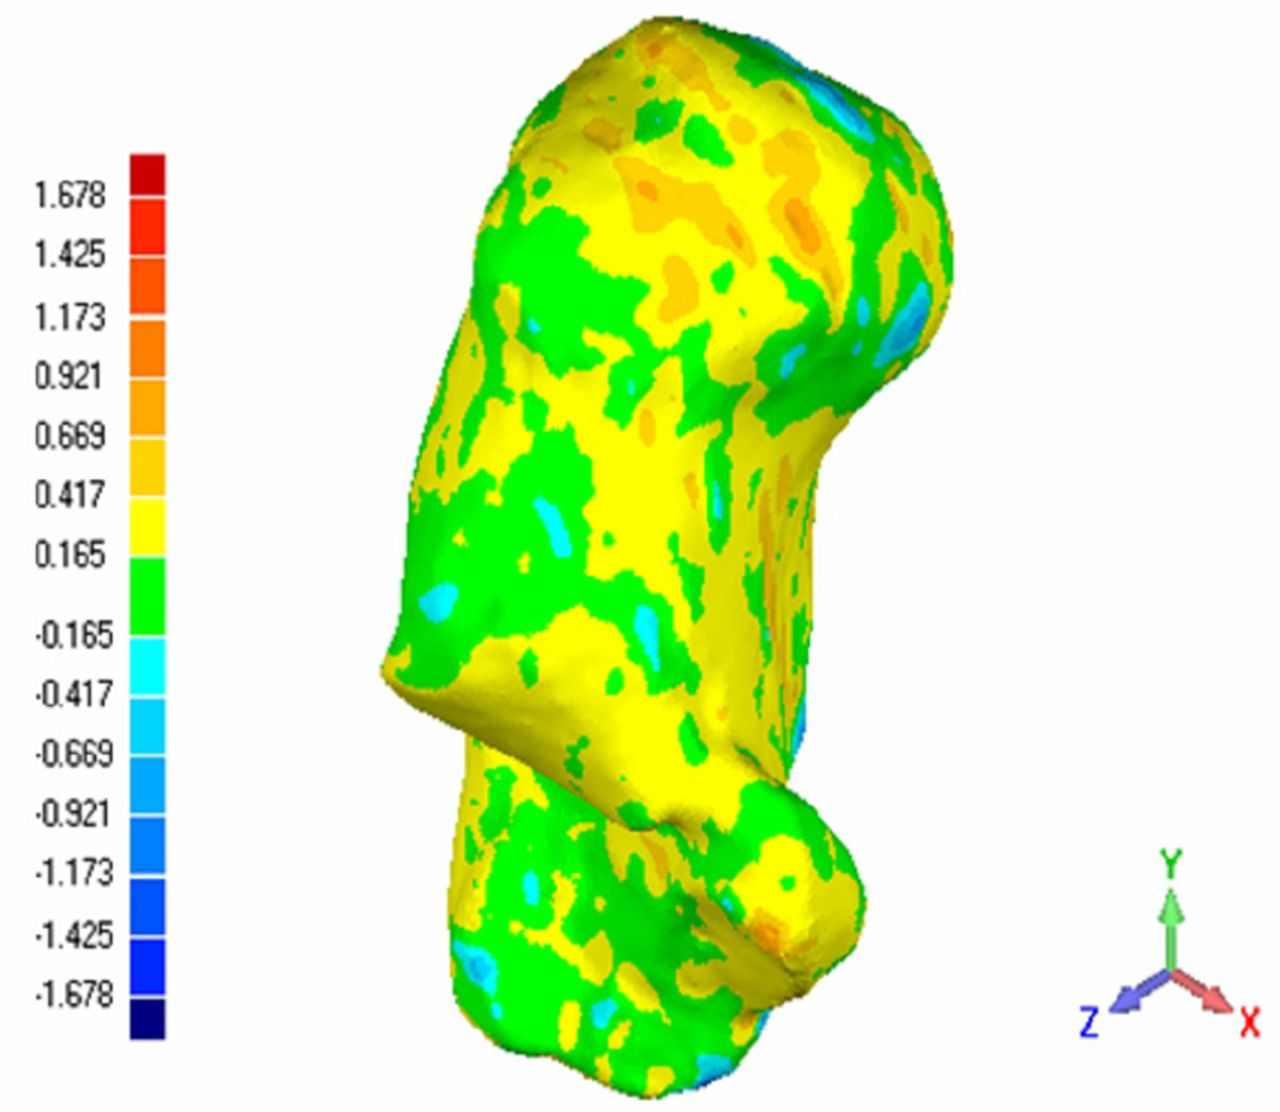
Fig. 7
Three-dimensional deviation analysis of the calcaneus registration rate.
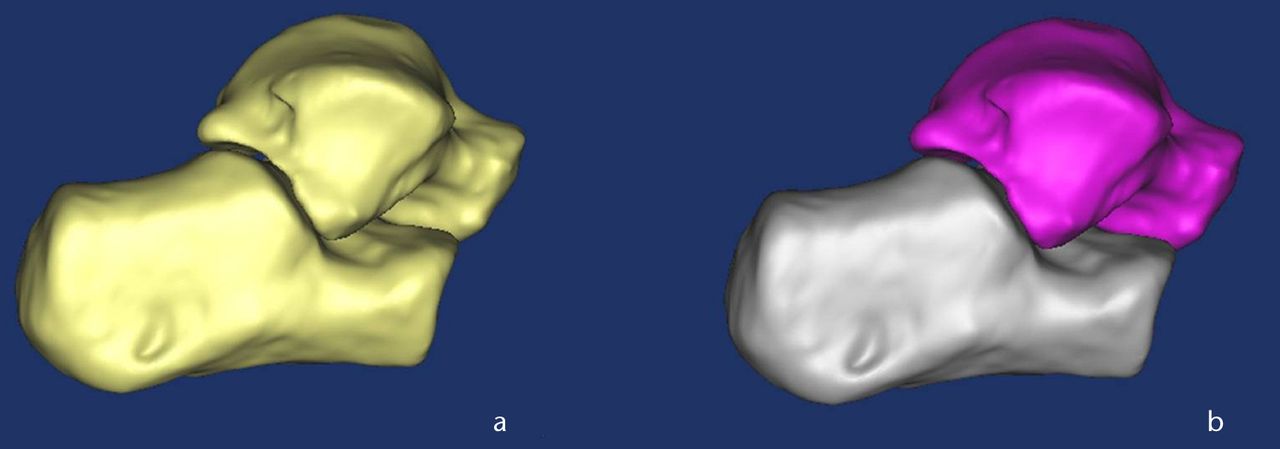
Fig. 8
Three-dimensional CT images of the talocalcaneal joint a) before split and b) after split.
Talonavicalar joint movement is defined as the deviation of the navicular relative to the talus. Talocalcaneal and calcaneocuboid joint movements are defined as deviation of the talus and cuboid relative to the calcaneus, respectively.12,13 Segmental movements of each joint from non- to full-body-weight-bearing condition were calculated from the translations and rotations of each bone. In accordance with a report by Kitaoka et al,16 rotation angles of each bone were defined relative to the three major axes of rotation for examination: plantarflexion/dorsiflexion, adduction/abduction and eversion/inversion. Dorsiflexion, eversion, and abduction were defined as positive and plantarflexion, inversion, and adduction were defined as negative.18-20 Translational segmental movement was subsequently calculated in three directions (coronal, sagittal, and vertical) and estimated for each translation. We evaluated the segmental movement of the talocalcaneal, talonavicular and calcaneocuboid joints between participants with normal feet and those with stage II PTTD flatfoot from non-weight-bearing to full-body-weight-bearing condition.
Statistical analysis
The data were analysed using an unpaired t-test. The results were presented as the mean with standard deviation (sd). A significant difference was defined as p < 0.05. All analyses were performed using SPSS v20.0 software (SPSS Inc., Chicago, Illinois).
Results
The subjects did not complain of any discomfort during loading. A 3D model of a stage II PTTD flatfoot subject’s right foot under non- and full-body-weight-bearing is shown in Figure 9. Rotation and translation of each joint of the hindfoot is presented in Tables I and II.
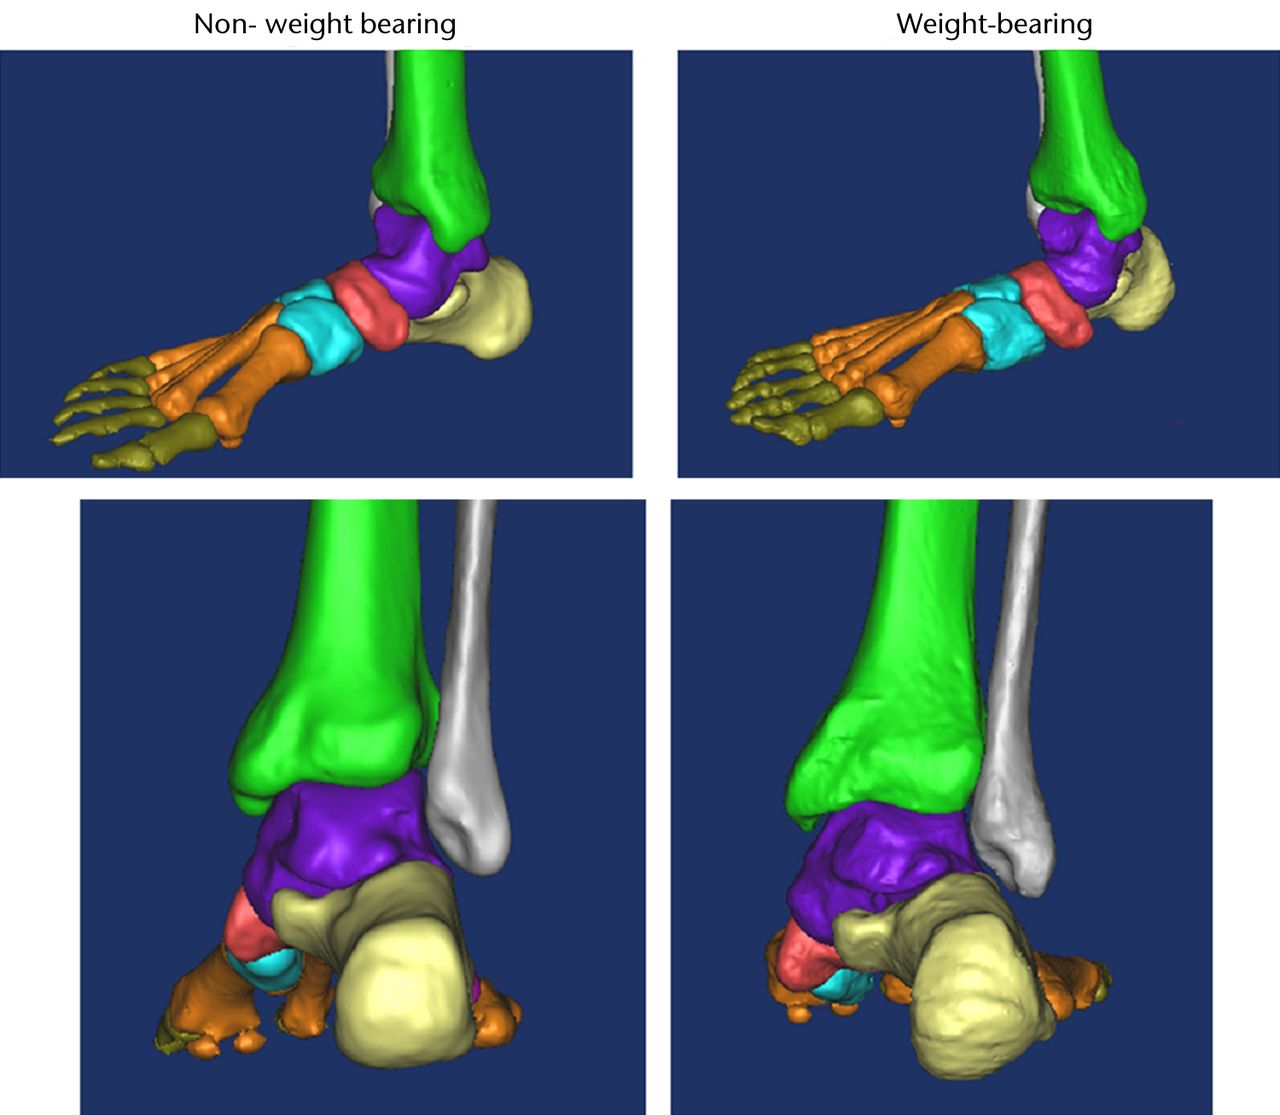
Fig. 9
Lateral (top) and posterior (bottom) three-dimensional CT images of a stage II posterior tibial tendon dysfunction (PTTD) flatfoot subject’s right foot under non-weight-bearing (left) and full-body-weight-bearing (right).
Table I
Rotation of each joint from non- to full-bodyweight-bearing for normal feet and stage II posterior tibial tendon dysfunction (PTTD) flatfeet
| Mean (sd) rotation (°) | ||||
|---|---|---|---|---|
| Joint/direction* | Normal foot | Stage II PTTD foot | Mean difference | p-value† |
| Talocalcaneal joint | ||||
| df+/pf- | 1.4 (0.7) | 2.0 (0.4) | 0.6 | 0.032 |
| ev+/iv- | 2.4 (0.4) | 3.8 (0.6) | 1.4 | 0.026 |
| abd+/add- | 1.7 (1.5) | 2.2 (0.4) | 0.5 | 0.22 |
| Talonavicular joint | ||||
| df+/pf- | 1.8 (1.2) | 2.0 (1.5) | 0.2 | 0.69 |
| ev+/iv- | 3.2 (0.4) | 6.2 (0.3) | 3.0 | 0.012 |
| abd+/add- | 2.8 (1.3) | 3.0 (1.4) | 0.9 | 0.69 |
| Calcaneocuboid joint | ||||
| df+/pf- | -0.8 (0.2) | -1.0 (0.4) | -0.2 | 0.09 |
| ev+/iv- | 2.2 (0.3) | 2.4 (0.4) | 0.1 | 0.13 |
| abd+/add- | -1.2 (0.3) | -1.4 (0.3) | -0.2 | 0.08 |
-
* + and – denote the direction of the rotation; df, dorsiflexion; pf, plantarflexion; ev, eversion; iv, inversion; abd, abduction; add, adduction † unpaired t-test
Table II
Translation of each joint from non- to full-bodyweight-bearing for normal feet and stage II posterior tibial tendon dysfunction (PTTD) flatfeet
| Mean (sd) translation (mm) | ||||
|---|---|---|---|---|
| Joint/direction* | Normal foot | Stage II PTTD foot | Mean difference | p-value† |
| Talocalcaneal joint | ||||
| m+/l- | -2.3 (0.6) | -2.8 (1.2) | -0.5 | 0.16 |
| p+/a- | -2.8 (0.6) | -3.7 (0.6) | -0.9 | 0.031 |
| pr+/d- | 5.4 (0.6) | 6.4 (0.6) | 1.0 | 0.004 |
| Talonavicular joint | ||||
| m+/l- | -4.7 (0.3) | -6.0 (0.4) | -1.3 | 0.024 |
| p+/a- | 6.3 (0.7) | 7.5 (0.5) | 0.8 | 0.037 |
| pr+/d- | -8.0 (0.6) | -10.1 (1.1) | -2.1 | 0.017 |
| Calcaneocuboid joint | ||||
| m+/l- | 2.6 (1.1) | 2.8 (1.3) | 0.2 | 0.65 |
| p+/a- | 3.3 (0.4) | 3.5 (0.4) | 0.5 | 0.18 |
| pr+/d- | 5.1 (0.4) | 5.3 (0.3) | 0.3 | 0.13 |
-
* + and – denote the direction of the translation; m, medial; l, lateral; p, posterior; a, anterior; pr, proximal; d, distal † unpaired t-test
Talocalcaneal joint
The rotation of the calcaneus under full-body-weight-bearing relative to the talus at the talocalcaneal joint was significantly larger in the dorsiflexed and everted direction in stage II PTTD flatfoot compared with the healthy foot (p = 0.032 and p = 0.026, respectively), but not in the transverse plane (p = 0.22) (Table I). Translation of the calcaneus under full-bodyweight-bearing relative to the talus at the talocalcaneal joint was more anterior (p = 0.031) and more proximal (p = 0.004) in stage II PTTD flatfoot, but there was no statistically significant difference in the mediolateral direction (p = 0.16) (Table II).
Talonavicular joint
The rotation of the navicular under full-body-weight-bearing relative to the talus at the talonavicular joint was significantly larger in the everted direction in stage II PTTD flatfoot compared with the healthy foot (p < 0.05) (Table I). No significant difference was observed in the sagittal or transverse planes (both p = 0.69).
The translation of the navicular under full-body-weight-bearing relative to the talus at the talonavicular joint was significantly more anterior, more proximal and more lateral in stage II PTTD flatfoot compared with the healthy foot (p = 0.024, 0.037 and 0.017, respectively (Table II).
Calcaneocuboid joint
The rotation of the cuboid under full-body-weight-bearing relative to the calcaneus at the calcaneocuboid joint was nearly the same in stage II PTTD flatfoot compared with the healthy foot. No significant difference was observed in the coronal, transverse or sagittal planes (p = 0.13, p = 0.08 and p = 0.09, respectively) (Table I).
Similarly, the translation of the cuboid under full-bodyweight-bearing relative to the calcanues at the calcaneocuboid joint showed no significant difference in stage II PTTD flatfoot compared with the healthy foot. No significant difference was observed in the coronal, vertical or sagittal axes (p = 0.65, p = 0.13 and p = 0.18, respectively) (Table II).
Discussion
Typical anatomical changes associated with PTTD flatfoot include the lateral translation of the navicular bone on the talus in a dorsoplantar view as well as calcaneal eversion and adduction.21 Also, the calcaneus pronates in a posteroanterior view and the talar head depresses.21 When PTTD is prolonged and has progressed to stage II, the spring ligament, the articular capsule of the talonavicular joint and the deltoid ligament become relaxed, resulting in eversion in the hindfoot and adduction in the forefoot.21
Furthermore, as a result of Achilles tendon and triceps surae contractures and the failure loads of the plantar fascia, the longitudinal arch drops, causing a flexible AAFD.22 It has been reported that a flexible flat foot progresses in a rigid manner in stage III although there are few reports on the effect of progression from flexible to rigid deformity using 3D hindfoot kinetics, especially under full-body-weight-bearing condition.22 Currently, several CT foot studies using loading devices are reported. Ananthakrisnan et al9 and Ledoux et al11 applied either 10% or 20% full-body-weight-bearing to the foot in the supine position, and confirmed that the contact area at the talocalcaneal joint was smaller for the flatfoot than for the healthy foot, or that the talonavicular joint of the flatfoot everted more than that of the healthy foot. Ferri et al10 applied 50% full-body-weight-bearing to the foot in the sitting position for dynamic CT studies. They compared the load responses of the tarsal bones in the flatfoot with those of the healthy foot in 2D CT coronal plain images, and demonstrated that the navicular height and the forefoot arch angle of the flatfoot became smaller than those of the healthy foot. However, few studies have previously investigated the rotational and translational change of joint in the hindfoot under full-body-weight-bearing in both the healthy foot and the flatfoot (especially stage II PTTD), using 3D reconstructed loading CT image data.13,22
In the present study, 3D differences of rotational and translational change of the talocalcaneal joint, talonavicular joint and calcaneocuboid joint from non- to full-bodyweight-bearing between stage II PTTD flatfoot and the healthy foot were first measured in vivo with high accuracy. The current in vivo results were compared with those of cadaveric studies as well as previous live studies. Cadaveric studies, using kinematic sensors attached to bones, have been reported to evaluate the load response associated with the axial loads. Kitaoka et al19 created a flatfoot model with almost all of the talar ligaments resected and evaluated the difference in the load response in healthy cadaver feet and the flatfoot model using kinematic sensors attached to bones (Table III). Blackman et al23 used kinematic sensors inserted into the tarsal bones and measured the relative bone-to-bone rotation. They created a soft-tissue attenuated flatfoot model, after repeated periodic load to the cadaver foot, added longitudinal incision to a specific ligament and compared the load response of a flatfoot model with a healthy cadaver in axial loading. The difference in the quantity of bone rotation in each direction in the current study was consistent with that observed by Blackman et al,23 and it was the smallest of the three studies. This might be because of the artificial cadaveric flatfoot model, which may not have had sufficient load to represent full-body weight. Also, compared with live feet, the soft tissues could be damaged more to create the flatfoot model. In addition, live studies have investigated the rotational and translational change of joint in the hindfoot using 3D reconstructed loading CT image data. Imai et al22 evaluated hindfoot kinetics in patients with stage II and stage III PTTD flatfoot compared with those in healthy patients under dorsiflexion and plantarflexion conditions using 3D CT reconstruction images, and demonstrated that talocalcaneal and talonavicular-joint adduction increased in the maximal plantarflexion of the ankle joint in stage II feet compared with healthy cases. However, the study measured hindfoot bone biomechanics with flat-foot deformity under non-load conditions. Physiologically, the foot and ankle are loaded joints during gait. This study measured the kinetics change of the talocalcaneal, talonavicular and calcaneocuboid joints in stage II PTTD flatfoot and healthy subjects from non- to full-body-weight-bearing. Kido et al13 also evaluated the bone rotation of each joint in the hindfoot and compared the load response in healthy feet with that in flatfeet by analysing the reconstructive 3D CT image data during weight-bearing.
Table III
Comparison of rotation of joints from non- to full-bodyweight-bearing between normal feet and feet with stage II posterior tibial tendon dysfunction (PTTD) in live and cadaver specimens
| Mean (sd) difference (°) | ||||
|---|---|---|---|---|
| Joint/direction* | Present study | Kitaoka et al18 | Blackman et al22 | Kido et al16 |
| Live/cadaver specimens | LIVE | CADAVER | CADAVER | LIVE |
| Talocalcaneal joint | ||||
| df+/pf- | 0.6† | -8.2 (3.2)† | -1.33 (2.71)† | 1.1† |
| ev+/iv- | 1.4† | -0.1 (1.6)† | 2.77 (3.01)† | 1.7 |
| abd+/add- | 0.5 | 0.5 (2.2)† | 1.27 (1.91)† | 0.8 |
| Talonavicular joint | ||||
| df+/pf- | 0.2 | 10.5 (6.6)† | 1.47 (2.04)† | 0.7 |
| ev+/iv- | 3.0† | 8.1 (3.8)† | 2.98 (1.74)† | 2.3† |
| abd+/add- | 0.9 | 13.6 (5.0)† | 3.02 (2.2)† | 0.9 |
| Calcaneocuboid joint | ||||
| df+/pf- | -0.2 | - | - | - |
| ev+/iv- | 0.1 | - | - | - |
| abd+/add- | -0.2 | - | - | - |
-
* + and – denote the direction of the rotation; df, dorsiflexion; pf, plantarflexion; ev, eversion; iv, inversion; abd, abduction; add, adduction † statistically significant difference
The results showed that talocalcaneal-joint dorsiflexion and eversion increased and talonavicular-joint eversion in flatfeet compared with normal cases. Our results were consistent with those measured by Kido et al,13 but the value was more accurate as the subjects included were the only stage II PTTD flatfoot. The weight-bearing simulation method used in the study may have been non-physiological because the triceps surae muscle did not move smoothly in the knee flexion position. This study shows that with the lower limb kept in a straight position, it can simulate the physiologic full-body-weight-bearing with the triceps surae muscle moving smoothly.
The present study showed the talonavicular joint to be significantly everted, and the talocalcaneal joint significantly dorsiflexed and everted, with flatfoot. Firstly, the talus moved to the inside of the foot, and eversion was thought to occur in the talonavicular and the talocalcaneal joint in the flatfoot because the posterior tibial tendon dysfunction was the main cause of adult acquired flatfoot deformity. There are no osseous supporting tissues and only soft supporting tissues in the subtalar joint. Therefore, it easily received load stress, and thus the deformity increased in the flatfoot patients. However, the kinetics of the calcaneocuboid joint did not change significantly under full-body-weight-bearing conditions, which were not measured in the above two studies.13,22
Imai et al22 reported the translation of each joint in hindfoot with ankle from neutral to maximum dorsiflexion or platarflexion using the centroid point of each bone. However, the joint translation is not purely indicated in the study as the translation was partially influenced by bone rotation and the hindfoot has a complex structure. In the present study, we evaluated the translation of each joint in three axes by the ‘twice registration’ method. The translation of calcaneocuboid joint was so small as to account for the synovial space within the joint. However the magnitude of the translations of the talocalcaneal joint and the talonavicular joint was large. Significantly, the translation of the navicular under full-body-weight-bearing relative to the talus at the talonavicular joint was both more proximal and more lateral and the translation of the calcaneus under full-body-weight-bearing relative to the talus at the talocalcaneal joint was both more anterior and more proximal in stage II PTTD flatfoot compared with the healthy foot, thus resulting in the longitudinal arch collapse, eversion in the hindfoot and adduction in the forefoot.
This study had some limitations. It was conducted under quasi-static conditions, only simulating the stance phase of the gait. Moreover, it was limited that the ankle was always in a neutral position, but it involved several types of position including dorsiflextion, plantarflexion, eversion, inversion and the combined during gait. Therefore, it is important to analyse kinetics of bone and joint in foot and ankle dynamically during gait. Future studies are also necessary to evaluate the difference between sexes or age groups by quantitatively evaluating the 3D kinetics of a greater number of PTTD flatfoot cases. The results may indicate the in vivo movement of the bone and joint in hindfoot in PTTD flatfoot. This method may promote further understanding of the etiology and evolution of PTTD flatfoot, contribute the selecting of the surgical procedures and evaluate the effects of foot surgery in the future.
1 Pomeroy GC , PikeRH, BealsTC, ManoliA 2nd. Acquired flatfoot in adults due to dysfunction of the posterior tibial tendon. J Bone Joint Surg [Am]1999;81-A:1173–1182.CrossrefPubMed Google Scholar
2 Johnson KA , StromDE. Tibialis posterior tendon dysfunction. Clin Orthop Relat Res1989;239:196–206. Google Scholar
3 Sangeorzan BJ , MoscaV, HansenST Jr. Effect of calcaneal lengthening on relationships among the hindfoot, midfoot, and forefoot. Foot Ankle1993;14:136–141.CrossrefPubMed Google Scholar
4 Bordelon RL . Correction of hypermobile flatfoot in children by molded insert. Foot Ankle1980;1:143–150.CrossrefPubMed Google Scholar
5 Dyal CM , FederJ, DelandJT, ThompsonFM. Pes planus in patients with posterior tibial tendon insufficiency: asymptomatic versus symptomatic foot. Foot Ankle Int1997;18:85–88.CrossrefPubMed Google Scholar
6 Haddad SL, Mann R. Flatfoot deformity in adults. In: Coughlin MJ, Mann RA, Saltzmann SL, eds. Surgery of the foot and ankle. Philadelphia: Mosby, 2007:1007–1086. Google Scholar
7 Ochia RS , InoueN, RennerSM, et al.Three-dimensional in vivo measurement of lumbar spine segmental motion. Spine (Phila Pa 1976)2006;31:2073–2078.CrossrefPubMed Google Scholar
8 Takatori R , TokunagaD, HaseH, et al.Three-dimensional morphology and kinematics of the craniovertebral junction in rheumatoid arthritis. Spine (Phila Pa 1976)2010;35:1278–1284.CrossrefPubMed Google Scholar
9 Ananthakrisnan D , ChingR, TencerA, HansenST Jr, SangeorzanBJ. Subluxation of talocalcaneal joint in adults who have symptomatic flatfoot. J Bone Joint Surg [Am]1999;81-A:1147–1154. Google Scholar
10 Ferri M , ScharfenbergerAV, GoplenG, DanielsTR, PearceD. Weightbearing CT scan of severe flexible pes planus deformities. Foot Ankle Int2008;29:199–204.CrossrefPubMed Google Scholar
11 Ledoux WR , RohrES, ChingRP, SangeorzanBJ. Effect of foot shape on the three-dimensional position of foot bones. J Orthop Res2006;24:2176–2186.CrossrefPubMed Google Scholar
12 Imai K , TokunagaD, TakatoriR, et al.In vivo three-dimensional analysis of hindfoot kinematics. Foot Ankle Int2009;30:1094–1100.CrossrefPubMed Google Scholar
13 Kido M , IkomaK, ImaiK, et al.Load response of the tarsal bones in patients with flatfoot deformity: in vivo 3D study. Foot Ankle Int2011;32:1017–1022.CrossrefPubMed Google Scholar
14 Kadakia AR . The cavus foot. Foot Ankle Clin2013;18. Google Scholar
15 Davids JR , GibsonTW, PughLI. Quantitative segmental analysis of weight-bearing radiographs of the foot and ankle for children: normal alignment. J Pediatr Orthop2005;25:769–776.CrossrefPubMed Google Scholar
16 Kitaoka HB , LuoZP, AnKN. Three-dimensional analysis of normal ankle and foot mobility. Am J Sports Med1997;25:238–242.CrossrefPubMed Google Scholar
17 Takatori R , TokunagaD, InoueN, et al.In vivo segmental motion of the cervical spine in rheumatoid arthritis patients with atlantoaxial subluxation. Clin Exp Rheumatol2008;26:442–448.PubMed Google Scholar
18 Kitaoka HB , LundbergA, LuoZP, AnKN. Kinematics of the healthy arch of the foot and ankle under physiologic loading. Foot Ankle Int1995;16:492–499. Google Scholar
19 Kitaoka HB , LuoZP, AnKN. Three-dimensional analysis of flatfoot deformity: cadaver study. Foot Ankle Int1998;19:447–451.CrossrefPubMed Google Scholar
20 Kitaoka HB , LuoZP, KuraH, AnKN. Effect of foot orthoses on 3-dimensional kinematics of flatfoot: a cadaveric study. Arch Phys Med Rehabil2002;83:876–879.CrossrefPubMed Google Scholar
21 Johnson JE , YuJR. Arthrodesis technique in the management of stage II and III acquired adult flatfoot deformity. Instr Course Lect2006;55:531–542. Google Scholar
22 Imai K , IkomaK, MakiM, et al.Features of hindfoot 3D kinetics in flat foot in ankle-joint maximal dorsiflexion and plantarflexion. J Orthop Sci2011;16:638–643.CrossrefPubMed Google Scholar
23 Blackman AJ , BlevinsJJ, SangeorzanBJ, LedouxWR. Cadaveric flatfoot model: ligament attenuation and Achilles tendon overpull. J Orthop Res2009;27:1547–1554.CrossrefPubMed Google Scholar
Funding statement:
This work was supported by the National Natural Science Foundation of China (No: 81171670) to X. Ma. Dr Y. Zhang and Dr J. Xu are co-first authors on this paper and contributed equally to this research.
Author contributions:
Y. Zhang: Study design, Writing the paper, Data analysis, CT reconstructions, 3D assessment of joint motion
J. Xu: Data analysis, CT reconstructions, 3D assessment of joint motion
X. Wang: Data analysis
J. Huang: Data collection
C. Zhang: Data collection
L. Chen: CT reconstructions
C. Wang: 3D assessment of joint motion
X. Ma: Guided the research
ICMJE Conflict of Interest:
None declared
©2013 The British Editorial Society of Bone & Joint Surgery. This is an open-access article distributed under the terms of the Creative Commons Attributions licence, which permits unrestricted use, distribution, and reproduction in any medium, but not for commercial gain, provided the original author and source are credited.
