


Abstract
Objectives
Overlap between the distal tibia and fibula has always been quoted to be positive. If the value is not positive then an injury to the syndesmosis is thought to exist. Our null hypothesis is that it is a normal variant in the adult population.
Methods
We looked at axial CT scans of the ankle in 325 patients for the presence of overlap between the distal tibia and fibula. Where we thought this was possible we reconstructed the images to represent a plain film radiograph which we were able to rotate and view in multiple planes to confirm the assessment.
Results
The scans were taken for reasons other than pathology of the ankle. We found there was no overlap in four patients. These patients were then questioned about previous injury, trauma, surgery or pain, in order to exclude underlying pathology.
Conclusion
We concluded that no overlap between the tibia and fibula may exist in the population, albeit in a very small proportion.
Article focus
To investigate if the presence of no overlap between the distal tibia and fibula is always pathological or whether it can exist in asymptomatic ankles
Key messages
No overlap between the tibia and fibula at the ankle joint can exist in a painless ankle
It is an uncommon finding, with an incidence in the population of 1.25%
If other investigations are negative then the possibility of this anatomical variant should be considered
Strengths and limitations
Disproves a long-held belief, by providing evidence that the absence of overlap between the tibia and fibula at the ankle is not always pathological
Is a very uncommon finding, so it should only be used if other investigations such as CT, MRI and arthroscopy find no pathological cause
Introduction
The distal tibiofibular joint is prone to disruption of the syndesmosis as a result of bony fracture of the ankle or ligamentous injury.1,2 Injury to the syndesmosis is diagnosed by initial clinical examination and plain film radiography. There may be subtle changes on plain films which may lead to the suspicion of a syndesmotic injury. These can be further investigated with CT, MRI and arthroscopy of the ankle.3-10 While clinical examination and plain film radiography are the everyday tools of the orthopaedic surgeon, the use of other modalities such as CT and MRI has become more widespread. However, arthroscopy of the ankle has a more limited role as a result of its availability, cost and the expertise required.3-8
Therefore, taking measurements on radiographs is an important decision-making tool.1,9Variations from published guidelines are interpreted as pathological, leading to surgical treatment.1,2 However, it is important to recognise the variations of normal anatomy and their prevalence in the population, so that unnecessary treatment is avoided.
The measurement of overlap between the distal tibia and fibula on plain film imaging is used clinically, and in the literature, to predict injury to the syndesmosis.1-4 The value is measured 1 cm proximal to the plafond, and is the horizontal distance between the medial border of the fibular and the anterior tubercle of the tibia; it should be greater than 1 mm on the mortise view.1,4 This value has been reported in previous studies to always be positive and should exist in all views (Fig. 1).4,11
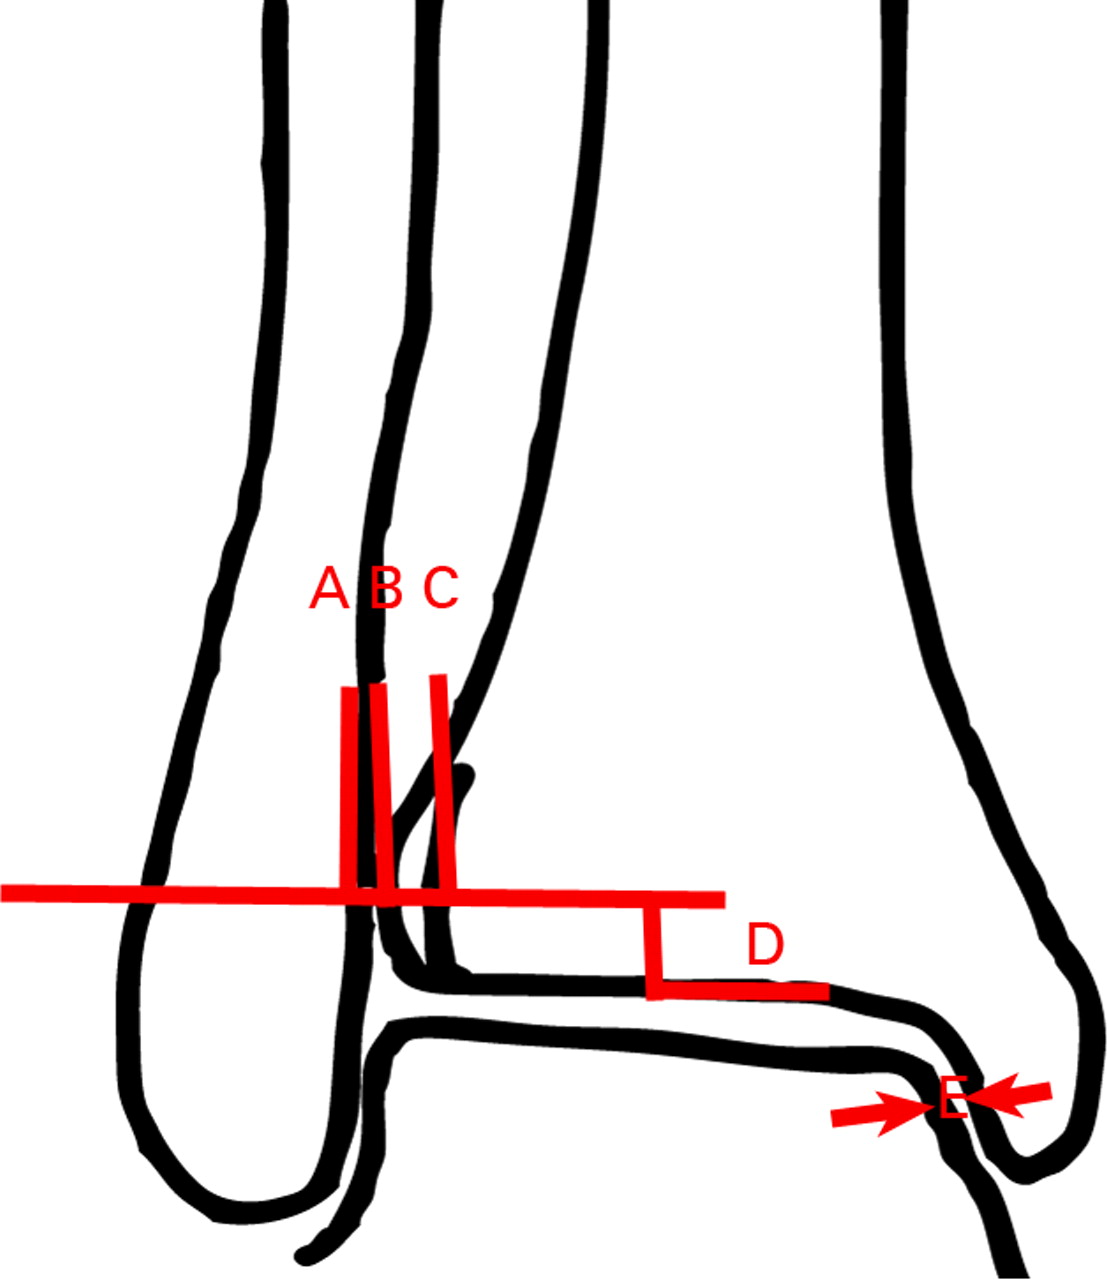
Fig. 1
Diagram showing the typical syndesmotic relationship in patients without overlap between the tibia and fibula (A, medial fibular border; B, anterior tibial tubercule; C, lateral border of the posterior tibia; D, plane 1 cm above plafond; E, medial clear space; AC, tibiofibular clear space). The distance AB in these patients is positive.
A case was encountered at our institution where no overlap existed between the tibia and fibula in a Weber B-type ankle fracture. The ankle was tested intra-operatively using the method described by Stoffel et al12 and the syndesmosis was found to be stable. Intra-operative screening and plain film imaging of the contralateral limb showed no overlap between the tibia and fibula (Fig. 2). The patient reported no previous trauma, pain or surgery to the unaffected limb. These findings led us to the null hypothesis that non-pathological overlap between the tibia and fibula in the population does, indeed, exist.


Fig. 2
Plain radiographs post-operatively of a 32-year-old female patient who sustained a Weber B fracture of the left ankle, with no overlap existing between the tibia and fibula, showing a) the left ankle, which showed no increase in the distance between the tibia and fibula or increase of the medial clear space during intra-operative testing and b) the right ankle, showing that the condition was present on the right side, which had no history of trauma, pain or previous surgery.
The aim of this study was to review axial CT scans of ankles taken for reasons other than ankle pathology and to investigate if there is a percentage of the population in which no overlap exists between the distal tibia and fibula.
Patients and Methods
Ethical approval was obtained for this study. Axial CT scans of patients who underwent CT scans for reasons other than ankle pain or ankle pathology were used. Axial scans were used as they impart the ability to observe the presence of overlap between the tibia and fibula. This procedure also avoided the need to unnecessarily expose patients with asymptomatic ankles to radiography. Ebraheim et al5 demonstrated that axial CT scans were more accurate at diagnosing diastasis than plain films.
The CT scans were taken from patients who had undergone total knee replacement and who were being assessed for rotational alignment in accordance with the Perth CT protocol,13 or those undergoing CT angiography looking at blood flow in the distal extremity. Pathology of the ankle was not the reason for the CT scan in any patient. All imaging was performed with a 64-slice CT scanner in all cases, albeit with different models and at different insitutions.
Two observers (BS, RR) for this study reviewed CT scans from 325 patients. The axial slices were initially reviewed using Inteleviewer (Intelerad Medical System Inc., Montreal, Canada) to measure overlap between the distal tibia and fibula (Figs 3a and 3b). Where absence of overlap was considered to be a possibility, the images were viewed using the GE Workstation (GE Healthcare, Chalfont St Giles, United Kingdom) with three-dimensional (3D) volume rendering using transparent bone windows (Fig. 3c). This software enabled the ankle to be rotated in three axes to visually inspect and confirm, or deny, the presence of overlap.

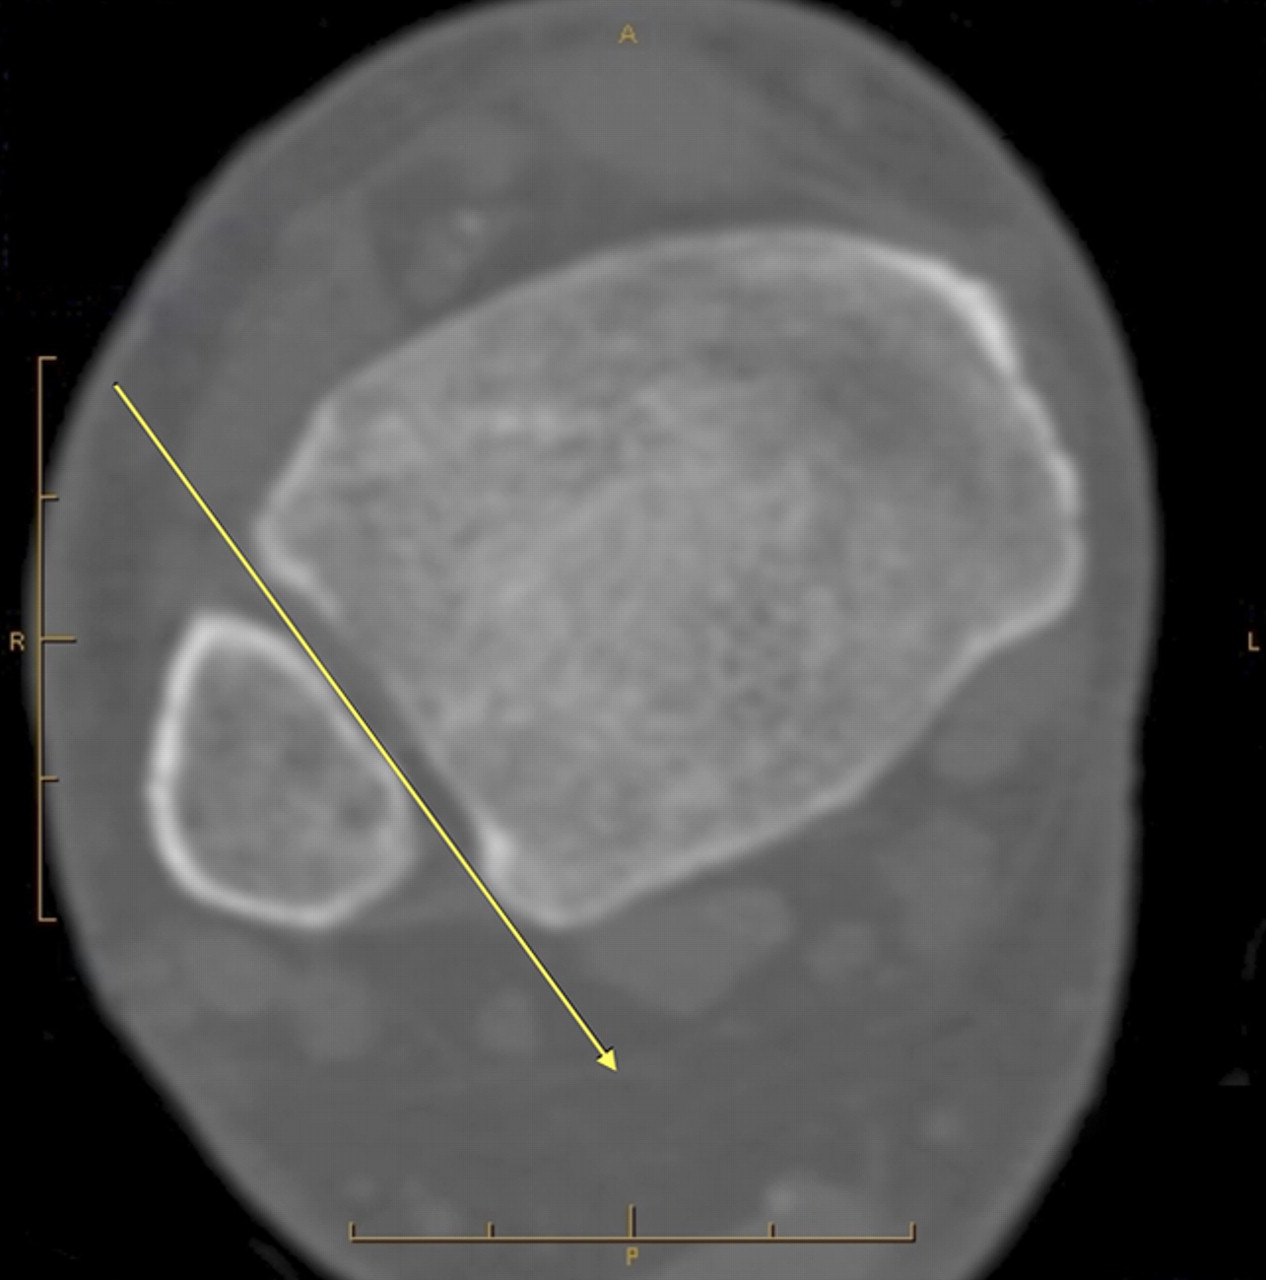

Figs. 3a - 3c
Figures 3a and 3b – axial CT views a) in a patient with overlap between the distal tibia and fibula, showing that a plain film x-ray beam (represented by the yellow arrow) cannot be passed between the bones, and b) in a patient without overlap, with the x-ray beam (yellow line) able to pass between the tibia and fibula. Figure 3c – three-dimensional image of the patient in Figure 3b, reconstructed from CT scans. This image resembles a radiograph and can be rotated through 360° using GE Workstation software (GE Healthcare).
Exclusion criteria included previous history of injury to the ankle, current ankle pain or evidence on CT scanning of prior injury or surgery. One patient was excluded (evidence of significant trauma to ankle) leaving 324 patients eligible for inclusion. A total of 209 of these scans included both ankle joints, enabling us to note if the anatomy was present bilaterally, resulting in a total of 533 ankles.
Any patients in whom no overlap was seen were then contacted and questioned about: 1) ankle pain; 2) previous trauma; and 3) surgery to the ankle joint. If there was a positive response to any of these three questions, the patients were not recorded in the positive group.
Measurements from scans in patients where no overlap existed were made. These were: 1) the angle that the overlap was present compared with the intermalleolar axis in the coronal plane; 2) angle compared with the talus, in the coronal plane; 3) medial clear space1; 4) tibiofibular clear space (syndesmosis A) (Fig. 4).1,14 We measured the intermalleolar axis, as the tips of the malleoli palpated clinically and it was felt that the angle between the overlap, compared with the talus, was representative of the mortise view.
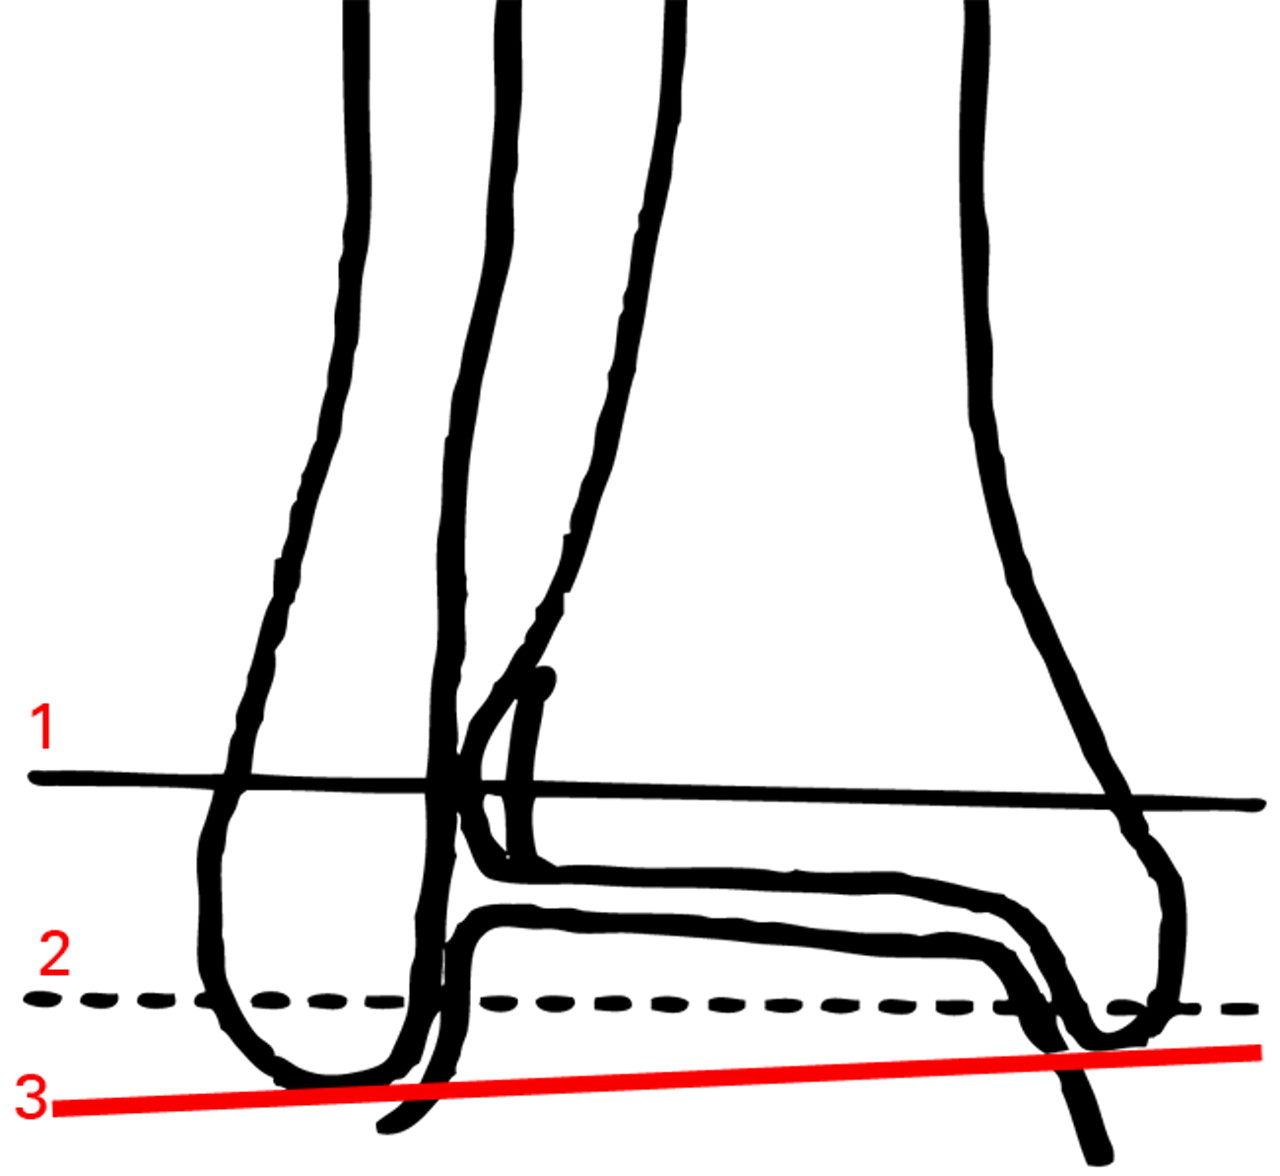
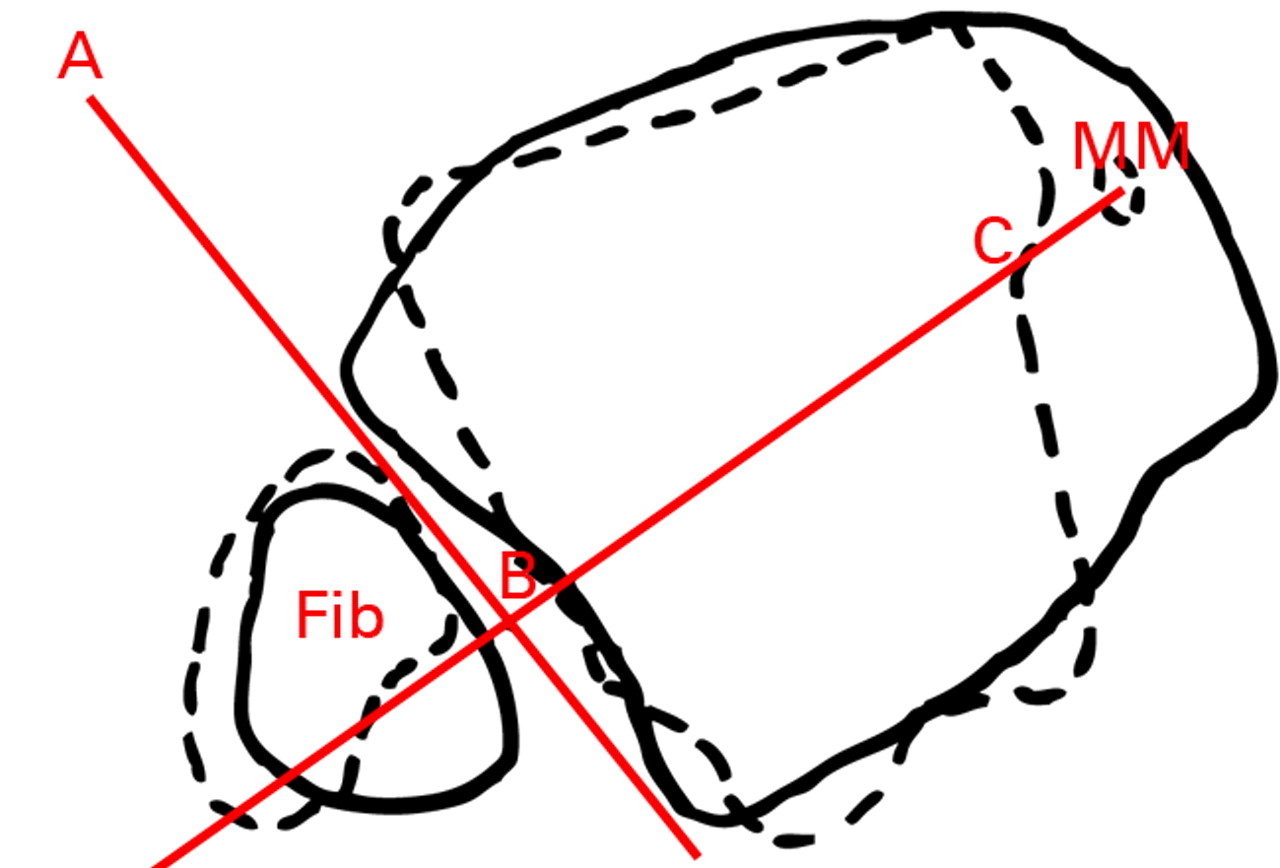

Figs. 4a - 4c
Figure 4a – diagram of a mortise view showing approximate levels of axial slices shown in the diagrams in Figures 4b and 4c. Line 1 is represented by solid lines and Line 2 represented by dotted lines in Figures 4b and 4c. Line 3 is the line between the tips of the medial and lateral malleoli (intermalleoli line). Figures 4b and 4c – diagrams of superimposed axial slices for b) measurement of the angle (ABC) between the diastasis (AB) and the intermalleoli axis (BC), and c) measurement of the angle (ABC) between the diastasis (AB) and the talus (BC) (MM, medial malleolus).
Results
Of the 324 patients assessed, four displayed no overlap between tibia and fibula, giving a prevalence of 1.23% in the sample population. Two of these patients had bilateral scans of the ankle, and in both patients no overlap was demonstrated bilaterally. None of the four patients reported any previous ankle pain, surgery to the ankle or previous trauma to the ankle joint.
The mean age of these four patients was 61.8 years (38 to 75). Of the six ankles with no overlap assessed, the mean angle of the intermalleoli and diastasis was 91.5° (86° to 95°), the mean angle of the diastasis to the talar axis 18.5° (15° to 23°) and the mean tibiofibular clear space was 5.6 mm (5.3 to 5.8) (Table I).
Table I
Results from the four patients (six ankles) with no overlap seen on axial CT scans
| Patient (side) | Age (yrs) | Talus/diastasis angle (°) | Intermalleolar angle (°) | Tibiofibular clear space (mm) |
|---|---|---|---|---|
| 1 – Left | 38 | 23 | 95 | 5.5 |
| 1 – Right | 22 | 93 | 5.6 | |
| 2 – Left | 68 | 15 | 86 | 5.8 |
| 2 – Right | 16 | 90 | 5.7 | |
| 3 – Left | 75 | 19 | 94 | 5.4 |
| 4 – Right | 66 | 16 | 91 | 5.3 |
| Mean | 61.8 | 18.5 | 91.5 | 5.6 |
Discussion
Injury to the syndesmotic ligaments of the ankle can be diagnosed using many different modalities.1,3,6,7,14,15 These range from clinical examination and plain film investigation to arthroscopy of the ankle. While arthroscopy has been reported to be the benchmark procedure,8 it is invasive and not all surgeons have the expertise and equipment to utilise this diagnostic tool. MRI is less uncomfortable for the patient than arthroscopy and has been reported to be more accurate than plain radiographs.1,7 However, it remains more costly and of limited availability when compared with plain radiographs.3,7
As a result of the limited availability of MRI, many surgeons rely on clinical examination and measurements from plain films for diagnosis. The main values used are: 1) the tibiofibular clear space (syndesmosis A), which is the distance from the medial fibula to the posterior tubercle of the medial border of the tibia. This is measured 1 cm above the tibial plafond1,4; 2) the tibiofibular overlap (syndesmosis B), which is the maximum overlap between the tibia and fibula, measured 1 cm above the tibial plafond1,4; and 3) the medial clear space.
The overlap between the tibia and fibular (syndesmosis B) has always been stated as being positive, i.e. there should always be overlap between the tibia and fibula.4 This has propagated into practice, such that overlap should exist on all views of the ankle.4 If overlap is not present, a syndesmotic injury is implied and treatment in the form of a syndesmotic fixation is usually undertaken.1,2 Pneumaticos et al4 found that there was always overlap between the two bones and implied that this should always exist. However, their study observed a total of 14 cadavers, making it unlikely to pick up a variant with a low prevalence, and only plain films were used; this would also decrease the likelihood of discovering the condition, as multiple images of the distal tibia and fibula would be required, in different orientations. These results were confirmed by Beumer et al,11 in a study of 20 cadavers. Our study has the advantage of large numbers and the ability to rotate the reformatted axial images in multiple planes in order to increase the accuracy of identification of the condition. Using CT scans gave us the ability to view large numbers to look for this uncommon variant. The software enabled the images to be converted into a movable image, simulating a plain film. We are not aware of any studies that show no overlap to be an anatomical variant, or that assess its prevalence in the population.
In our population of 324 patients, we found the prevalence to be 1.23%. Where both ankles were imaged, the condition was bilateral, suggesting this was normal for this patient. The angle where no overlap was present, in relation to the talus and intermalleoli axis, was within 4° of the contralateral side. Using axial CT scans gives us the best chance of detecting this variant. Using plain film imaging would require the x-ray beam to be located within a very small arc to identify the absence of overlap, if it exists. The best position for the beam is at approximately 90° to the tips of the malleoli in the coronal plane. Multiple plain film images around this angle would give the best chance of locating its presence, or the use of continuous fluoroscopy about the arc described.
The tibiofibular clear space (syndesmosis A) has been reported to be less than 6 mm in ankles in which the syndesmosis is intact.4,16 The medial clear space is reported to be normal if it is similar to the distance from the talus to the tibial plafond, as was the case with the measurements in all six ankles investigated (Table I). We found the mean syndesmosis A to be 5.6 mm, with all six measurements less than the quoted 6 mm. This suggests that the absence of overlap between the tibia and fibula in all views, with other normal radiological measurements, does not imply syndesmotic injury and requires investigation with MRI or arthroscopy in order to confirm it. This anatomical variant risks over-treatment if treatment were based purely on the presence of tibiofibular overlap, with the subsequent costs and morbidity. This study shows that it is possible to have no overlap in an asymptomatic ankle. We therefore suggest that no overlap may represent anatomical variation, in cases in which injury is not demonstrated on further testing with CT, MRI or arthroscopy.
We acknowledge that the population is age-biased; however, obtaining a large number of ankle CT scans for which the primary reason is not ankle pathology in a younger population was not possible. We do not believe that advancing age would increase the prevalence of the condition. If anything, the variant could become less prevalent given increasing degenerative changes and formation of osteophytes. However, this study looks at overlap in the skeletally mature population only.
Conclusions
We found that the absence of overlap between the distal tibia and fibula exists in the normal asymptomatic population, with an incidence in our study of 1.23%. These patients had no history of previous ankle trauma, surgery or pain, suggesting that this is an anatomical variant. When other diagnostic modalities such as MRI or arthroscopy are not available to confirm or deny disruption of the syndesmosis, or intra-operative testing shows a stable syndesmosis, we recommend plain film imaging or dynamic fluoroscopy of the contralateral limb to screen for the presence of this uncommon variant.
1 Zalavras C , ThordarsonD. Ankle syndesmotic injury. J Am Acad Orthop Surg2007;15:330–339.CrossrefPubMed Google Scholar
2 Pettrone FA , GailM, PeeD, FitzpatrickT, Van HerpeLB. Quantitative criteria for prediction of the results after displaced fracture of the ankle. J Bone Joint Surg [Am]1983;65-A:667–677.PubMed Google Scholar
3 Nielson JH , GardnerMJ, PetersonMG, et al.Radiographic measurements do not predict syndesmotic injury in ankle fractures: an MRI study. Clin Orthop2005;436:216–221. Google Scholar
4 Pneumaticos SG , NoblePC, ChatziioannouSN, TrevinoSG. The effects of rotation on radiographic evaluation of the tibiofibular syndesmosis. Foot Ankle Int2002;23:107–111.CrossrefPubMed Google Scholar
5 Ebraheim NA , LuJ, YangH, MekhailAO, YeastingRA. Radiographic and CT evaluation of tibiofibular syndesmotic diastasis: a cadaver study. Foot Ankle Int1997;18:693–698.CrossrefPubMed Google Scholar
6 Ebraheim NA , ElgafyH, PadanilamT. Syndesmotic disruption in low fibular fractures associated with deltoid ligament injury. Clin Orthop2003;409:260–267.CrossrefPubMed Google Scholar
7 Oae K , TakaoM, NaitoK, et al.Injury of the tibiofibular syndesmosis: value of MR imaging for diagnosis. Radiology2003;227:155–161.CrossrefPubMed Google Scholar
8 Takao M , OchiM, OaeK, NaitoK, UchioY. Diagnosis of a tear of the tibiofibular syndesmosis: the role of arthroscopy of the ankle. J Bone Joint Surg [Br]2003;85-B:324–329. Google Scholar
9 Xenos JS , HopkinsonWJ, MulliganME, OlsonEJ, PopovicNA. The tibiofibular syndesmosis: evaluation of the ligamentous structures, methods of fixation, and radiographic assessment. J Bone Joint Surg [Am]1995;77-A:847–856. Google Scholar
10 Elgafy H , SemaanHB, BlessingerB, WassefA, EbraheimNA. Computed tomography of normal distal tibiofibular syndesmosis. Skeletal Radiol2010;39:559–564.CrossrefPubMed Google Scholar
11 Beumer A , van HemertWL, NiesingR, et al.Radiographic measurement of the distal tibiofibular syndesmosis has limited use. Clin Orthop2004;423:227–234.CrossrefPubMed Google Scholar
12 Stoffel K , WysockiD, BaddourE, NichollsR, YatesP. Comparison of two intraoperative assessment methods for injuries to the ankle syndesmosis: a cadaveric study. J Bone Joint Surg [Am]2009;91-A:2646–2652. Google Scholar
13 Chauhan SK , ClarkGW, LloydS, et al.Computer-assisted total knee replacement: a controlled cadaver study using a multi-parameter quantitative CT assessment of alignment (the Perth CT Protocol). J Bone Joint Surg [Br]2004;86-B:818–823. Google Scholar
14 Brage ME , BennettCR, WhitehurstJB, GettyPJ, ToledanoA. Observer reliability in ankle radiographic measurements. Foot Ankle Int1997;18:324–329.CrossrefPubMed Google Scholar
15 Hermans JJ , BeumerA, de JongTA, KlienrensinkGJ. Anatomy of the distal tibiofibular syndesmosis in adults: a pictorial essay with a multimodality approach. J Anat2010;217:633–645.CrossrefPubMed Google Scholar
16 Harper MC . An anatomic and radiographic investigation of the tibiofibular clear space. Foot Ankle1993;14:455–458.CrossrefPubMed Google Scholar
Funding statement:
None declared
Author contributions:
B. Sowman: Author, Study design, Data collection
R. Radic: Data collection
M. Kuster: Study design, Advice
P. Yates: Study design, Advice
B. Breidiel: Radiological advice
S. Karamfilef: Data collection, Image manipulation
ICMJE Conflict of Interest:
None declared
©2012 British Editorial Society of Bone and Joint Surgery. This is an open-access article distributed under the terms of the Creative Commons Attributions licence, which permits unrestricted use, distribution, and reproduction in any medium, but not for commercial gain, provided the original author and source are credited.
