


Abstract
Aims
The cemented Oxford unicompartmental knee arthroplasty (OUKA) features two variants: single and twin peg OUKA. The purpose of this study was to assess the stability of both variants in a worst-case scenario of bone defects and suboptimal cementation.
Methods
Single and twin pegs were implanted randomly allocated in 12 pairs of human fresh-frozen femora. We generated 5° bone defects at the posterior condyle. Relative movement was simulated using a servohydraulic pulser, and analyzed at 70°/115° knee flexion. Relative movement was surveyed at seven points of measurement on implant and bone, using an optic system.
Results
At the main fixation zone, the twin peg shows less relative movement at 70°/115°. At the transition zone, relative movements are smaller for the single peg for both angles. The single peg shows higher compression at 70° flexion, whereas the twin peg design shows higher compression at 115°. X-displacement is significantly higher for the single peg at 115°.
Conclusion
Bony defects should be avoided in OUKA. The twin peg shows high resilience against push-out force and should be preferred over the single peg.
Cite this article: Bone Joint Res 2022;11(2):82–90.
Article summary
-
Bone defects can occur preoperatively as well as intraoperatively. It is crucial to determine whether both variants of peg design in the Oxford unicompartmental knee arthroplasty (OUKA) exhibit comparable stability in defect situations.
-
In this experimental study, the influence of peg design on implant stability was assessed, using an experimental cadaver model. A bone defect at the posterior condyle was artificially created to allow the study of implant stability in a worst-case scenario.
Key messages
-
The OUKA shows complex behaviour when implanted in a knee with a bone defect at the posterior condyle. Both single and twin peg designs show high micromotion, with the twin peg exhibiting less micromotion at the main fixation zone around the peg area and the anterior shield.
Strengths and limitations
-
This study was an experimental cadaver study, so neither bleeding nor kinematics could be simulated.
-
Micromotion was only assessed at 70° and 115° flexion.
-
Although kinematics could not be simulated, results could be obtained in a very standardized manner for the two tested settings.
-
This study shows good evidence that the additional peg could indeed be an advantage in defect situation.
Introduction
Due to demographic changes, osteoarthritis (OA) is an increasing problem in industrial nations,1,2 the knee being the most commonly affected site.3 For isolated medial OA of the knee, unicompartmental knee arthroplasty (UKA) is a widely used treatment option and comprises 7% to 13.3% of all primary knee arthroplasties.4-7 While UKAs such as the Oxford UKA (OUKA, Zimmer Biomet, UK) show excellent long-term results,5,8-12 it has been noted that UKAs show higher revision rates than total knee arthroplasties (TKAs).5,13,14 Aseptic loosening – described as mechanical failure of the bone/cement or the cement/implant interface – of one or both components is among the most common reasons for revision surgery, accounting for 27%4 to 37.6%7 in large cohort studies; femoral aseptic loosening is described to occur more often than the tibial loosening.15-18 However, factors such as component alignment19 or tibiofemoral conformity20 also impact clinical outcomes.
The twin peg design of the OUKA was introduced to improve primary stability by adding a second smaller peg. Additionally, it provides rotational stability and allows for a higher flexion, as the arc of the implant was increased by 15° (Figure 1). In an experimental cadaver study, both designs of the OUKA showed equal stability.21 This was, however, assessed in an ideal laboratory setting with an optimal surgical result and highly standardized cementing. It is known that the success of UKA is highly dependent on the expertise of the surgeon performing the procedure.22,23 This observation is confirmed by results of Clarius et al,24 obtained during an instructional course, showing a variety of sawing errors produced by inexperienced surgeons. Apart from sawing errors, bony defects of the condyle can also be caused by spontaneous osteonecrosis of the knee ((SONK), Ahlbaeck’s disease) as well as removal of large posterior osteophytes. Furthermore, the posterior plane facet of the femoral component is known to be the weak spot of cementation.25 Insufficient cementation, however, can lead to early loosening of endoprosthetic components and persistent knee pain, causing worse outcome and shorter survival time.

Fig. 1
Comparison of the single and twin peg Oxford unicompartmental knee arthroplasty. The twin peg design contains an additional peg and wider radius (dark grey). The single peg design (light grey) features a smaller circumference than the twin peg.
In this experimental cadaver study, we aimed to assess differences of primary stability in single and twin peg OUKA in bones with bony defects of the posterior medial condyle in addition to suboptimal cementing on the posterior plane facet. We hypothesized that the second peg would positively influence the primary stability under adverse conditions.
Methods
In 12 paired fresh-frozen human femora, medial OUKA was performed by an experienced surgeon (RGB) with the original Oxford Phase III instrumentation. Exclusion criteria for donors were bone tumours or other known malignancies, infectious diseases (e.g. HIV, Hepatitis C), and previous surgical procedures involving the knees.
Bone mineral density (BMD) was assessed by dual energy X-ray absorptiometry (DXA) using the bone densitometer Hologic QDR-2000 (Hologic, USA). The respective femora of each pair were randomly assigned to study group A (single peg) or study group B (twin peg) using a computer-generated list compiled by Randlist 1.2 (Datinf GmbH, Germany). Pre- and postoperative anterior and lateral radiographs were obtained. Prior to implantation, digital planning of the procedure was conducted using TraumaCad (Voyant Health, Israel). In three pairs, a large OUKA was used, and nine pairs were planned for a medium-sized OUKA. In both study groups, similar implant sizes were used in each pair of femora.
The femoral cutting block of the original instrumentation was modified to achieve a standardized 5° bone defect (Figure 2). An angle of 5° for worst-case simulation of the femoral bone defect was chosen as it represents the maximal bone defect seen by Clarius et al24 in their series of sawbone preparations. Eight anchorage holes were drilled around the central peg hole.25 Bone lavage was performed using OptiLavage (Biomet Cement and Cementing Systems, Sweden). A total of 500 ml of 0.9% sodium chloride solution was used to clean the cancellous bone. Prior to cementation, the specimens were cut to a length of 13 cm measured from the distal tip of the medial condyle.
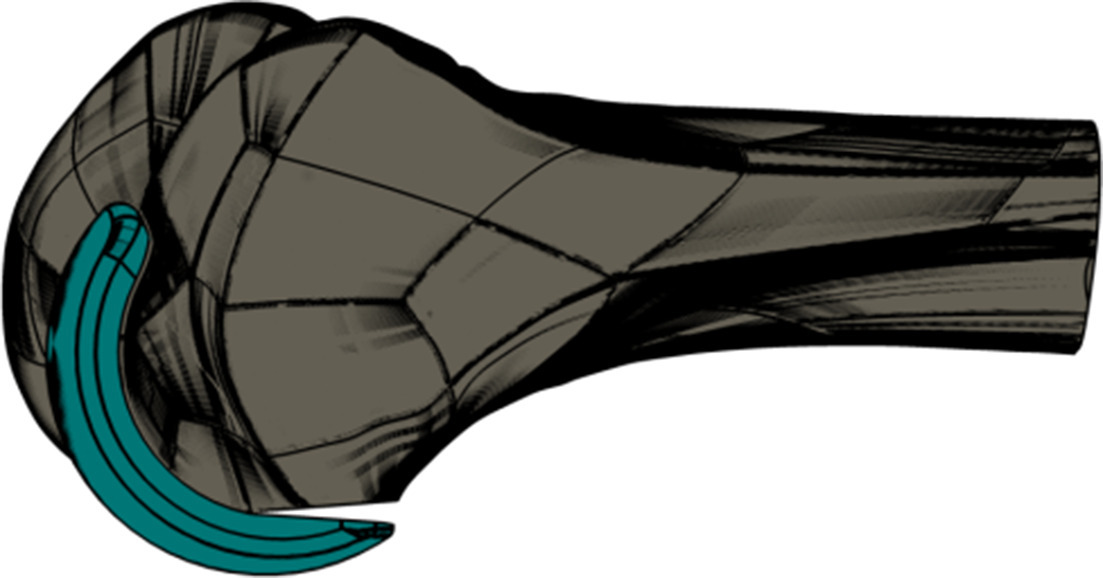
Fig. 2
Schematic illustration of the bone defect. A 5° saw cut was chosen to simulate bone defects without cement penetration as a worst-case scenario.
Cementation was realized under standardized conditions at 45° flexion, 180 N compression force,26 using Hi-Fatigue G Bone Cement (Zimmer Biomet, USA). The mean room temperature was 20.1°C (standard deviation (SD) 0.3), and mean humidity was 28.3% (SD 8.3%). Cement was used according to the manufacturer’s instructions. After cementation, the specimens were embedded in a casting mould, using polyurethane (RenCast FC 53 A/B, Huntsman Advanced Materials, Switzerland). As the present study was planned as a worst-case scenario, care was taken to create a suboptimal cement mantle at the posterior condyle (i.e. no immediate contact between cement and bone; a phase II saw guide with a 5° angle attached was used to ensure no adhesion would form).
Specimens were mounted into a hydraulic testing machine (Bosch Rexroth, Germany) and physiological-like loading conditions were applied. The load was applied at 70° and 115° knee flexion, simulating two activities of daily life: rising from a chair and deep squatting. The loads of 70° and 115° were chosen, as the force vector is directed onto the posterior part of the condyle where the artificial bone defect was created. While rising from a chair, the highest force (2.5 × body weight) is measured at a knee flexion angle of 70°, with a medial to lateral load ratio of 2.2:1. The highest medial to lateral load ratio reached while deep squatting is measured at 115° knee flexion (7.6:1) with a force that reaches 78% of the peak force (resembling approximately 2.1 × body weight) measured for this activity.27 The force was applied donor-dependently to account for differences in body weight (44.4 kg to 145.1 kg). The specimens were loaded sinusoidally with a frequency of 1 Hz for 10,000 cycles, according to the respective medial to lateral load ratio using an integrated rocker bearing, allowing for the donor-specific adjustment of the COR (Figure 3).

Fig. 3
General setup of testing station. The servohydraulic pulser was equipped with a shearing force compensation (a), as well as an integrated rocker bearing (b) allowing for donor-specific adjustment.
The experimental setup was adapted based on the setup used by Reiner et al.21 The relative motion between bone and implant was measured and analyzed using an optical measurement device (PONTOS, Gesellschaft für optische Messtechnik mbH, Germany). The terms ‘relative motion’ and ‘relative movement’ in this study represent the resulting relative motion with six degrees of freedom. Whenever a singular degree of freedom is specifically assessed, it is marked accordingly. Measurements were obtained prior to loading (as a reference) and then automatically triggered at 100, 200, 500, 1,000, and then every 1,000 cycles until the end of the test at 10,000 cycles. For each measurement, 60 pictures were taken by the two integrated high-resolution cameras with 15 frames per second. Seven markers were placed on femoral component and bone (points of measurement (POM) 1 to 7, Figure 4), respectively, and with a special software (PONTOS, Gesellschaft für optische Messtechnik mbH), relative motion between the associated marker points was analyzed.21

Fig. 4
Standardized application of marker points. Seven marker points were applied to implant and bone respectively. We define three zones of fixation: green – main fixation zone, red – transition zone, grey – defect zone. Blue dotted line indicates the connection between points of measurements (POMs) 1 and 7, which were used for the approximation of the implant compression. Blue dot indicates application of force at 70° flexion; red dot indicates application of force at 115° flexion.
To further characterize the movement of the two designs, the resulting relative motion was broken down into the individual degrees of freedom, and the motion along the x-axis (defined as the axis of the peg) was analyzed. Additionally, we measured the compression of the femoral component by approximation, analyzing the changes in the distance between POM 1 (anterior) and POM 7 (posterior).
The implants were kindly provided by Zimmer-Biomet. Sponsoring bodies did not take part in study design, analysis, or interpretation of the study data. The study was ethically approved by the local ethics committee, prior to the start of the study (S 328/2014).
Statistical analysis
The cohort size was chosen following a previous study by Jaeger et al,28 who measured micromotion and subsidence of a tibial component under cyclical loading as well as the aforementioned study by Reiner et al.21 Of the 12 prepared pairs of femora, four pairs had to be excluded from the analysis at 115° knee flexion, as one of the respective femora fractured early during this measurement.
Descriptive analysis, as well as Wilcoxon’s matched pair signed-ranks test, was conducted to investigate statistically significant differences between the study groups A and B. The alpha-level was chosen as 0.05 for all analyses.
The maximal relative motion between corresponding marker POMs 1 and 7 was averaged for the 12 (70°) and eight (115°) paired femora, respectively. In the context of femoral bone defects, we defined three zones of fixation, with different fixation characteristics: the anterior main fixation zone, the intermediate transition zone, and the posterior defect zone (Figure 4). To account for those different fixation patterns, we calculated the mean maximal relative motion for the three anterior POMs, situated in the main fixation zone as well as the defect zone.
Implant movement is generally composed of different types of movement, a dynamic (i.e. reversible) and a plastic (i.e. irreversible) movement. In this study, we do not look at these different types of movement, but rather the maximal relative movement without differentiation.
For statistical analysis, SPSS v25 (IBM, USA) and Microsoft Excel (Microsoft, USA) were used. Two-tailed p-values below 0.05 were assumed to denote statistical significance.
Results
The specimens showed no significant difference in BMD between left and right hip (T-score left hip: -1.89 (SD 1.13), T-score right hip: -1.88 (SD 1.17), p = 0.859, Wilcoxon’s matched pair signed-ranks test).
At 70° knee flexion, the single peg design exhibited significantly higher relative motion at POM 1 and 2. Further towards the bony defect zone, at POM 3 and 4, the twin peg design showed significantly higher relative motion (p = 0.010, Wilcoxon’s matched pair signed-ranks test). The composite main fixation zone (POM 1 to 3) showed in total a significantly higher relative motion for the single peg design (Table I, Figure 5). This was consistent over the whole measuring period (Figure 6).
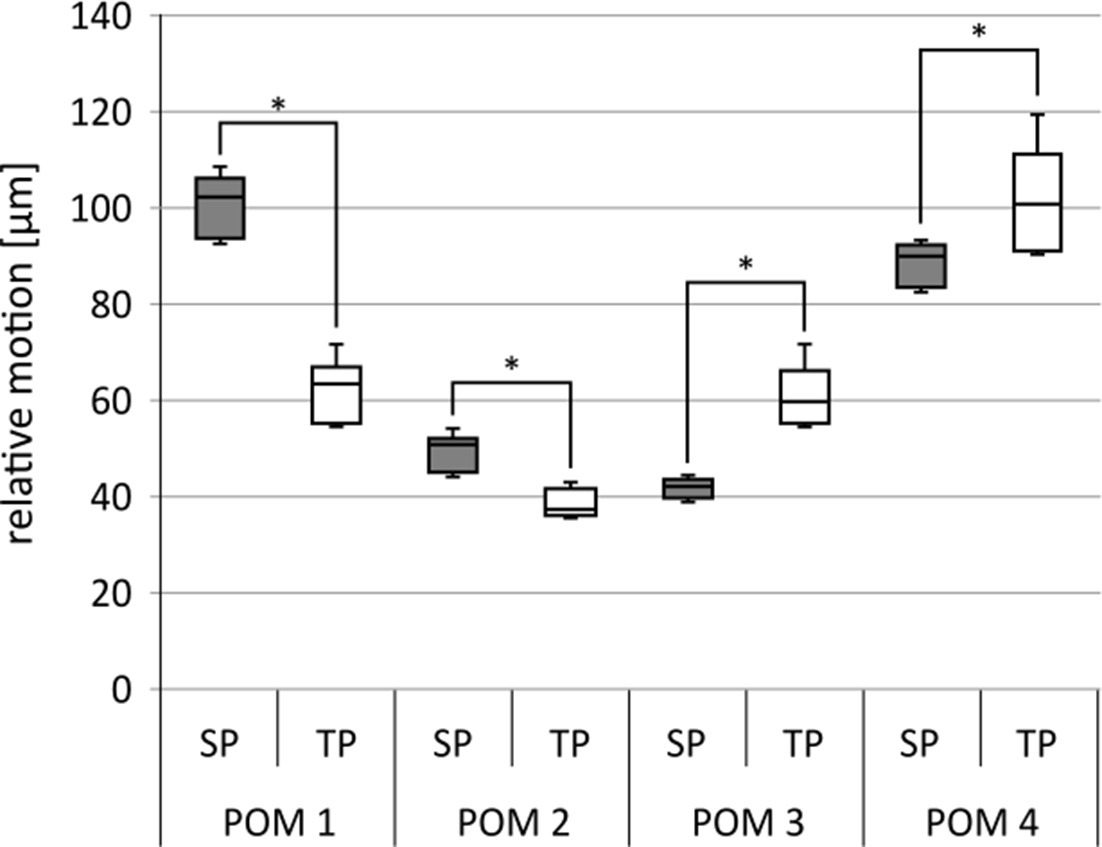
Fig. 5
Relative motion at 70° for point of measurement (POM) 1 to 4. SP, single peg; TP, twin peg. *p < 0.05. N = 12.
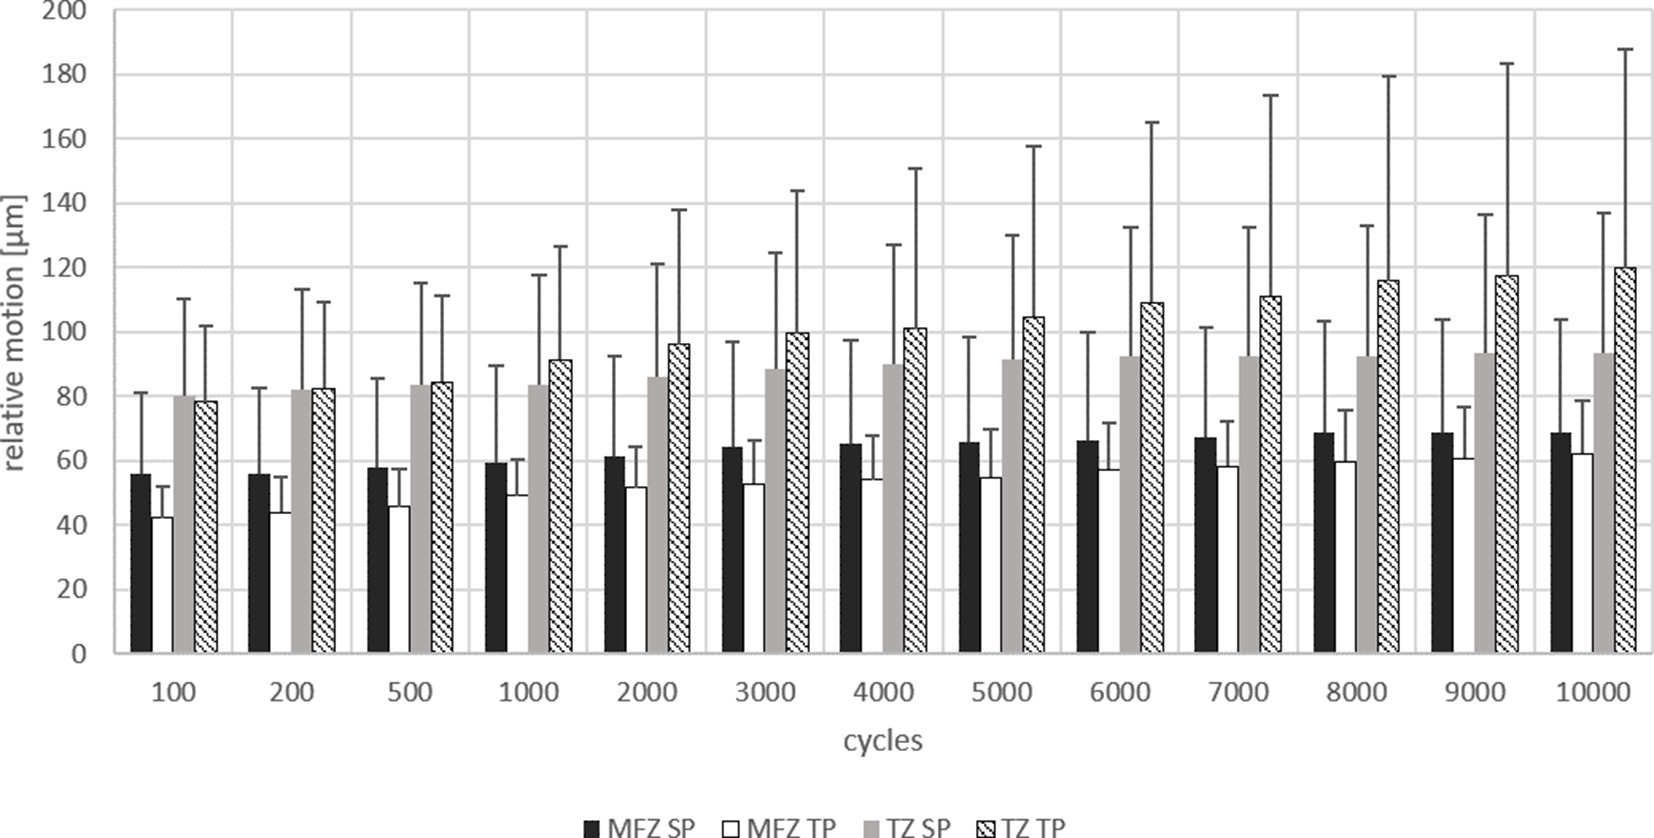
Fig. 6
Maximum relative motion at 70° over 10,000 cycles. Relative motion shown at main fixation zone (MFZ) and transition zone (TZ) for single peg (SP) and twin peg (TP) design over 10,000 cycles at 70° knee flexion. N = 12.
Table I.
Maximal relative motion at 70° knee flexion.
| Zone | Single peg | Twin peg | p-value* |
|---|---|---|---|
| POM 1 | 0.009 | ||
| Mean measurement, µm (SD; range) | 100 (8; 85 to 109) | 62 (8; 49 to 72) | |
| POM 2 | 0.009 | ||
| Mean measurement, µm (SD; range) | 49 (5; 42 to 54) | 38 (4; 31 to 43) | |
| POM 3 | 0.009 | ||
| Mean measurement, µm (SD; range) | 42 (2; 39 to 45) | 60 (8; 47 to 72) | |
| POM 4 (transition) | 0.009 | ||
| Mean measurement, µm (SD; range) | 89 (5; 80 to 94) | 101 (14; 78 to 120) | |
| POM 1 to 3 (main fixation) | 0.009 | ||
| Mean measurement, µm (SD; range) | 64 (5; 56 to 69) | 53 (7; 42 to 62) |
-
*
Wilcoxon’s matched pair signed-ranks test.
-
POM, point of measurement; SD, standard deviation.
At 115° knee flexion, as mentioned above, during the loading, four of the specimens fractured and subsequently had to be excluded from further analysis. In this setting, the single peg design also showed significantly higher relative motion at the anterior POM 1 and 2, as well as the main fixation zone. At POM 3 and at the transition zone (POM 4), the twin peg design exhibited significantly higher relative motion (Table II, Figure 7). Again, this was consistent throughout the measuring period (Figure 8).
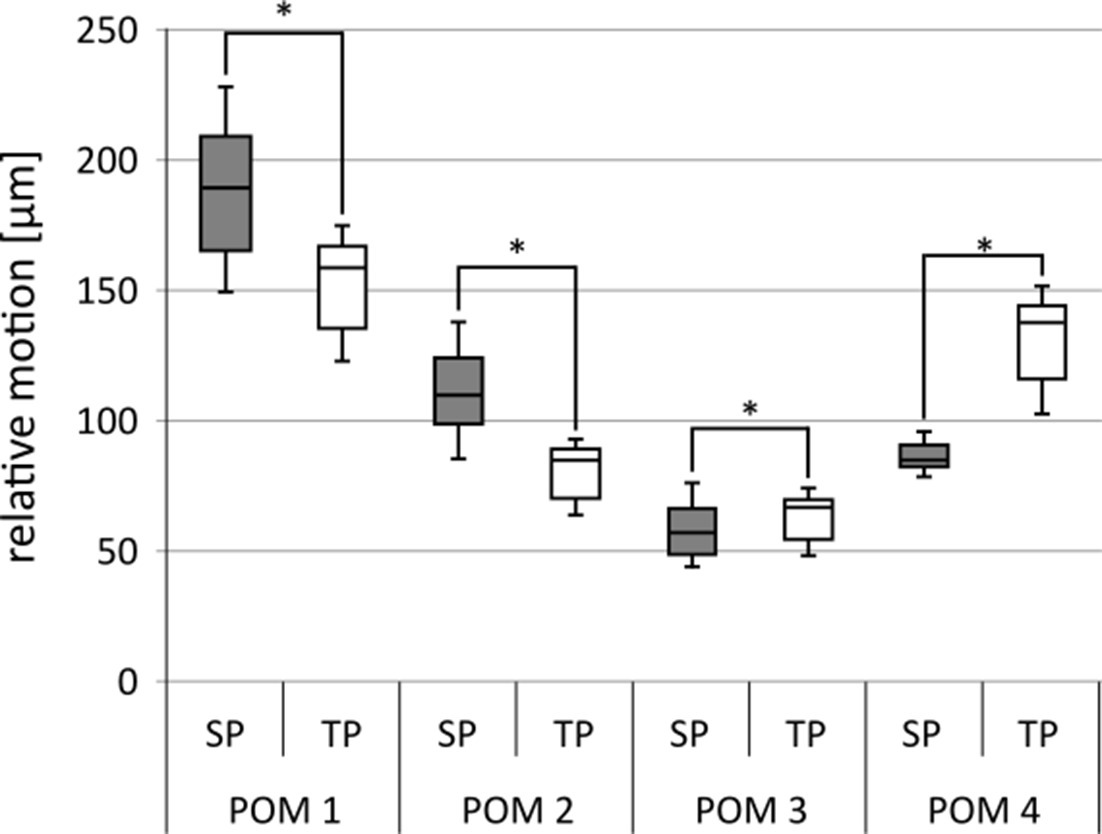
Fig. 7
Relative motion at 115° point of measurement (POM) 1 to 4. SP, single peg; TP, twin peg. *p < 0.05. N = 8.
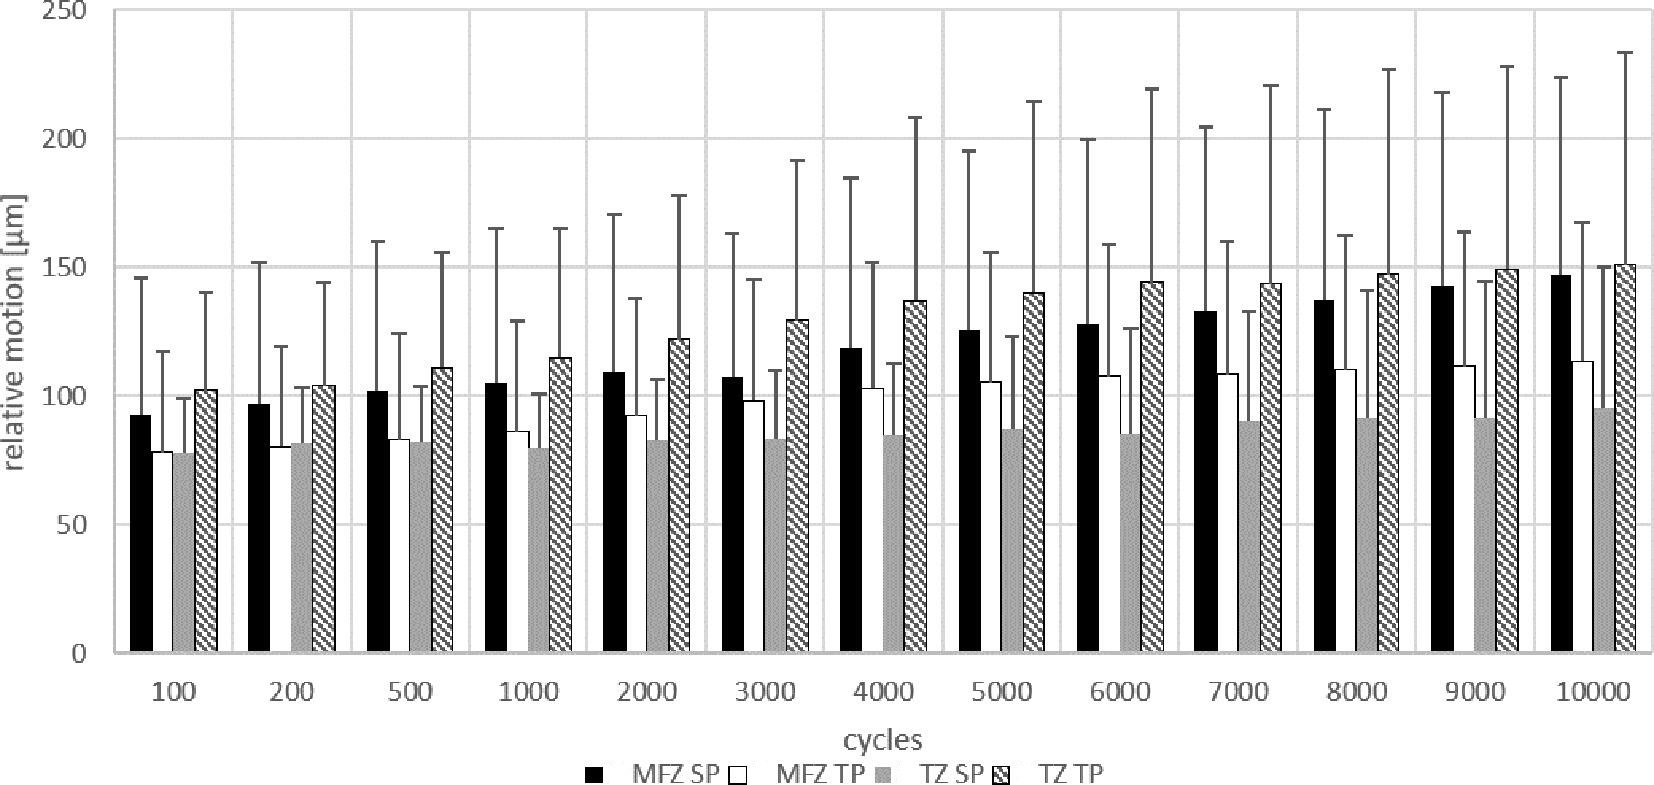
Fig. 8
Maximum relative motion at 115° over 10,000 cycles. Relative motion shown at main fixation zone (MFZ) and transition zone (TZ) for single peg (SP) and twin peg (TP) design over 10,000 cycles at 115° knee flexion. N = 8.
Table II.
Maximal relative motion at 115° knee flexion.
| Zone | Single peg | Twin peg | p-value* |
|---|---|---|---|
| POM 1 | < 0.01 | ||
| Mean measurement, µm (SD; range) | 188 (27; 149 to 228) | 152 (19; 123 to 175) | |
| POM 2 | < 0.01 | ||
| Mean measurement, µm (SD; range) | 111 (17; 85 to 138) | 80 (11; 64 to 93) | |
| POM 3 | < 0.01 | ||
| Mean measurement, µm (SD; range) | 58 (10; 44 to 76) | 63 (9; 48 to 74) | |
| POM 4 (transition) | < 0.01 | ||
| Mean measurement, µm (SD; range) | 86 (5; 78 to 95) | 133 (16; 104 to 151) | |
| POM 1 to 3 (main fixation) | < 0.01 | ||
| Mean measurement, µm (SD; range) | 119 (18; 93 to 147) | 98 (13; 78 to 114) |
-
*
Wilcoxon’s matched pair signed-ranks test.
-
POM, point of measurement; SD, standard deviation.
The measuring points around the defect area (POM 5, 6, and 7, and POM 5 to 7 combined) were also analyzed for relative motion. At 70° flexion, measurements at POM 5 showed similar results for single peg and twin peg. For POM 6, the single peg showed significantly higher measurements than the twin peg. That was consistent with the data at POM 7, which showed significantly higher relative movement for the single peg. POM 5 to 7 combined exhibited higher relative motion for the single peg as well (Table III). At 115° flexion, the twin peg consistently showed higher measurements for all the POM as well as for the combined POM 5 to 7 (Table IV).
Table III.
Maximal relative motion at 70°. Defect Zone.
| Zone | Single peg | Twin peg | p-value* |
|---|---|---|---|
| POM 5 | 0.600 | ||
| Mean measurement, µm (SD) | 139 (8) | 141 (19) | |
| POM 6 | 0.013 | ||
| Mean measurement, µm (SD) | 187 (12) | 177 (24) | |
| POM 7 | 0.001 | ||
| Mean measurement, µm (SD) | 217 (14) | 191 (24) | |
| POM 5 to 7 (Defect zone) | 0.007 | ||
| Mean measurement, µm (SD) | 181 (11) | 170 (22) |
-
*
Wilcoxon’s matched pair signed-ranks test.
-
POM, point of measurement; SD, standard deviation.
Table IV.
Maximal relative motion at 115°. Defect Zone.
| Zone | Single peg | Twin peg | p-value* |
|---|---|---|---|
| POM 5 | 0.001 | ||
| Mean measurement, µm (SD) | 159 (12) | 203 (26) | |
| POM 6 | 0.001 | ||
| Mean measurement, µm (SD) | 232 (20) | 273 (35) | |
| POM 7 | 0.002 | ||
| Mean measurement, µm (SD) | 281 (26) | 317 (41) | |
| POM 5 to 7 (Defect zone) | 0.001 | ||
| Mean measurement, µm (SD) | 231 (18) | 264 (34) |
-
*
Wilcoxon’s matched pair signed-ranks test.
-
POM, point of measurement; SD, standard deviation.
The measurement of the implant compression revealed a significantly higher minimal (which corresponded to the moment of load removal) as well as maximal compression of the single peg at 70° knee flexion (p = 0.010, Wilcoxon’s matched pair signed-ranks test). Likewise, the difference (δ) was significantly higher for the single peg. At 115°, the proportions reversed and the twin peg showed significantly higher maximal compression (p = 0.017, Wilcoxon’s matched pair signed-ranks test), as well as a higher δ. Minimal compression at 115° was not significantly different (p = 0.056, Wilcoxon’s matched pair signed-ranks test) (Table V, Figure 9).
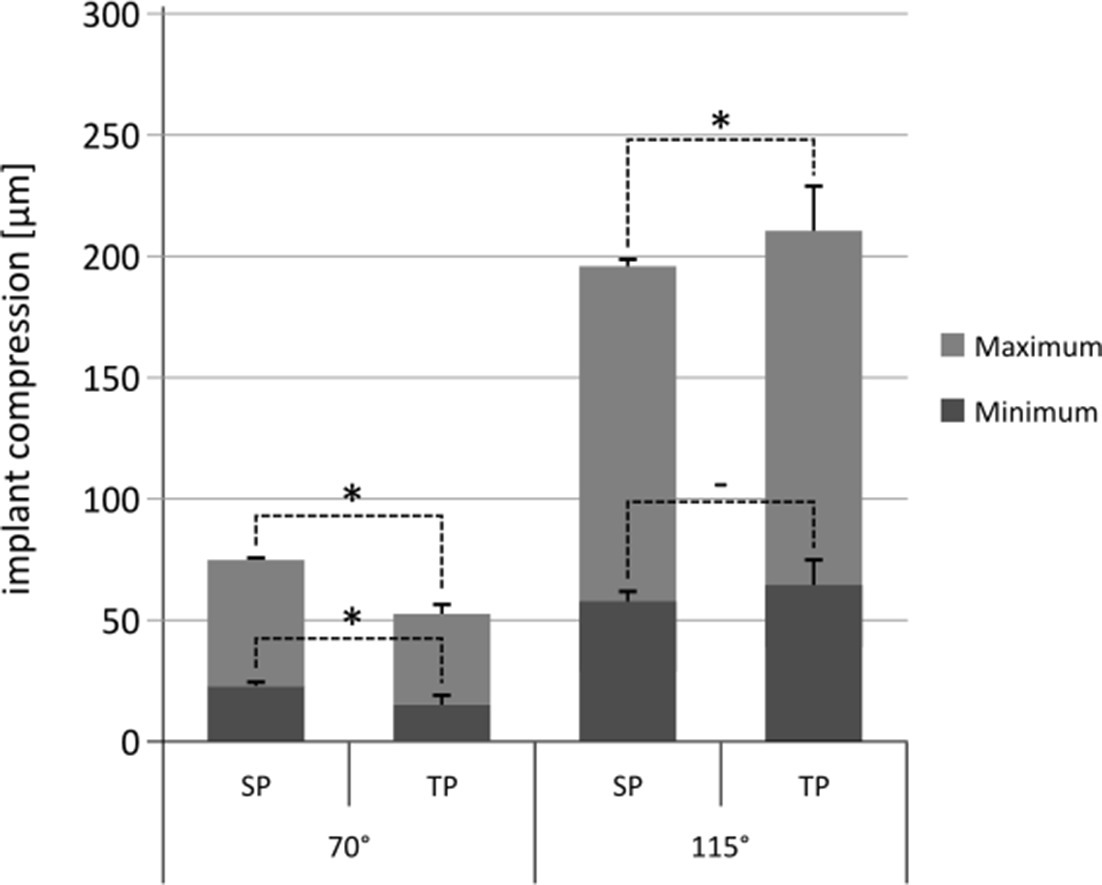
Fig. 9
Implant compression shown for single peg (SP) and twin peg (TP) design for 70° (n = 12) and 115° (n = 12) knee flexion. *p < 0.05; "–" denotes a p-value > 0.05.
Table V.
Implant compression.
| Flexion | Compression | Single peg | Twin peg | p-value* |
|---|---|---|---|---|
| 70° | Minimum | < 0.01 | ||
| Mean measurement, µm (SD; range) | 23 (2; 20 to 25) | 16 (4; 10 to 21) | ||
| Maximum | < 0.01 | |||
| Mean measurement, µm (SD; range) | 75 (2; 72 to 77) | 53 (7; 42 to 62) | ||
| δ | < 0.01 | |||
| Mean measurement, µm (SD; range) | 52 (1; 51 to 53) | 37 (3; 32 to 41) | ||
| 115° | Minimum | 0.056 | ||
| Mean measurement, µm (SD; range) | 59 (3; 53 to 64) | 64 (10; 47 to 76) | ||
| Maximum | 0.017 | |||
| Mean measurement, µm (SD; range) | 195 (3; 192 to 203) | 210 (18; 182 to 230) | ||
| δ | 0.013 | |||
| Mean measurement, µm (SD; range) | 136 (3; 133 to 141) | 145 (8; 134 to 154) |
-
*
Wilcoxon’s matched pair signed-ranks test.
-
SD, standard deviation; δ, difference (maximum – minimum).
The mean x-deviation at 115° was significantly higher for single pegs measured at the main fixation zone throughout the measurement (Table VI; Figure 10), revealing a higher push-out movement for the single peg design. Figure 11 depicts the displacement vectors for the single and twin peg; the single peg shows higher displacement for all POMs.

Fig. 10
X-displacement at 115° for main fixation zone (point of measurement (POM) 1 to 3). The mean displacement on the x-axis is shown for single peg (SP) and twin peg (TP) at 115° flexion for the main fixation zone. N = 8.

Fig. 11
a) Displacement vectors for the twin peg. b) Displacement vectors for the single peg at 115° (c80011; vectors shown with factor 10 for demonstrative purposes). The single peg shows higher displacement over all point of measurements (POMs).
Table VI.
X-displacement at 115° at the main fixation zone.
| Measurement | Single peg | Twin peg | p-value* |
|---|---|---|---|
| Mean, µm (SD; range) | 80 (15; 56 to 103) | 46 (7; 35 to 55) | < 0.01 |
-
*
Wilcoxon’s matched pair signed-ranks test.
-
SD, standard deviation.
Discussion
The outcome of OUKA is highly surgeon-dependent and correlates significantly with the number of cases.23 Reiner et al21 showed that in an ideal, controlled environment, single peg and twin peg OUKA do not exhibit different characteristics concerning primary stability. However, they note that primary stability, apart from being influenced by the design itself, can be affected by surgical technique and penetration of cement – issues that we aimed to address in this study. To our knowledge, no study has been published describing the correlation of adverse conditions with primary stability in the two designs of the OUKA.
The relative motion we measured in this study was higher than in previously published data for UKA, particularly in 115° flexion. Reiner et al21 described micromotion between 10 μm and 57 μm, and Miskovsky et al29 measured between 11 μm and 61 μm. Our higher values were expected, given the large posterior defect we used to simulate suboptimal bone stock and surgical result. In an experimental animal model, Jasty et al30 identified the threshold for continuous micromotion allowing for osseointegration in cementless implants at 40 μm. For cemented implants, no scientifically proven thresholds exist. Both designs exhibited higher relative motion in this study, although not for every point of measurement. The area around the additional peg in particular showed significantly less relative motion in the twin peg design, albeit still more than 40 µm. The fact that the anterior portion of the OUKA was significantly more stable in the twin peg design needed further investigation, hence we assessed the compression of the implant designs to determine whether it might influence the relative motion, especially in the intermediate transition zone, which showed higher measurements for the twin peg design. Interestingly, at 70°, the twin peg exhibited less implant compression than the single peg; this might be explained by the fact that the effective point of force differed slightly for the two different designs. However, at 115°, the twin peg in turn showed higher implant compression. Thus, at high flexion, the twin peg seems to bend more. Combined with the information that the single peg showed a higher push-out movement (80 µm vs 46 µm; p = 0.010, Wilcoxon’s matched pair signed-ranks test) along the femoral axis, this seems to explain the higher resulting relative movement in the intermediate part of the femoral component of the twin peg design.
As expected, we observed a significant increase in relative motion in the POM 5 to 7 range for both groups investigated. We attribute the differences between the two groups in the posterior part to the different stabilities in the anterior and PEG fixation, respectively. Improved fixation at the anterior region may increase the relative movement and deformation at the posterior part of the implant. A higher relative motion anteriorly reduces the posterior relative motion and deformation. This is most evident with a load application of 115°.
Due to better integration at the anterior part (quite possibly due to the additional peg), the compression of the twin peg (especially at 115°) is higher, causing the twin peg to 'sink in' to the bone at the zone between main fixation and defect zone – the transition zone.
Out of 12 pairs tested, four had to be excluded due to fracture of one of the respective specimens. As mentioned before, the specimens were individually loaded using patients’ body weight. In the respective cases, the BMIs of the donors ranged between 32.7 kg/m2 and 53.3 kg/m2. It is safe to assume that, without any stabilizing function of adjacent joints, the continuous loading with a high force caused the femora to break. Of note, of the fractured femora, three had been implanted with a single peg OUKA.
There are some limitations to our study. First, we could not simulate bleeding. However, this aspect seems to be negligible, as in cemented knee arthroplasties the use of a tourniquet is recommended, and pulsatile lavage is used in vivo as well as in this study. Second, in order to minimize movement of the femora, a large portion had to be included in the polyurethane cast, causing a high constraint of the femora. This might have influenced the occurrence of the abovementioned fractures. Third, the setting for the experimental setup was derived from an elaborate study by Mündermann et al27 with an instrumented total knee arthroplasty. In this study, an instrumented TKA in a 81-year-old patient was used to determine loading and loading ratios in the knee. While we adapted these conditions for our setup, it has to be noted that UKA patients are on average 60 to 65 years old,31-33 which is younger than the 81-year-old patient in the study. Also, UKA allows for movement of the femoral condyle on the medial tibial compartment, and the anterior cruciate ligament is still in place; for this reason, the kinematics are closer to the physiological kinematics of the knee than those of a TKA.34,35 We only measured relative motion in 70° and 115° knee flexion in this experimental setup; relative motion during regular movement will exhibit more complex patterns. Nonetheless, the data obtained in our experiments are valid, as we minimized the influence of the abovementioned effects by using paired specimen.
In our data, the twin peg design seems to be more stable than the single peg design. The increasing magnitude of the measurement towards the posterior part of the implant can be explained by the bone defect. Also, UKAs are increasingly used in patients with spontaneous osteonecrosis of the knee,36-38 a condition in which, by definition, bad bone stock can be assumed.
In conclusion, the twin peg design of the OUKA seems to exhibit less relative motion, albeit not over the whole radius, which can be explained by the differential fixation pattern and the higher push-out movement of the single peg design. Also, the amplitude of the relative motion was high in both cases, especially for 115° knee flexion. This underlines the importance of a proper bony fixation and cementation, respectively, at the posterior condyle. Nevertheless, surgical procedure and loss of bone stock are comparable for the two designs. Additionally, with its larger radius, the twin peg design allows for a higher flexion. Hence, the twin peg design seems to be the more logical decision when performing OUKA surgery. The hypothesis, that the second peg positively influences the primary stability under adverse conditions, can be accepted.
References
1. Murphy L , Schwartz TA , Helmick CG , et al. Lifetime risk of symptomatic knee osteoarthritis . Arthritis Rheum . 2008 ; 59 ( 9 ): 1207 – 1213 . Crossref PubMed Google Scholar
2. Zhang Y , Jordan JM . Epidemiology of osteoarthritis . Clin Geriatr Med . 2010 ; 26 ( 3 ): 355 – 369 . Crossref PubMed Google Scholar
3. Felson DT , Nevitt MC . Epidemiologic studies for osteoarthritis: New versus conventional study design approaches . Rheum Dis Clin North Am . 2004 ; 30 ( 4 ): 783 – 797 . Crossref PubMed Google Scholar
4. No authors listed . National Joint Registry for England, Wales and Northern Ireland Annual Report . 2020 . https://reports.njrcentre.org.uk/Portals/10/PDFdownloads/NJR%2017th%20Annual%20Report%202020.pdf ( date last accessed 9 December 2021 ). Google Scholar
5. Robertsson O , W-Dahl A , Lidgren L , Sundberg M . The Swedish Knee Arthroplasty Register Annual Report . 2017 . https://www.researchgate.net/profile/Annette-W-Dahl/publication/321301028_The_Swedish_Knee_Arthroplasty_Register_Annual_Report_2017/links/5a1aab9ea6fdcc50adeb1a60/The-Swedish-Knee-Arthroplasty-Register-Annual-Report-2017.pdf ( date last accessed 9 December 2021 ). Google Scholar
6. No authors listed . National competence service for joint prostheses and hip fractures ]. Helse Bergen Haukeland universitetssjukehus . 2017 . http://nrlweb.ihelse.net/eng/Rapporter/Report2017_english.pdf ( date last accessed 9 December 2021 ). [Article in Norwegian] Google Scholar
7. No authors listed . Hip, Knee & Shoulder Arthroplasty: 2020 Annual Report . Australian Orthopaedic Association National Joint Replacement Registry . 2020 . https://aoanjrr.sahmri.com/documents/10180/689619/Hip%2C+Knee+%26+Shoulder+Arthroplasty+New/6a07a3b8-8767-06cf-9069-d165dc9baca7 ( date last accessed 5 January 2022 ). Google Scholar
8. Murray DW , Goodfellow JW , O’Connor JJ . The Oxford medial unicompartmental arthroplasty: a ten-year survival study . J Bone Joint Surg Br . 1998 ; 80-B ( 6 ): 983 – 989 . Crossref PubMed Google Scholar
9. Price AJ , Webb J , Topf H , et al. Rapid recovery after Oxford unicompartmental arthroplasty through a short incision . J Arthroplasty . 2001 ; 16 ( 8 ): 970 – 976 . Crossref PubMed Google Scholar
10. Price AJ , Waite JC , Svard U . Long-term clinical results of the medial Oxford unicompartmental knee arthroplasty . Clin Orthop Relat Res . 2005 ; 435 : 171 – 180 . Crossref PubMed Google Scholar
11. Bergeson AG , Berend KR , Lombardi AJ , Hurst JM , Morris MJ , Sneller MA . Medial mobile bearing unicompartmental knee arthroplasty . J Arthroplasty . 2013 ; 28 ( 9 Suppl ): 172 – 175 . Google Scholar
12. Burnett RS , Nair R , Hall CA , Jacks DA , Pugh L , McAllister MM . Results of the Oxford phase 3 mobile bearing medial unicompartmental knee arthroplasty from an independent center: 467 knees at a mean 6-year follow-up: analysis of predictors of failure . J Arthroplasty . 2014 ; 29 ( 9 Suppl ): 193 – 200 . Crossref PubMed Google Scholar
13. No authors listed . Hip, Knee & Shoulder Arthroplasty: 2017 Annual Report . Australian Orthopaedic Association National Joint Replacement Registry . 2017 . https://aoanjrr.sahmri.com/documents/10180/397736/Hip%2C%20Knee%20%26%20Shoulder%20Arthroplasty ( date last accessed 9 December 2021 ). Google Scholar
14. No authors listed . National Joint Registry 14th Annual Report 2017 . National Joint Registry for England, Wales, Northern Ireland and the Isle of Man . 2017 . https://reports.njrcentre.org.uk/Portals/0/PDFdownloads/NJR%2014th%20Annual%20Report%202017.pdf ( date last accessed 9 December 2021 ). Google Scholar
15. Lewold S , Goodman S , Knutson K , Robertsson O , Lidgren L . Oxford meniscal bearing knee versus the marmor knee in unicompartmental arthroplasty for arthrosis. A Swedish multicenter survival study . J Arthroplasty . 1995 ; 10 ( 6 ): 722 – 731 . Crossref PubMed Google Scholar
16. Saldanha KAN , Keys GW , Svard UCG , White SH , Rao C . Revision of Oxford medial unicompartmental knee arthroplasty to total knee arthroplasty - results of a multicentre study . Knee . 2007 ; 14 ( 4 ): 275 – 279 . Crossref PubMed Google Scholar
17. Price AJ , Svard U . A second decade lifetable survival analysis of the Oxford unicompartmental knee arthroplasty . Clin Orthop Relat Res . 2011 ; 469 ( 1 ): 174 – 179 . Crossref PubMed Google Scholar
18. Robb CA , Matharu GS , Baloch K , Pynsent PB . Revision surgery for failed unicompartmental knee replacement: Technical aspects and clinical outcome . Acta Orthop Belg . 2013 ; 79 ( 3 ): 312 – 317 . PubMed Google Scholar
19. Sekiguchi K , Nakamura S , Kuriyama S , et al. Effect of tibial component alignment on knee kinematics and ligament tension in medial unicompartmental knee arthroplasty . Bone Joint Res . 2019 ; 8 ( 3 ): 126 – 135 . Crossref PubMed Google Scholar
20. Koh YG , Park KM , Lee HY , Kang KT . Influence of tibiofemoral congruency design on the wear of patient-specific unicompartmental knee arthroplasty using finite element analysis . Bone Joint Res . 2019 ; 8 ( 3 ): 156 – 164 . Crossref PubMed Google Scholar
21. Reiner T , Jaeger S , Schwarze M , Klotz MC , Beckmann NA , Bitsch RG . The stability of the femoral component in the Oxford unicompartmental knee replacement . Bone Joint J . 2014 ; 96-B ( 7 ): 896 – 901 . Crossref PubMed Google Scholar
22. Baker PN , Jameson SS , Deehan DJ , Gregg PJ , Porter M , Tucker K . Mid-term equivalent survival of medial and lateral unicondylar knee replacement: an analysis of data from a National Joint Registry . J Bone Joint Surg Br . 2012 ; 94-B ( 12 ): 1641 – 1648 . Crossref PubMed Google Scholar
23. Badawy M , Espehaug B , Indrekvam K , Havelin L , Furnes O . Higher revision risk for unicompartmental knee arthroplasty in low-volume hospitals . Acta Orthop . 2014 ; 85 ( 4 ): 342 – 347 . Crossref PubMed Google Scholar
24. Clarius M , Aldinger PR , Bruckner T , Seeger JB . Saw cuts in unicompartmental knee arthroplasty: An analysis of sawbone preparations . Knee . 2009 ; 16 ( 5 ): 314 – 316 . Crossref PubMed Google Scholar
25. Clarius M , Mohr G , Jaeger S , Seeger JB , Bitsch RG . Femoral fixation pattern in cemented Oxford unicompartmental knee arthroplasty--an experimental cadaver study . Knee . 2010 ; 17 ( 6 ): 398 – 402 . Crossref PubMed Google Scholar
26. Jaeger S , Helling A , Bitsch RG , Seeger JB , Schuld C , Clarius M . The influence of the femoral force application point on tibial cementing pressure in cemented UKA: An experimental study . Arch Orthop Trauma Surg . 2012 ; 132 ( 11 ): 1589 – 1594 . Crossref PubMed Google Scholar
27. Mündermann A , Dyrby CO , D’Lima DD , Colwell CW Jr , Andriacchi TP . In vivo knee loading characteristics during activities of daily living as measured by an instrumented total knee replacement . J Orthop Res . 2008 ; 26 ( 9 ): 1167 – 1172 . Crossref PubMed Google Scholar
28. Jaeger S , Rieger JS , Bruckner T , Kretzer JP , Clarius M , Bitsch RG . The protective effect of pulsed lavage against implant subsidence and micromotion for cemented tibial unicompartmental knee components: An experimental cadaver study . J Arthroplasty . 2014 ; 29 ( 4 ): 727 – 732 . Crossref PubMed Google Scholar
29. Miskovsky C , Whiteside LA , White SE . The cemented unicondylar knee arthroplasty: An in vitro comparison of three cement techniques . Clin Orthop . 1992 ; 284 : 215 – 220 . Google Scholar
30. Jasty M , Bragdon C , Burke D , O’Connor D , Lowenstein J , Harris WH . In vivo skeletal responses to porous-surfaced implants subjected to small induced motions . J Bone Joint Surg Am . 1997 ; 79-A ( 5 ): 707 – 714 . Crossref PubMed Google Scholar
31. No authors listed . Hip and Knee Arthroplasty: Annual Report 2014 . Australian Orthopaedic Association National Joint Replacement Registry . 2014 . https://aoanjrr.sahmri.com/documents/10180/172286/Annual+Report+2014 ( date last accessed 9 December 2021 ). Google Scholar
32. No authors listed . Annual Report 2011 . The Swedish Knee Arthroplasty Register . 2011 . http://www.myknee.se/pdf/115_SKAR2011_Eng1.0.pdf ( date last accessed 9 December 2021 ). Google Scholar
33. Niinimäki T , Eskelinen A , Mäkelä K , Ohtonen P , Puhto AP , Remes V . Unicompartmental knee arthroplasty survivorship is lower than TKA survivorship: a 27-year Finnish registry study . Clin Orthop Relat Res . 2014 ; 472 ( 5 ): 1496 – 1501 . Crossref PubMed Google Scholar
34. Heyse TJ , El-Zayat BF , De Corte R , et al. UKA closely preserves natural knee kinematics in vitro . Knee Surg Sports Traumatol Arthrosc . 2014 ; 22 ( 8 ): 1902 – 1910 . Crossref PubMed Google Scholar
35. Jung MC , Chung JY , Son KH , et al. Difference in knee rotation between total and unicompartmental knee arthroplasties during stair climbing . Knee Surg Sports Traumatol Arthrosc . 2014 ; 22 ( 8 ): 1879 – 1886 . Crossref PubMed Google Scholar
36. Langdown AJ , Pandit H , Price AJ , et al. Oxford medial unicompartmental arthroplasty for focal spontaneous osteonecrosis of the knee . Acta Orthop . 2005 ; 76 ( 5 ): 688 – 692 . Crossref PubMed Google Scholar
37. Radke S , Wollmerstedt N , Bischoff A , Eulert J . Knee arthroplasty for spontaneous osteonecrosis of the knee: Unicompartimental vs bicompartimental knee arthroplasty . Knee Surg Sports Traumatol Arthrosc . 2005 ; 13 ( 3 ): 158 – 162 . Crossref PubMed Google Scholar
38. Bruni D , Iacono F , Raspugli G , Zaffagnini S , Marcacci M . Is unicompartmental arthroplasty an acceptable option for spontaneous osteonecrosis of the knee? Clin Orthop Relat Res . 2012 ; 470 ( 5 ): 1442 – 1451 . Crossref PubMed Google Scholar
Author contributions
J. A. Eckert: Writing – original draft, Data curation, Formal analysis, Investigation, Visualization.
R. G. Bitsch: Supervision, Validation.
R. Sonntag: Software, Visualization, Methodology.
T. Reiner: Methodology, Resources.
M. Schwarze: Validation, Visualization.
S. Jaeger: Funding acquisition, Project administration, Supervision, Writing – review & editing
Funding statement
The author or one or more of the authors have received or will receive benefits for personal or professional use from a commercial party related directly or indirectly to the subject of this article.
ICMJE COI statement
S. Jaeger reports grants from Johnson & Johnson, DePuy Synthes, B. Braun Aesculap, Waldemar Link, Heraeus Medical, Zimmer Biomet, Peter Brehm GmbH, CeramTec, and Implantcast, all unrelated to the study. R. Sonntag is employed by AMTI, and reports grants from CeramTec, and payment for lectures including service on speakers bureaus from DePuy Synthes, unrelated to the study.
Open access funding
The authors confirm that the open access fee for this study was self-funded.
