


Abstract
Objectives
This study aimed to investigate time-dependent gene expression of injured human anterior cruciate ligament (ACL), and to evaluate the histological changes of the ACL remnant in terms of cellular characterisation.
Methods
Injured human ACL tissues were harvested from 105 patients undergoing primary ACL reconstruction and divided into four phases based on the period from injury to surgery. Phase I was < three weeks, phase II was three to eight weeks, phase III was eight to 20 weeks, and phase IV was ≥ 21 weeks. Gene expressions of these tissues were analysed in each phase by quantitative real-time polymerase chain reaction using selected markers (collagen types 1 and 3, biglycan, decorin, α-smooth muscle actin, IL-6, TGF-β1, MMP-1, MMP-2 and TIMP-1). Immunohistochemical staining was also performed using primary antibodies against CD68, CD55, Stat3 and phosphorylated-Stat3 (P-Stat3).
Results
Expression of IL-6 was mainly seen in phases I, II and III, collagen type 1 in phase II, MMP-1, 2 in phase III, and decorin, TGF-β1 and α-smooth muscle actin in phase IV. Histologically, degradation and scar formation were seen in the ACL remnant after phase III. The numbers of CD55 and P-Stat3 positive cells were elevated from phase II to phase III.
Conclusions
Elevated cell numbers including P-Stat3 positive cells were not related to collagens but to MMPs’ expressions.
Article focus
Our hypothesis was that there is a time-dependent alteration of anabolic and catabolic matrix gene expression and cell distribution in an injured anterior cruciate ligament (ACL)
Key messages
Expressions of COL1 and -3 were seen mainly in the subacute phase, and the expressions of MMP-1 and MMP-2 followed by biglycan, decorin and α-SMA were seen in the chronic phases
Stat3-activated cells also existed in injured ACL mainly in the chronic phases
Strengths and limitations
We showed the changes of gene expressions of remnant human ACL over time
The limitations of this study were that a normal control was lacking and protein levels were not examined
Introduction
The injured anterior cruciate ligament (ACL) is considered to exhibit an impaired healing response and attempts at surgical repair have not been successful.1,2 The reasons for this have been attributed to the hostile environment of synovial fluid.3 In the intra-articular environment of the ACL, there is no evidence of tissue-bridging between the femoral and tibial remnants of the ACL, and this structural defect is likely to be a key factor in the failure of the ACL healing.4 Many studies using a provisional scaffold have been conducted to improve the results of strategies for ACL healing; however, the mechanical properties of these products were not satisfactory when compared with the intact ACL.5,6
Besides the structural aspects, cellular factors are also important for ACL healing. Histologically, the ruptured human ACL undergoes four phases: inflammation, epiligamentous regeneration, proliferation and remodeling, and a synovial lining cell layer containing myofibroblast-like cells expressing α-smooth muscle actin (α-SMA) is formed on the surface of the ruptured ACL between eight and 20 weeks after rupture.4 Myofibroblasts activated by transforming growth factor-β1 (TGF-β1) promote the formation of scar tissue in wound healing7 and also in knee arthrofibrosis tissue; myofibroblasts expressing α-SMA may be involved in tissue fibrosis.8 It is possible that myofibroblast-like cells in the synovial layer of the injured ACL also play an important role in scar tissue formation that can negatively affect the mechanical properties of the ligament.
The degeneration of the remnant ACL, caused by proteases and enzymes, progresses gradually after injury.9 Previous studies have revealed that higher levels of active matrix metalloproteinase (MMP)-2 are seen in ACL fibroblasts than in those of the medial collateral ligament (MCL), and may be one of the reasons for the poor healing response of the injured ACL.10,11 The differences of the characteristics of ACL and MCL fibroblasts may be due to the environment of synovial fluid. Interleukin (IL)-6, one of the inflammatory cytokines, was found to be highly elevated in synovial fluid from ACL injured knees compared with uninjured controls.12 The IL-6-type cytokines exert a inflammatory effect through the transcription factors termed STATs (signal transducer and activator of transcription),13 and Stat3 has been shown to be active in synovial fibroblasts secreting proteases and enzymes that degrade surrounding matrix in adjuvant arthritis and rheumatoid arthritis (RA).14 It is possible that these synovial fibroblasts also exist in the remnants of the ruptured ACL, leading to further degeneration.
The objectives of this study were to examine the time-dependent gene expression for various proteins that contribute to the composition of ACL tissue, its structural organisation and reaction to injury, and also to evaluate the remnant ACL histologically in terms of degradation of extracellular matrix and cellular characterisation. Our hypothesis was that in injured ACL, gene expressions involved in degradation of surrounding matrix are elevated besides increasing Stat3-activated cells, followed by high expressions related to the subsequent formation of scar tissue.
Materials and Methods
Injured ACL tissue was harvested from 105 patients during primary ACL reconstruction. There were 38 males and 67 females with a mean age of 24.2 years (12 to 59). The injured ligaments were transected at their tibial attachment, femoral attachment or adhesive site of the ruptured end, and these tibial stumps removed en bloc arthroscopically. The removed stumps were marked with a suture at the site of tibial transaction. These specimens were divided into four phases based on the interval from injury to surgery, according to a previous histological study4: phase I was < three weeks (n = 20); phase II three to eight weeks (n = 35); phase III eight to 20 weeks (n = 27); and phase IV > 20 weeks (n = 23). All specimens were obtained with informed consent and with the approval of the Committee of Medical Ethics of our institute.
A total of 16 injured samples were allocated to histological and immunohistochemical analysis (comprising four in each group) and another 16 allocated to western blotting test (four in each group). The remaining 73 injured ACLs were used for identification of gene expression.
Identification of up- and down-regulated gene expression during injury using quantitative polymerase chain reaction (PCR)
A total of 73 injured ACLs were used for mRNA expression analysis. These 73 patients had a mean age of 23.9 years (12 to 59); 12 were phase I, 27 phase II, 19 phase III and 15 phase IV. Two sections were removed from each ligament: from the ruptured end and from the mid substance approximately 1 cm from the bony insertion. In the cases of partial tear, specimens were harvested from ruptured bundles in the same way. A total 30 mg of tissue pieces were homogenised in Buffer RLT (Qiagen, Austin, California) using a Polytron (Kinematica Inc., Bohemia, New York). Total RNA was isolated from the samples with an RNeasy Fibrous Tissue Midi Kit (Qiagen) and 0.5 µg of total RNA was reverse transcribed to complementary DNA (cDNA) using the SuperScript First-Strand Synthesis System for RT-PCR (Invitrogen, Carlsbad, California). PCR reactions were performed and monitored using an ABI Prism 7300 Sequence Detection System (Applied Biosystems, Foster City, California). The data were analysed by SDS 2.1 software (Applied Biosystems), and all the markers were normalised to the reference gene, glyceraldehydes-3-phosphate dehydrogenase (GAPDH). The Ct value of each marker was subtracted from the Ct value of GAPDH to derive ΔCt value. The normalised expression of each marker was calculated as 2-ΔCt (Applied Biosystems). Primers for human collagen types 1 (COL 1) (Hs00164004_ml) and 3 (COL 3) (Hs00164103_ml), biglycan (Hs00156076_ml), decorin (Hs00370385_ml), α-SMA (Hs00426835_gl), IL-6 (99999032_ml), TGF-β1 (Hs00998133_ml), MMP-1 (Hs00233958_ml), MMP-2 (Hs00234422_ml), tissue inhibitor of metalloprotainases-1 (TIMP-1) (Hs00171558_ml) and GAPDH (Hs99999905_ml) were pre-designed by Assays-on-demand Gene Expression products (Applied Biosystems). These markers were selected for the study based on their functions that were suspected to contribute toward ACL tissue composition and structural organisation15 and reaction to injury.
Histological and immunohistochemical analysis
A total of 16 ACLs were used for histological and immunohistochemical analysis. The patients from which the samples were harvested had a mean age of 22.3 years (14 to 43), and there were four samples from each phase. After the ligaments removed en bloc were fixed in 10% neutral buffered formalin, specimens were embedded longitudinally in paraffin and sectioned. Serial sections of 4 µm were stained with haematoxylin and eosin (H& E). Next, tissue sections were stained with primary antibodies to the macrophage marker CD68 (clone KP1; Dako, Hamburg, Germany) at a dilution of 1:100, the fibroblast marker CD5516,17 (H-319; Santa Cruz Biotechnology, Inc., Santa Cruz, California) at a dilution of 1:25, Stat3 (79D7; Cell Signaling Technology Inc., Danvers, Massachusetts) at a dilution of 1: 25 and Phospho-Stat3 (Tyr705, D3A7; Cell Signaling Technology Inc.) (P-Stat3) at a dilution of 1:50 on automated Benchmark system (Ventana Medical Systems Inc., Tucson, Arizona). Image analysis was performed in ruptured ends and midsubstances with multiple digital photomicrographs (Olympus, Tokyo, Japan) of sections taken under high-power field. Immunopositive areas in ten representative sections of each sample were analysed with ImageJ (National Institute of Health, Bethesda, Maryland) software.
Western blotting
A total of 16 ACLs were used for western blotting. The patients from which the samples were harvested had a mean age of 26.3 years (13 to 56), and there were four samples from each phase. Samples were homogenised in ice-cold lysis buffer containing 1% Nonidet P-40, 140 mM NaCl, 10 mM EDTA (3 Na), 20 mM Tris-HCl PH 7.4, 1 mM phenylmethylsulfonyl fluoride and 1 mg/ml iodoacetamide. Proteins were quantified (Bradford; Bio-Rad, Hercules, California) and equal amounts of protein (15 µg) were separated on SDS-polyacrylamide gel electrophoresis, transferred to polyvinylidine fluoride transfer membrane, and blocked for 1 h at 25°C with PhosphoBLOKER Blocking Reagent (Cell Biolabs Inc., San Diego, California). The membrane was then incubated with an appropriate dilution of anti-phosphorylated Stat3 antibody (Tyr705, D3A7; Cell Signaling Technology Inc.) and anti-Stat3 antibody (79D7; Cell Signaling Technology Inc.) overnight at 37°C, and reacted with enhanced chemiluminescence anti-rabbit IgG antibody labeled with horseradish peroxidase (Amersham, Buckinghamshire, United Kingdom). Immune complex detection was performed using a Kodak X-AR (Eastman Kodak Co. Scientific Imaging Systems, Rochester, New York). Semi-quantitative analysis was performed with ImageJ software.
Statistical analysis
Data from gene expression and immunohistochemical analysis are presented as a median and a Steel-Dwass test was performed to detect time-dependent variation of each marker for multiple comparisons. Data from western blotting are presented as mean with standard deviation (sd) and Tukey’s post-hoc test was performed on the image data to detect time-dependent variation of protein levels for multiple comparisons. Statistical significance of was set at p < 0.05.
Results
Pattern of gene expression
There were no significant differences between the four phases in patient gender or age. Although there was a wide age range of the patients, this study found that there was no significant difference between age and gene expression of the measured substances (Spearman’s rank correlation coefficient, p > 0.05). COL 1 was significantly higher in phase II than in phases I and IV (p = 0.008 and p = 0.009, respectively) (Fig. 1). COL 3 showed no statistical differences among the phases. Biglycan was significantly higher in phases II and III than in phase I (p = 0.039 and p = 0.026, respectively) and decorin was significantly higher in phase IV than in the other phases (p = 0.017, p = 0.0005 and p = 0.018, respectively). α-SMA was significantly higher in phase IV compared with phase I only (p = 0.029). IL-6 was higher in phases I, II and III compared with phase IV (p = 0.011, p = 0.013 and p = 0.016, respectively). TGF-β1 was significantly higher in phase IV than in phases I and II (p = 0.020 and p = 0.031, respectively). MMP-1 and MMP-2 were higher in phase III compared with phase IV (p = 0.003 and p = 0.025, respectively). TIMP-1 expression level was constant throughout all phases.

Fig. 1
Box plots showing the relative mRNA expression of collagen type 1 (COL 1), COL 3, biglycan, decorin, α-smooth muscle actin (α-SMA), interleukin-6 (IL-6), transforming growth factor-β1 (TGF-β1), matrix metalloproteinase-1 (MMP-1), MMP-2 and tissue inhibitor of metalloproteinases-1 (TIMP-1). In each box plot the y-axis represents the normalised ratio, the box the median and interquartile range, the whiskers the 10th and 90th percentiles and ° the outliers. (* p < 0.05, ** p < 0.01).
Histological change and distribution of Stat3-activated fibroblast-like cells
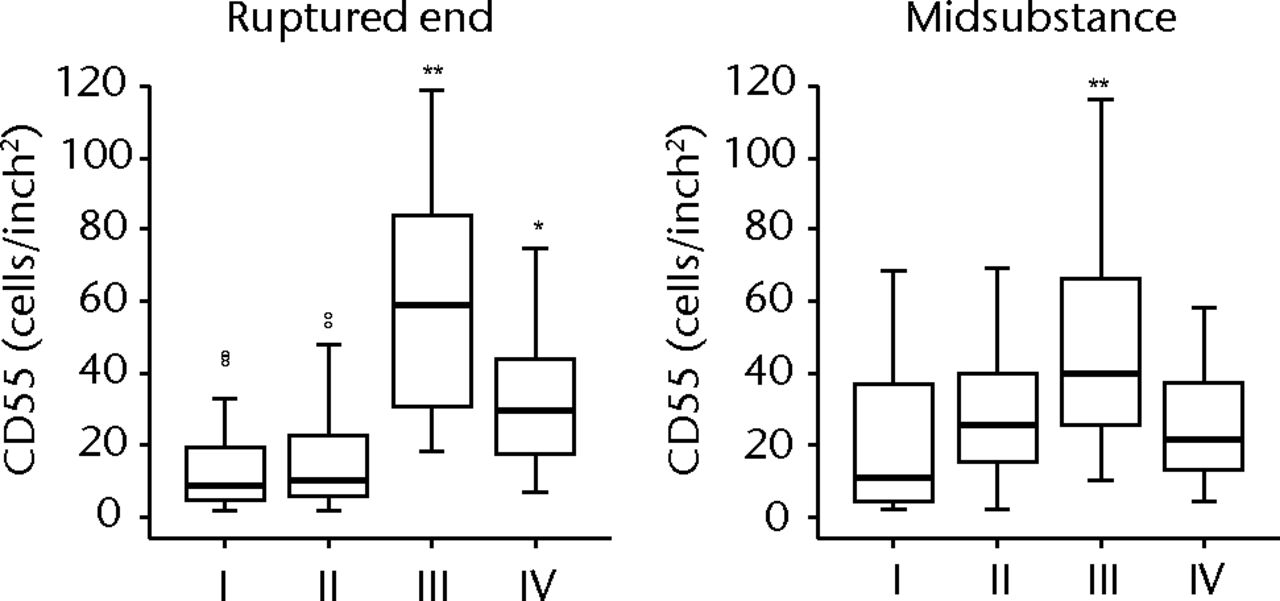
H & E staining showed that the encapsulation of the synovial tissue and tissue degradation were seen at the ruptured end from phase II to III, and tissue changed to fibrosis in phase IV (Fig. 2a). CD68 positive cells existed in phase I in the ruptured end and midsubstance, and from phase II, CD68 positive cells were mainly seen in the synovial layer. Conversely, the number of CD55 positive cells was higher in phase III than in other phases in both ruptured end (all p < 0.001) and midsubstance of the remnant ACL (p < 0.001, p = 0.042 and p = 0.001 for phases I, II and IV) (Fig. 2b). In phase IV, these cells existed merely in the synovial lining layer of the ruptured end and were noticeably low in density. Stat3 positive cells as a positive control were also localised with CD55 positive cells on serial sections. The number of P-Stat3 positive cells was higher in phase III in both the ruptured end and midsubstance than in the early phases (both p < 0.001), being especially prominent in the synovial lining layer (Fig. 2c). In phase IV, the positive cells remained in the synovial lining layer, particularly in the ruptured end. Expression levels of P-Stat3 were higher in phases III and IV than in phases I and II from the western blotting analysis (Fig. 3).
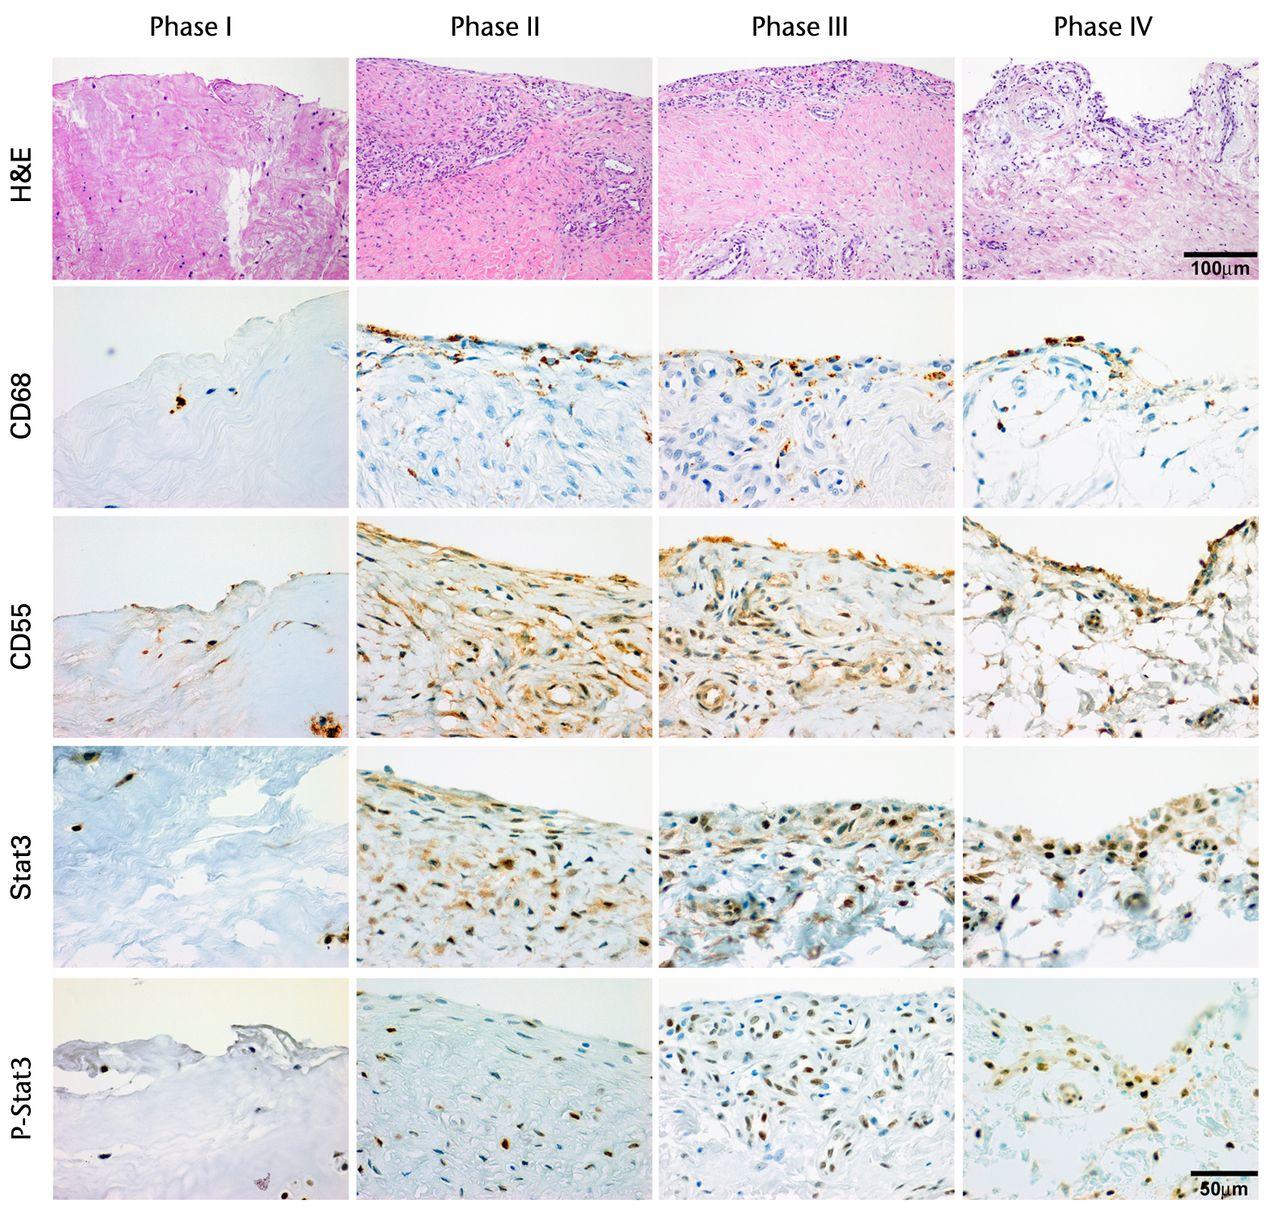

Figs. 2a - 2c
Figure 2a – haemotoxylin and eosin staining (H & E) and cell distributions positive for CD68, CD55, Stat3 and P-Stat3 of the ruptured end of the ligament in each phase. Figures 2b and 2c – box plots showing quantification using ImageJ software of b) the CD55 positive area and c) the P-Stat3 positive areas for the ruptured and mid areas of the ligament for each phase. The box represents the median and interquartile range, the whiskers the 10th and 90th percentiles and ° the outliers (*, significant difference (p < 0.01) compared with phases I and II; **, significant difference compared with phases I, II and IV).


Discussion
The present study showed that COL 1 and 3 expressions were seen mainly in phase II. Conversely, MMPs expressions and the number of CD55 and P-Stat3 positive cells were highest in phase III among the phases. Expressions of decorin, α-SMA and TGF-β1 were observed mainly in phase IV compared with other phases. These results corresponded to our hypotheses.
A time-dependent alteration of anabolic and catabolic gene expression has been shown after ACL injury in a rabbit experimental model,18 and the results of our human study corresponded in some points and differed in others. COL1 and 3 expressions were mainly seen in the subacute phase (phase II). These results were consistent with the experimental model. High COL1 expression in the early phase after rupture was also seen in other studies15,19 and the increase in collagen production including COL1 and COL 3 early after injury is a typical cell response during tissue healing.20
In the chronic phase after injury (phases III and IV), the genetic expression of some proteins changed dramatically. Expression of MMPs, especially MMP-2 was seen mainly in phase III, suggesting a degradable rather than a regenerative feature of organisation on a genetic level, because MMP-2 expression was higher in contrast to unchanged remained expression of TIMP-1. Furthermore, expressions of proteoglycans and α-SMA were seen mainly in phase IV. These results were different from an experimental study that showed high expression of MMP-13 and α-SMA at 1 week after ACL injury.18 One of the reasons for these differences might be the differences of cytokine profiles. First, the present human study showed that IL-6 expression was seen mainly from phase I to III. Previous studies confirmed high levels of IL-6 in the synovial fluid in the acute phase after ACL injury12,21 and the IL-6 type cytokines are an important family of mediators involved in general inflammation and healing response.13 These results suggested that injured human ACL is chronically inflamed and native tissue healing is delayed compared with other connective tissues. Second, TGF-β1 expression was seen mainly in phase IV. TGF-β1 is a major stimulator that plays a significant role in both the initiation of fibrotic cascades in skeletal muscle and the induction of myogenic cells to differentiate into myofibroblastic cells expressing vimentin and α-SMA in injured muscle.22 Murray et al4 described in a previous study that many of the epiligamentous and synovial cells encapsulating the remnants of the ACL contained α-SMA after rupture, and the results of our study partly correlated with theirs. Expression of decorin was also significantly elevated in phase IV. A previous study has shown that increased decorin expression is associated with scar formation.23 The higher expression of proteoglycans in addition to TGF-β1 and α-SMA suggested fibrotic characteristics in phase IV.
These observed gene expressions raised a new theory that higher expression of COL 1 is not related to cell number. CD55 positive cells were significantly highest in phase III among the phases, but COL 1 expression was lower and MMPs, PGs, TGF-β1 and α-SMA expressions were elevated. Therefore, we speculated that increased cells at the remnant ACL contained several cell types of fibroblast having different characteristics. Synovial fibroblast-like cells appeared to be of fibroblast origin,24 however, the authors demonstrated that the functional spectrum of these cells showed clear differences from fibroblasts from other sites.25,26 These cells secrete a variety of cytokines27 as well as matrix metalloproteinase,28 proteoglycans and arachidonic acid metabolites.29 Moreover, another study indicated that Stat3 may be an important molecule for RA synovial fibroblast survival, secreting proteases and enzymes that degrade surrounding matrix.30 Our results revealed that higher IL-6 expression was seen until phase III and the number of Stat3-activated cells was elevated in phase III in not only the synovial layer but also in the midsubstance of the remnant ACL. It is possible that these cells triggered by IL-6 expression may produce differences in healing potential to other extra-articular ligaments.
Primary repair by suture has been extensively used in the past but is currently regarded as unsatisfactory. Strand et al31 observed a 50% percentage of instability after long-term follow-up of primary ACL repair and the biological factors are still unknown. Loss of mechanical signal results in an increase in MMP-13 and α-SMA expression in the experimental model.18 These data, when combined with the results of the current study, support the theory that stress deprivation may bring matrix degeneration and contraction. However, suture alone or besides platelet-rich plasma, was not satisfactory in mechanical properties compared with intact ACL.6 It is possible that change of fibroblast’s characteristics induced by cytokines might be also responsible for poor healing capacity of the ACL, especially synovial fibroblast-like cells activated by IL-6. Short-term regulation of these cells might reduce MMPs activity and be beneficial if ligament augmentation or primary repair were a treatment option.
One limitation of this study was that a normal control was lacking. We were unable to obtain intact ACLs from young people. Second, we examined gene expression only, and protein levels were not examined in this study. Therefore, it remains unclear whether Stat3-activated fibroblast-like cells yielded the variation of the natural course of ACL after injury. A third limitation was that we were unable to distinguish Stat3-activated myofibroblast-like cells from Stat3-activated synovial fibroblast-like cells immunohistochemically. An in depth study of the origin and characteristics of each cell type may produce further understanding of the poor healing potential of the ACL.
In conclusion, our study revealed that there is a time-dependent alteration of matrix gene expression after ACL injury. Expressions of COL1 and 3 were seen mainly in the subacute phase, and the expressions of MMP-1 and MMP-2 followed by decorin and α-SMA were seen in the chronic phase. Furthermore, Stat3-activated fibroblast-like cells also existed in injured ACL mainly in the chronic phase.
1 O’Donoghue DH , FrankGR, JeterGL, et al.Repair and reconstruction of the anterior cruciate ligament in dogs: factors influencing long-term results. J Bone Joint Surg [Am]1971;53-A:710–718. Google Scholar
2 Cabaud HE , RodkeyWG, FeaginJA. Experimental studies of acute anterior cruciate ligament injury and repair. Am J Sports Med1979;7:18–22.CrossrefPubMed Google Scholar
3 Woo SL , VogrinTM, AbramowitchSD. Healing and repair of ligament injuries in the knee. J Am Acad Orthop Surg2000;8:364–372.CrossrefPubMed Google Scholar
4 Murray MM , MartinSD, MartinTL, SpectorM. Histological changes in the human anterior cruciate ligament after rupture. J Bone Joint Surg [Am]2000;82-A:1387–1397.CrossrefPubMed Google Scholar
5 Murray MM , SpindlerKP, DevinC, et al.Use of a collagen-platelet rich plasma scaffold to stimulate healing of a central defect in the canine ACL. J Orthop Res2006;24:820–830.CrossrefPubMed Google Scholar
6 Murray MM , PalmerM, AbreuE, et al.Platelet-rich plasma alone is not sufficient to enhance suture repair of the ACL in skeletally immature animals: an in vivo study. J Orthop Res2009;27:639–645. Google Scholar
7 Chen Y , Shi-WenX, van BeekJ, et al.Matrix contraction by dermal fibroblasts requires transforming growth factor-beta/activin-linked kinase 5, heparan sulfate-containing proteoglycans, and MEK/ERK: insights into pathological scarring in chronic fibrotic disease. Am J Pathol2005;167:1699–1711.CrossrefPubMed Google Scholar
8 Unterhauser FN , BoschU, ZeichenJ, WeilerA. Alpha-smooth muscle actin containing contractile fibroblastic cells in human knee arthrofibrosis tissue: winner of the AGA-DonJoy Award 2003. Arch Orthop Trauma Surg2004;124:585–591. Google Scholar
9 Amiel D , IshizueKK, HarwoodFL, KitabayashiL, AkesonWH. Injury of the anterior cruciate ligament: the role of collagenase in ligament degeneration. J Orthop Res1989;7:486–493.CrossrefPubMed Google Scholar
10 Zhou D , LeeHS, VillarrealF, et al.Differential MMP-2 activity of ligament cells under mechanical stretch injury: an in vitro study on human ACL and MCL fibroblasts. J Orthop Res2005;23:949–957.CrossrefPubMed Google Scholar
11 Zhang J , YangL, TangZ, et al.Expression of MMPs and TIMPs family in human ACL and MCL fibroblasts. Connect Tissue Res2009;50:7–13.CrossrefPubMed Google Scholar
12 Higuchi H , ShirakuraK, KimuraM, et al.Changes in biochemical parameters after anterior cruciate ligament injury. Int Orthop2006;30:43–47.CrossrefPubMed Google Scholar
13 Heinrich PC , BehrmannI, HaanS, et al.Principles of interleukin (IL)-6-type cytokine signalling and its regulation. Biochem J2003;374:1–20.CrossrefPubMed Google Scholar
14 Shouda T , YoshidaT, HanadaT, et al.Induction of the cytokine signal regulator SOCS3/CIS3 as a therapeutic strategy for treating inflammatory arthritis. J Clin Invest2001;108:1781–1788.CrossrefPubMed Google Scholar
15 Bramono DS , RichmondJC, WeitzelPP, et al.Characterization of transcript levels for matrix molecules and proteases in ruptured human anterior cruciate ligaments. Connect Tissue Res2005;46:53–65.CrossrefPubMed Google Scholar
16 Berger I , WeckaufH, HelmchenB, et al.Rheumatoid arthritis and pigmented villonodular synovitis: comparative analysis of cell polyploidy, cell cycle phases and expression of macrophage and fibroblast markers in proliferating synovial cells. Histopathology2005;46:490–497.CrossrefPubMed Google Scholar
17 Hamann J , WishauptJO, van LierRA, et al.Expression of the activation antigen CD97 and its ligand CD55 in rheumatoid synovial tissue. Arthritis Rheum1999;42:650–658.CrossrefPubMed Google Scholar
18 Attia E , BrownH, HenshawR, GeorgeS, HannafinJA. Patterns of gene expression in a rabbit partial anterior cruciate ligament transection model: the potential role of mechanical forces. Am J Sports Med2010;38:348–356.CrossrefPubMed Google Scholar
19 Lo IK , MarchukL, HartDA, FrankCB. Messenger ribonucleic acid levels in disrupted human anterior cruciate ligaments. Clin Orthop Relat Res2003;407:249–258.CrossrefPubMed Google Scholar
20 Liu SH , YangRS, al-ShaikhR, LaneJM. Collagen in tendon, ligament, and bone healing: a current review. Clin Orthop Relat Res1995;318:265–278. Google Scholar
21 Cameron M , BuchgraberA, PasslerH, et al.The natural history of the anterior cruciate ligament-deficient knee: changes in synovial fluid cytokine and keratan sulfate concentrations. Am J Sports Med1997;25:751–754. Google Scholar
22 Li Y , FosterW, DeasyBM, et al.Transforming growth factor-beta1 induces the differentiation of myogenic cells into fibrotic cells in injured skeletal muscle: a key event in muscle fibrogenesis. Am J Pathol2004;164:1007–1019.CrossrefPubMed Google Scholar
23 Beanes SR , DangC, SooC, et al.Down-regulation of decorin, a transforming growth factor-beta modulator, is associated with scarless fetal wound healing. J Pediatr Surg2001;36:1666–1671.CrossrefPubMed Google Scholar
24 Barland P , NovikoffAB, HamermanD. Electron microscopy of the human synovial membrane. J Cell Biol1962;14:207–220.CrossrefPubMed Google Scholar
25 Muller-Ladner U , GayS. The SCID mouse: a novel experimental model for gene therapy in human rheumatoid arthritis. Drugs Today (Barc)1999;35:379–388. Google Scholar
26 Seemayer CA, Distler O, Kuchen S, et al. Rheumatoid arthritis: new developments in the pathogenesis with special reference to synovial fibroblasts. Z Rheumatol 2001;60:309–318 (in German). Google Scholar
27 Zvaifler NJ . Rheumatoid arthritis: the multiple pathways to chronic synovitis. Lab Invest1995;73:307–310. Google Scholar
28 Hembry RM , BaggaMR, ReynoldsJJ, HamblenDL. Immunolocalisation studies on six matrix metalloproteinases and their inhibitors, TIMP-1 and TIMP-2, in synovia from patients with osteo- and rheumatoid arthritis. Ann Rheum Dis1995;54:25–32.CrossrefPubMed Google Scholar
29 Firestein GS . Invasive fibroblast-like synoviocytes in rheumatoid arthritis: passive responders or transformed aggressors?Arthritis Rheum1996;39:1781–1790.CrossrefPubMed Google Scholar
30 Krause A , ScalettaN, JiJD, IvashkivLB. Rheumatoid arthritis synoviocyte survival is dependent on Stat3. J Immunol2002;169:6610–6616.CrossrefPubMed Google Scholar
31 Strand T , MolsterA, HordvikM, KrukhaugY. Long-term follow-up after primary repair of the anterior cruciate ligament: clinical and radiological evaluation 15-23 years postoperatively. Arch Orthop Trauma Surg2005;125:217–221.CrossrefPubMed Google Scholar
Funding statement:
None declared
Author contributions:
T. Naraoka: Study design, Acquisition of data, Analysis and interpretation of data, Drafting the manuscript
Y. Ishibashi: Conception of this study, Revising this manuscript critically for important intellectual content
E. Tsuda: Study design and coordination
Y. Yamamoto: Study design and coordination
S. Toh: Final approval of the version to be published
T. Kusumi: Data collection of the immunoassays, Analysis and interpretation of the data
I. Kakizaki: Data collection of the gene expressions, Analysis and interpretation of the data
ICMJE Conflict of Interest:
None declared
©2012 British Editorial Society of Bone and Joint Surgery. This is an open-access article distributed under the terms of the Creative Commons Attributions licence, which permits unrestricted use, distribution, and reproduction in any medium, but not for commercial gain, provided the original author and source are credited.
